Next Week's Risk Dashboard
- US inflation may only be napping
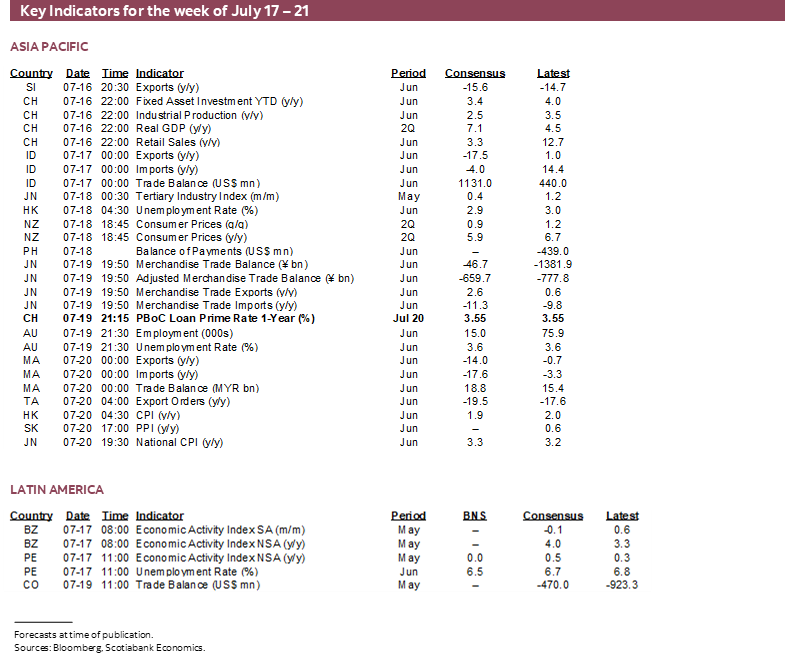
- China’s economy to showcase softness
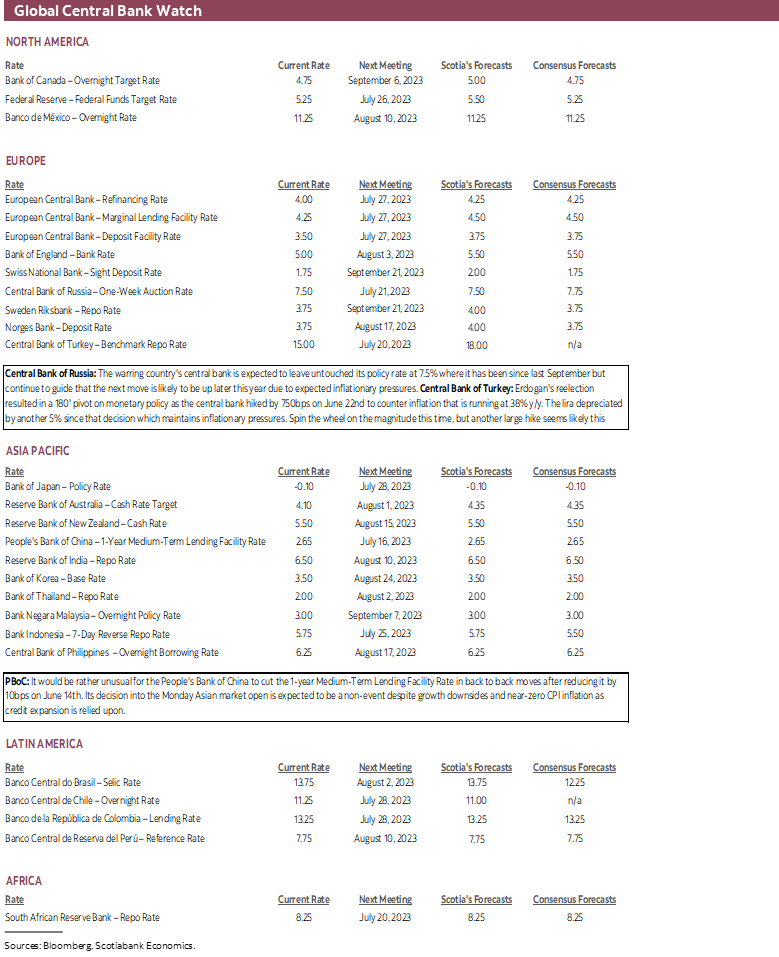
- PBOC to hold amid downside risks
- Canadian CPI a mere placeholder
- The Great Canadian Growth Myth
- US earnings season ramps up
- Russian, Turkish central banks to hike
- Australian jobs face downside risk
- US, UK and Canadian retail sales updates
- UK core inflation to remain near three-decade high
- Japanese core inflation volatile along firming trend
- NZ CPI won’t change much for the RBNZ
- Other global macro
Chart of the Week
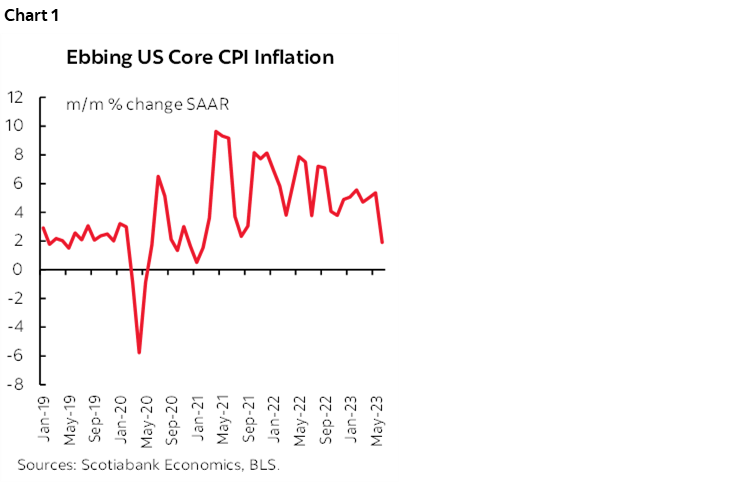
So, inflation’s gone poof, just like that. In just two short months, a soft pair of core US CPI readings landed into a pile of plush cushions and everyone’s rejoicing. Short of confetti raining down on street parades, markets are treating this as the end of a two-year war and putting a bid to US Treasuries.
It seems to me that markets are getting a little ahead of themselves and overconfident that the Fed will be done after hiking later this month on the 26th.
For one thing, chart 1 highlights the point that we’ve seen plenty of volatile head fakes on US core inflation with many months posting sudden drop offs only for inflation to be resurrected soon thereafter.
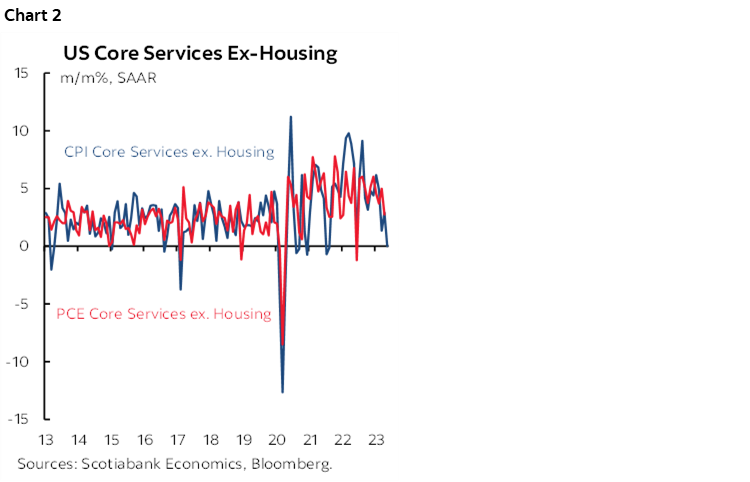
For another, core CPI services ex-housing—a focal point for the Fed—doesn’t necessarily line up with core PCE as chart 2 demonstrates; core CPI can be more volatile. This piece from the San Francisco Fed’s economists basically makes the point that it’s unclear whether ‘supercore’ inflation (services ex-housing) would cool as the unemployment rate may rise and generally doubts the connection between labour markets and supercore which is important if the US job market arrives at a turning point.
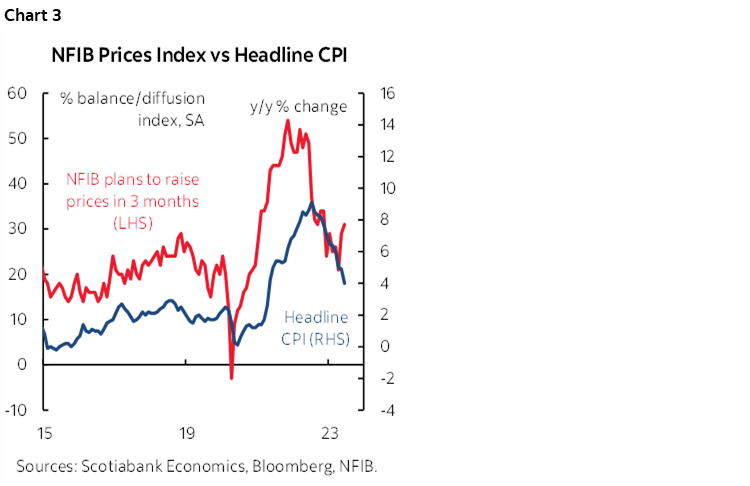
And what’s this? Small businesses signalling plans to begin raising prices again? Check out chart 3.
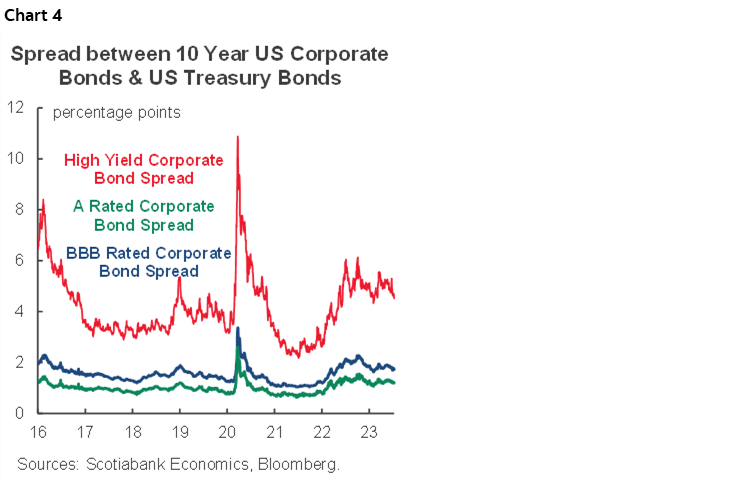
For another point, the trend easing in financial conditions may be fighting the Fed in that it adds offsetting supports to growth and inflation. The S&P500 is up by more than 25% since last October and only 6% below the all-time peak in late 2021. The USD is about 12% lower on a DXY basis over a similar period since last October and if this builds and persists then it adds to imported inflation. Credit is holding firm (chart 4). For all the concern in financial markets about Fed tightening and how horrible the effects may be, it doesn’t seem to be causing a whole lot of pain across this suite of metrics.
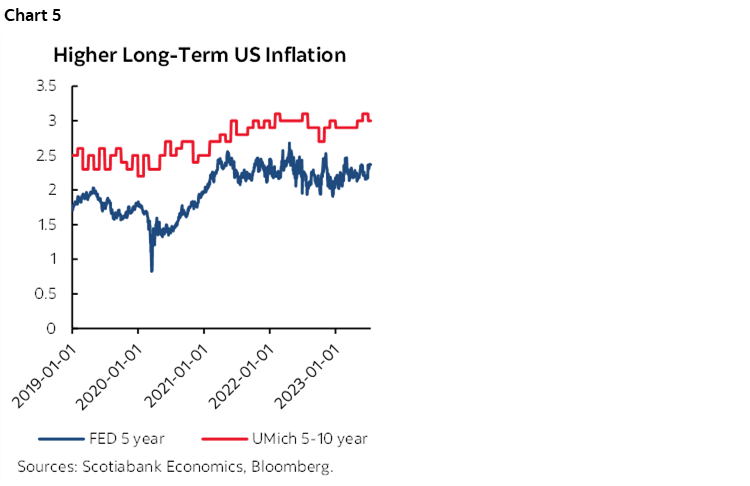
Further, measures of inflation expectations suggest there remains a longer-term challenge. Bonds sold off late this past week when consumers’ inflation expectations spiked as indicated by the University of Michigan consumer sentiment survey that itself posted a big jump in confidence. The UMich 5–10 year ahead measure of inflation expectations is the survey analog to the Fed’s preferred market gauge which is the 5-year ahead, 5-year forward measure with both shown in chart 5. Of course nobody can forecast inflation anywhere close to that far out in time, but it’s a sign of the mentality that remains open to driving behavioural changes in the face of persistent inflationary pressures.
Finally, while I won’t repeat it here, I’m still of the view that we’re in the early innings in terms of structural drivers of inflation and an ongoing need to revamp supply chains in the face shocks to them starting with the US election in 2016 and more restrictive trade policy thereafter, ditto for the Brexit vote that same year, then the pandemic, then the war in Ukraine, and now tensions surrounding Taiwan’s major role in the global electronics trade. Supply chains were spread too thinly without having to worry about border frictions, but increased border and policy frictions today amplify the need to tighten them up and pass on the likely higher costs in a rebalancing that brings higher operating costs as a trade-off to lowering financial distress costs.
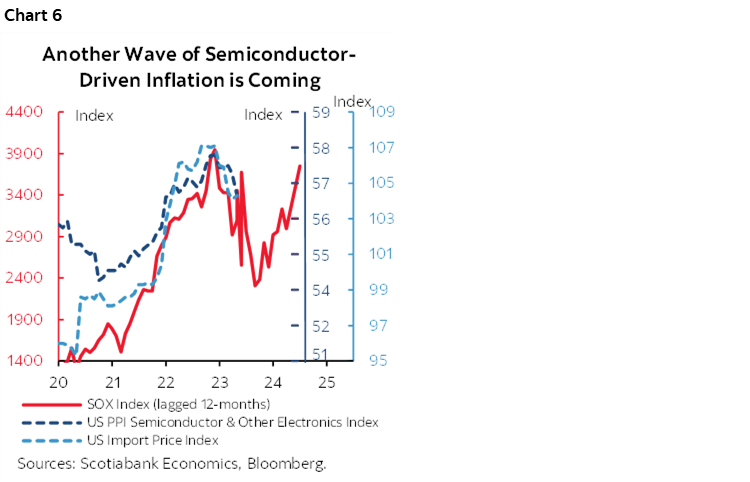
And as for AI’s influence, at least in the nearer term, it’s driving costs and supply chain pressures higher including through ongoing gains in semiconductor prices (chart 6).
Aware of such pressures, more workers across the world are rising up in favour of higher wage demands in excess of productivity gains, from Japan’s Shunto wage setting this Spring, to disruptive actions across Canada and other parts of the world.
CANADIAN INFLATION—A MERE PLACEHOLDER
Next up in the debate is that Canada will update CPI inflation for the month of June on Tuesday. This one is probably just a placeholder that may spark some market volatility but without settling anything in terms of positioning for the Bank of Canada’s next potential move.
That’s because the BoC has just splashed fresh ink on a new forecast to accompany their decision to hike again (recap here). They don’t have to come off the bench again until September 6th and so they have most of eight weeks to ponder their next move, do further analysis and maybe work on their golf handicaps or summertime bucket lists. During this period, they will deliver their Summary of Deliberations to the recent decision on July 26th, and then evaluate another inflation report on August 15th, one more report on jobs and wages on August 4th, their Senior Loan Officer Survey on August 14th, Q2 GDP on September 1st, the outcome of the Fed’s Jackson Hole symposium on August 24th – 26th, and sundry other developments at home and abroad. The BoC has made it clear that its next possible moves will be data dependent and this includes the suite of evidence that will become available.
I’ve estimated total CPI to rise by about 0.3% m/m in both seasonally unadjusted and adjusted terms. Traditional core CPI is estimated to rise by 0.4% m/m in seasonally adjusted terms. If I’m right and if there are no material revisions, then the 3-month moving average change of the month-over-month annualized change in traditional core CPI would land at about 3.9%, up from 3.6% the prior month.
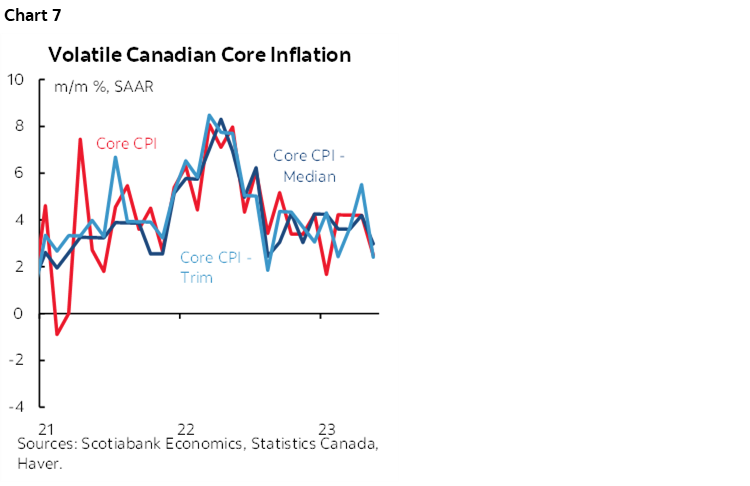
A further key that is even more difficult to estimate is what happens to the BoC’s preferred trimmed mean and weighted median measures of CPI. These figures are volatile but the best way of looking at them remains m/m SAAR rates of change (chart 7). When they accelerated in April they sparked concern at the BoC, only to slip back in May. The BoC smooths these various measures of core in order to take out some of the noise and upon doing so they remain well above the 2% headline inflation target that uses such measures as operational guides. They are difficult to estimate because the trimmed mean calculation that removes the top and bottom 20% of price changes (like mortgage interest....) and the weighted median that proxies the 50th percentile price change (that definitely is not mortgage interest...) are highly sensitive to swings across the components.
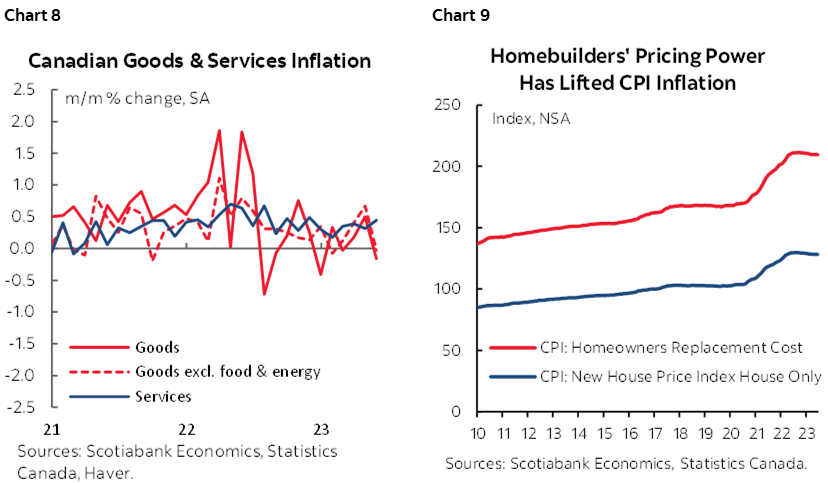
Among the things to watch for will be service price inflation that has remained hot, and whether the prior month’s deceleration in goods price inflation will persist (chart 8). Whether the direct role of house price inflation on CPI builds could play a modest role. Recall that Canadian CPI doesn’t use owners equivalent rent like the US, and instead uses the replacement cost of housing by relying upon builder prices excluding land. This measure accelerated during the pandemic and may be about to once more (chart 9).
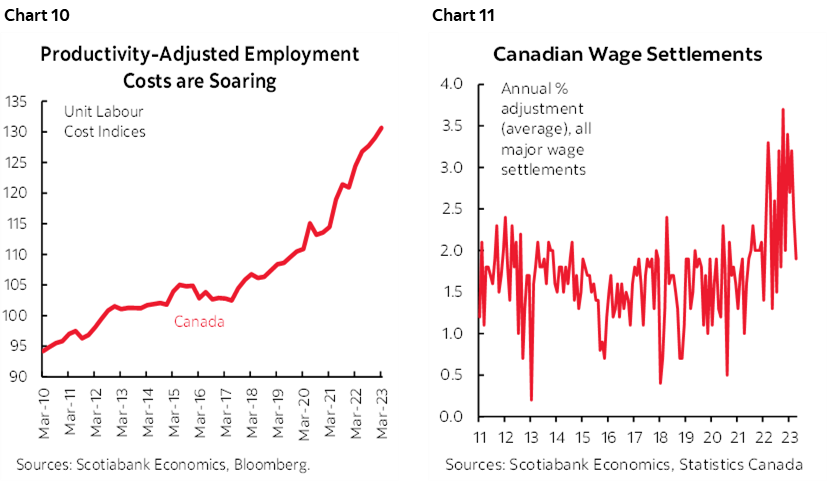
The Canadian economy remains well into excess aggregate demand. Wage growth remains in excess of awful labour productivity trends such that the combination points to rising unit labour costs that began before the pandemic but became amplified since then (chart 10). We should also get wage settlements data for May this week and at some uncertain point they should begin to reflect larger wage increases in the 30% of the Canadian labour force that is unionized and hence subject to collective bargaining. To date, these figures have been highly volatile, but the implementation lags of wage gains will probably take a while to work through and haven’t even begun to work through the data yet (chart 11).
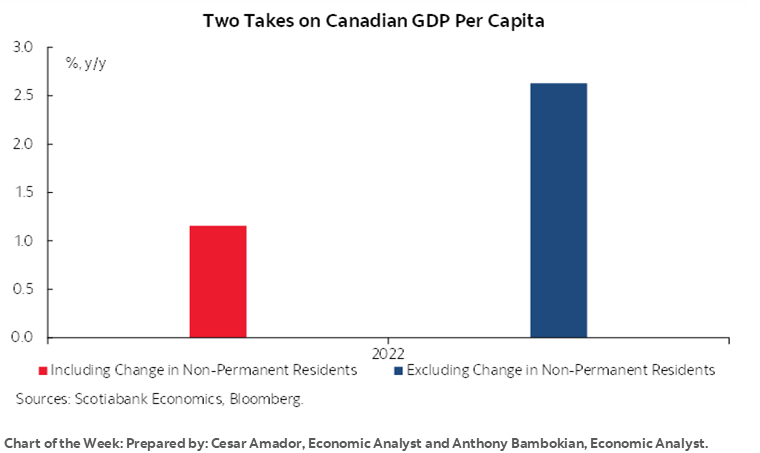
THE GREAT CANADIAN GROWTH MYTH?
Now while this may seem to be somewhat tangential to the prior dialogue on inflation, the matter of exactly how strong Canadian GDP growth may be flows straight into the discussion on evaluating excess demand and output gap pressures on inflation.
An increasingly popular point is that Canadian GDP growth may look good over time but isn’t after putting it in per capita terms to account for the fact that Canada’s population has surged. This is a bit of a red herring. In fact, it’s a rather large red herring. A truly smelly one in fact.
60% of Canada’s 1.05 million population increase in 2022 was due to the nonpermanent category that was up by about 608k. This category includes folks admitted under work and study permits and asylum claimants. Canada admitted about 550k new international students in 2022.
There are various reasons for such admissions but that’s not the point I’m about to make. The question at hand is whether it’s fair to dismiss GDP growth on the theory that GDP only advanced because of the population surged. The implicit assumption here is that all people added into an economy contribute in equal ways to GDP growth. This is probably very untrue. It’s a while back now, but I for one don’t recall being a huge boon to the economy during my student years. That’s likely also true for some of the other categories of temporary residents.
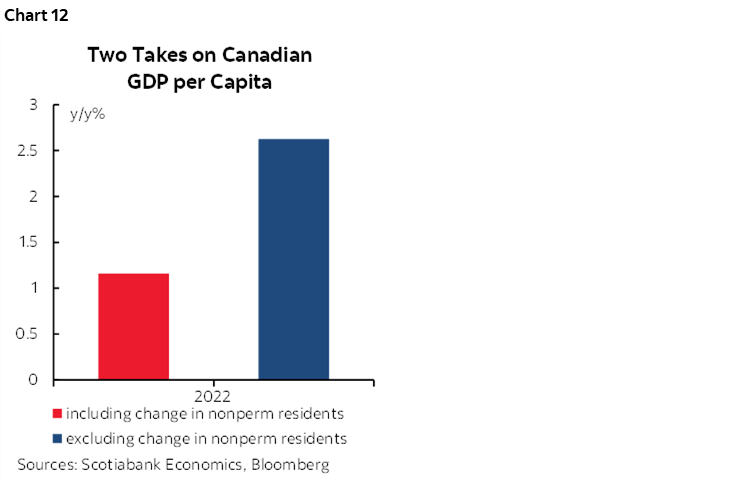
Chart 12 offers one way of compensating for this. Real GDP per capita barely grew in 2022 if we use total population. If we strip out the change in the nonpermanent category from total population and use that instead, then GDP per capita still grew by a strong 2.6% y/y. The truth may be somewhat in between, but probably still closer to the higher number in my opinion.
There are other problems with the growth-dissing population thesis. For one, if you’re going to look at GDP per capita in 2022 when population surged, then maybe do it instead on a trend basis to account for the fact that immigration collapsed in the pandemic.
PBoC TO HEADLINE CENTRAL BANKS
Only one major central bank will deliver a fresh policy decision this week and no change is likely.
The People’s Bank of China is unanimously expected to hold its 1-year Medium-Term Lending Facility Rate unchanged at 2.65% on Sunday evening (9:20pmET) just before GDP lands. It would be rather unusual for the PBOC to cut the policy rate in back-to-back moves after reducing it by 10bps on June 14th.
Recent comments by PBOC Deputy Governor Liu Guoqiang indicated a movement toward modest forms of stimulus and declared “We still have ample policy room to deal with unexpected challenges and changes. We need to be patient and confident in the economy’s continued and steady growth.”
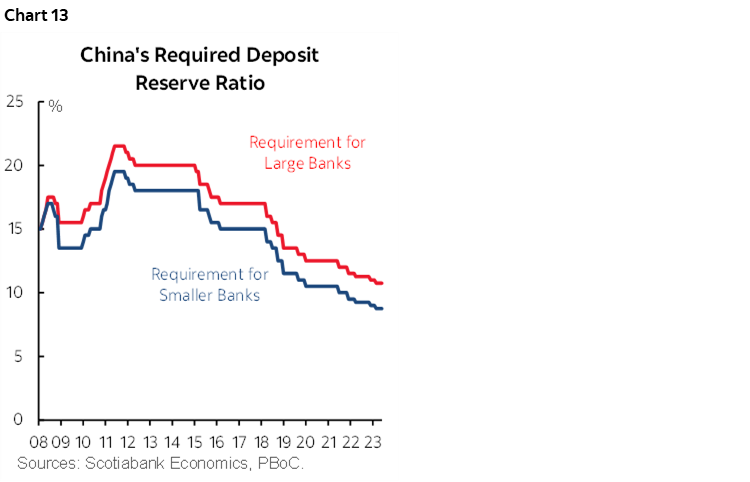
What I see in that quote is reference to “unexpected” challenges that suggests they would largely tap into room for easing only if conditions sharply deteriorated by more than expected as opposed to the muddling current situation. Liu advised that stimulus measures are likely to be targeted as officials suggested further cuts in the required reserve ratios may be coming (chart 13). This could have the effect of stoking further credit growth alongside modest easing of property financing constraints and liquidity supports.
Other central banks will be generally quiet. Russia’s central bank is expected to hike its key rate by 25–72bps (most expected 50bps) on Friday in the face of what they previously guided to be feared upside risk to inflation.
Turkey’s central bank is expected to hike its one-week repo rate by between 200–500bps on Thursday. My gosh the folks in that consensus would be beside themselves trying to forecast a quarter point here or there across other central banks.
CHINA’S ECONOMY IN FOCUS
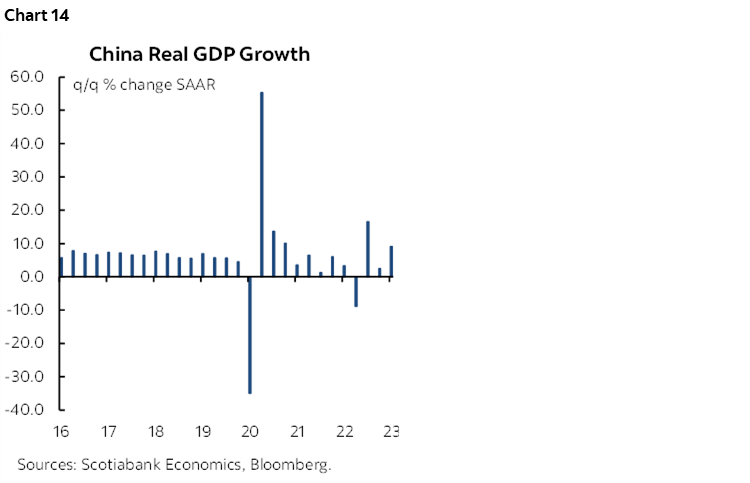
China’s economy will be a market focal point to start the week. Q2 GDP arrives on Sunday evening (ET) and is expected to post mild growth of under 1% q/q non-annualized but seasonally adjusted. That would extend a period of volatile but uncomfortably low trend growth and with some estimates pushing toward no growth (chart 14).
Simultaneously released figures for June on industrial production, retail sales and fixed investment will help us understand momentum into the third quarter and baked-in growth before Q3 data starts to arrive.
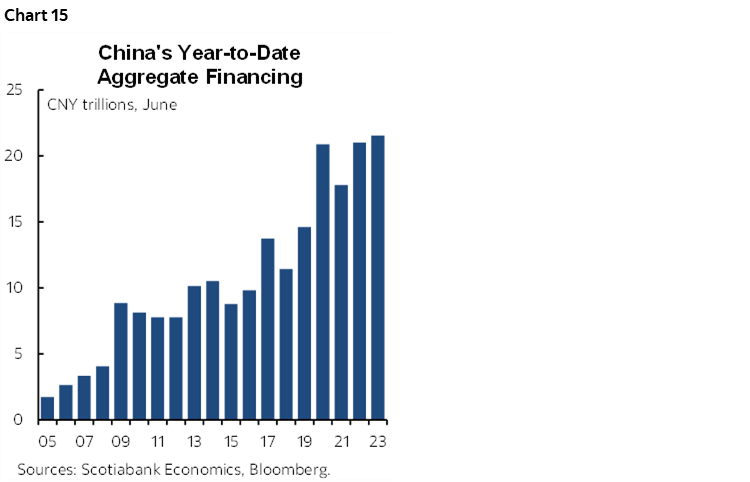
China’s economy faces a complicated set of challenges with mostly downside risk in the near term. More rapid growth in financings (chart 15) and potential further easing of property financing rules may help growth. There could be more of this forthcoming as alluded to in the PBOC section of this report.
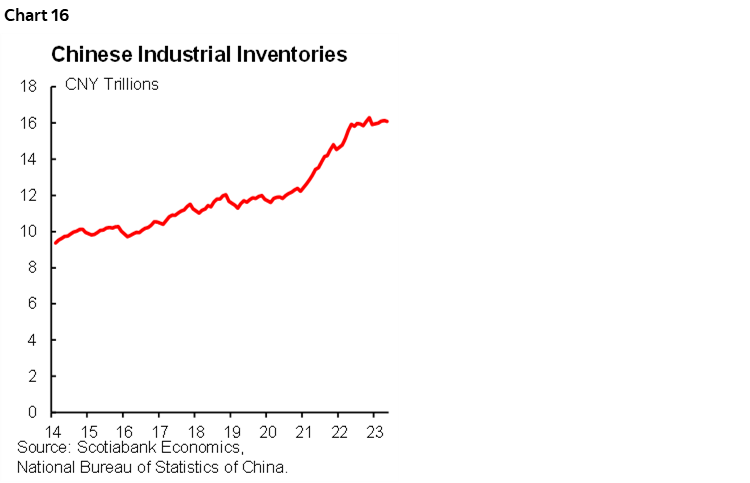
But policymakers are trying to lean against big downside risks like still bloated industrial inventories from the Covid Zero era (chart 16), downside risks to growth in key export markets, zippo population growth and an aging population owing to too much success over the decades toward discouraging anyone to have kids, monetary policy that is handcuffed by the Fed via the yuan connection, a protracted anti-tech campaign by the CCP, trade frictions and geopolitical matters such as how its allegiance to Russia has annoyed its key trading partners.
GLOBAL MACRO—US EARNINGS TO DOMINATE
The continuation of the US earnings season will couple with releases on the state of consumer spending in the US, UK and Canada plus Australian jobs and inflation reports from NZ and Japan to offer a little something for everyone.
The Q2 US earnings season will continue with 60 S&P500 firms slated to report. Financials will dominate, as is typical in the early stages of a multi-week parade. Twenty-five financial names like BofA, Morgan Stanley and Goldman Sachs will headline numerous entries including several regional banks. Also watch for Netflix, Tesla, some energy plays and rising breadth to the earnings season.
While it’s very early in the season, the earnings beat ratio is already tracking quite high with over 80% of firms beating EPS estimates and about two-thirds beating revenue estimates. So far, that hasn’t been enough to impress stocks perhaps because of what has been priced by the recent run-up in the S&P but also perhaps due to cautious guidance in some cases such as the potential impact of regulatory change on US banks.
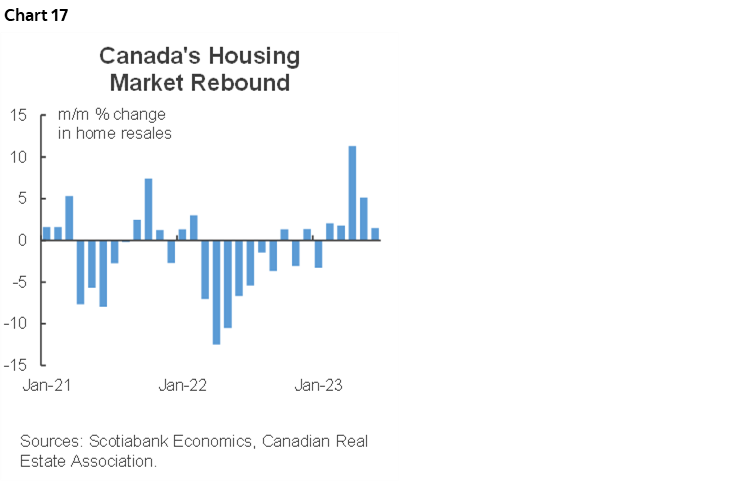
Other than CPI, the rest of the Canadian line-up will be light. Friday’s retail sales figures will probably post a decent rise of around ½% m/m, but this is based upon Statistics Canada’s advance guidance that has been marred by shaky reliability and declining sample response rates. Wholesale trade during May (Monday) is expected to post a strong gain based on advance guidance. Housing starts during June (Tuesday) could rebound from the volatile dip the prior month in which case they would add to the evidence on five consecutive monthly gains in existing home sales through to June (chart 17).
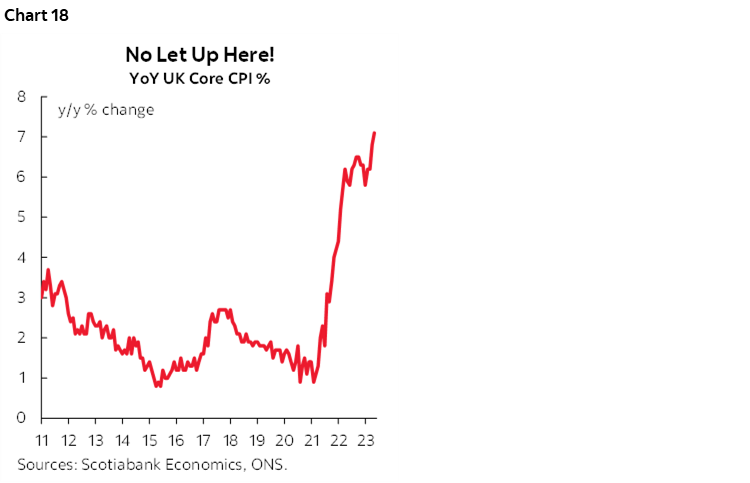
UK core CPI inflation is expected to remain near the highest reading since the early 1990s when the latest estimate for June lands on Wednesday (chart 18). June’s retail sales are expected to be little change in real terms (Friday).
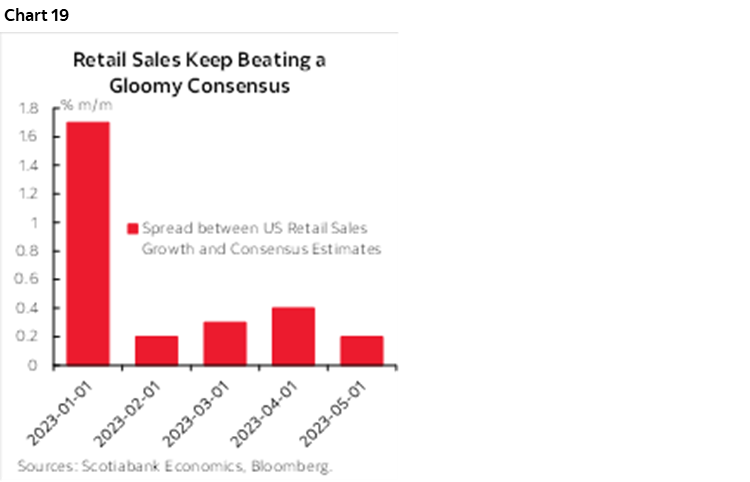
The US calendar will be dominated by earnings releases, with a second order focus upon retail sales during June (Tuesday). A 4.2% m/m SA rise in vehicle sales during June should contribute around a half percentage point to retail sales growth on its own, while price effects are expected to be minor and the key will be sales ex-autos and gasoline that have been beating consensus estimates every month this year (chart 19).
US industrial figures will include June’s industrial production (Tuesday) and the Empire (Monday) and Philly (Thursday) regional manufacturing surveys that help to inform expectations for the next ISM-manufacturing print. Housing starts for June (Wednesday) and existing home sales (Thursday) are both expected to decline.
Watch three markets for other developments across the Asia-Pacific region. They will include:
- Australian job market readings for June (Wednesday night ET) that could face some downside risk after the strong 76k gain in May and the general trend to date. Minutes to the RBA’s decision on July 4th (Monday) could further inform market pricing for a modest chance at another rate hike on August 1st.
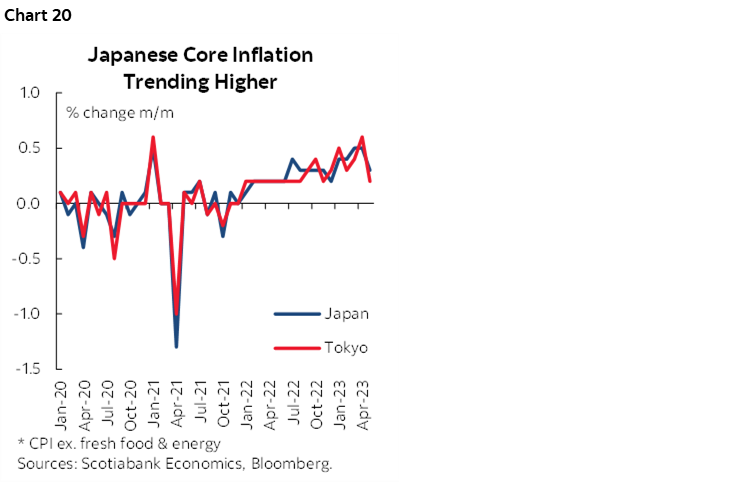
- Japanese CPI inflation (Thursday night ET) that will probably follow the Tokyo reading for CPI ex-food and energy that ebbed a touch. The volatile pattern of month-over-month seasonally adjusted and annualized readings has been on a general upswing since early 2022 (chart 20).
- New Zealand updates Q2 CPI inflation on Tuesday. The RBNZ has shifted to the sidelines as the economy slipped into technical recession over 2023H1 and as it follows lagging effects of policy changes on inflation. Markets are pricing low odds of further rate changes this year and CPI may not change that given the central bank’s guidance. Regardless, a gain of around 1% q/q non-annualized is expected to keep the heat on in terms of the trend.

DISCLAIMER
This report has been prepared by Scotiabank Economics as a resource for the clients of Scotiabank. Opinions, estimates and projections contained herein are our own as of the date hereof and are subject to change without notice. The information and opinions contained herein have been compiled or arrived at from sources believed reliable but no representation or warranty, express or implied, is made as to their accuracy or completeness. Neither Scotiabank nor any of its officers, directors, partners, employees or affiliates accepts any liability whatsoever for any direct or consequential loss arising from any use of this report or its contents.
These reports are provided to you for informational purposes only. This report is not, and is not constructed as, an offer to sell or solicitation of any offer to buy any financial instrument, nor shall this report be construed as an opinion as to whether you should enter into any swap or trading strategy involving a swap or any other transaction. The information contained in this report is not intended to be, and does not constitute, a recommendation of a swap or trading strategy involving a swap within the meaning of U.S. Commodity Futures Trading Commission Regulation 23.434 and Appendix A thereto. This material is not intended to be individually tailored to your needs or characteristics and should not be viewed as a “call to action” or suggestion that you enter into a swap or trading strategy involving a swap or any other transaction. Scotiabank may engage in transactions in a manner inconsistent with the views discussed this report and may have positions, or be in the process of acquiring or disposing of positions, referred to in this report.
Scotiabank, its affiliates and any of their respective officers, directors and employees may from time to time take positions in currencies, act as managers, co-managers or underwriters of a public offering or act as principals or agents, deal in, own or act as market makers or advisors, brokers or commercial and/or investment bankers in relation to securities or related derivatives. As a result of these actions, Scotiabank may receive remuneration. All Scotiabank products and services are subject to the terms of applicable agreements and local regulations. Officers, directors and employees of Scotiabank and its affiliates may serve as directors of corporations.
Any securities discussed in this report may not be suitable for all investors. Scotiabank recommends that investors independently evaluate any issuer and security discussed in this report, and consult with any advisors they deem necessary prior to making any investment.
This report and all information, opinions and conclusions contained in it are protected by copyright. This information may not be reproduced without the prior express written consent of Scotiabank.
™ Trademark of The Bank of Nova Scotia. Used under license, where applicable.
Scotiabank, together with “Global Banking and Markets”, is a marketing name for the global corporate and investment banking and capital markets businesses of The Bank of Nova Scotia and certain of its affiliates in the countries where they operate, including; Scotiabank Europe plc; Scotiabank (Ireland) Designated Activity Company; Scotiabank Inverlat S.A., Institución de Banca Múltiple, Grupo Financiero Scotiabank Inverlat, Scotia Inverlat Casa de Bolsa, S.A. de C.V., Grupo Financiero Scotiabank Inverlat, Scotia Inverlat Derivados S.A. de C.V. – all members of the Scotiabank group and authorized users of the Scotiabank mark. The Bank of Nova Scotia is incorporated in Canada with limited liability and is authorised and regulated by the Office of the Superintendent of Financial Institutions Canada. The Bank of Nova Scotia is authorized by the UK Prudential Regulation Authority and is subject to regulation by the UK Financial Conduct Authority and limited regulation by the UK Prudential Regulation Authority. Details about the extent of The Bank of Nova Scotia's regulation by the UK Prudential Regulation Authority are available from us on request. Scotiabank Europe plc is authorized by the UK Prudential Regulation Authority and regulated by the UK Financial Conduct Authority and the UK Prudential Regulation Authority.
Scotiabank Inverlat, S.A., Scotia Inverlat Casa de Bolsa, S.A. de C.V, Grupo Financiero Scotiabank Inverlat, and Scotia Inverlat Derivados, S.A. de C.V., are each authorized and regulated by the Mexican financial authorities.
Not all products and services are offered in all jurisdictions. Services described are available in jurisdictions where permitted by law.