

Next Week's Risk Dashboard
- CUSMA — A bad deal or making the best of a bad lot?
- A CUSMA deal might lift 2027 growth, reinforce other supports
- The CUSMA dilemma: macro versus micro
- Canadian markets, exports, jobs and FDI have been remarkably resilient
- Tentative calculations for effective tariff rates on Canadian exports
- Can Canadian bank earnings extend an incredible run?
- Canadian GDP — Resilient rebound?
- Canadian consumers are doing fine into Q3
- Canada’s output gap could shut as soon as year-end
- Jackson Hole — Not your typical mountain retreat
- Other central bank heads may speak at Jackson Hole
- Bessent to announce sanctions on Monday
- Nonfarm payroll annual revisions could be positive this time
- Bank of Korea expected to hike
- Bank of Thailand likely to extend its hold
- Philippines central bank might hike
- US core PCE inflation might bring back the hawks
- US GDP revisions expected to reinforce slowing growth
- RBA minutes to be stale on arrival
- Inflation updates from the Eurozone, Australia, Japan
Chart of the Week
As this publication goes to print, we await the possible release of the text behind an expected trade and security agreement between Canada and the US. It’s unclear if the text itself will be fully divulged over the weekend or more tightly circulated which could leave us in a continued position of piecing together leaks and trial balloons from anonymous officials. Details are sparse and we will have to fully examine them in order to make fuller assessments. What Canada gets in return for lifting retaliation against US alcohol is rather unclear.
Much of the week’s focus will be upon Canada with bank earnings and GDP also on the docket.
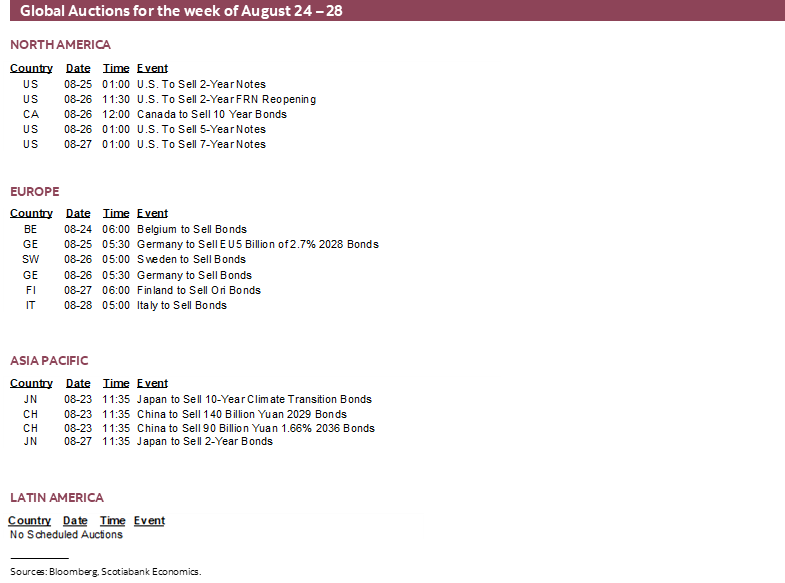
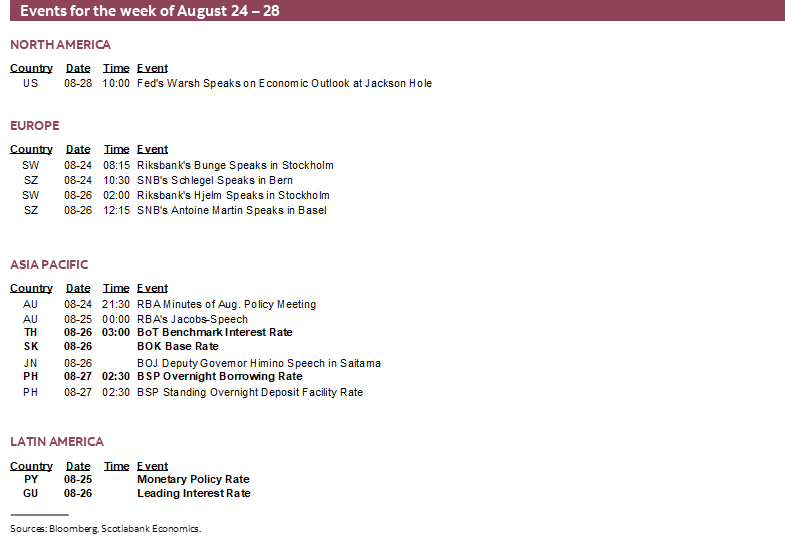
Global markets will be more focused upon the Fed’s Jackson Hole Symposium and the simultaneous release of Chair Warsh’s speech and annual nonfarm payroll revisions. US sanctions indirectly aimed at Iran through various real or perceived enablers will be announced on Monday. Three Asian regional central banks will weigh in and there will be an active line-up of global releases.
CANADA-US TRADE—A BAD DEAL OR MAKING THE BEST OF A BAD LOT?
We have some information to go by from media reports that quote anonymous sources. Charts 1 and 2 are tentative attempts at translating this information into revised estimates of the average effective tariff rate on Canadian exports to the US and on overall Canadian exports. I explained this here. The rate would drop from about 5.5% on exports to the US to 3.7% while the rate on total exports from Canada to everywhere in the world would decline from 4.2% to 2.8%.
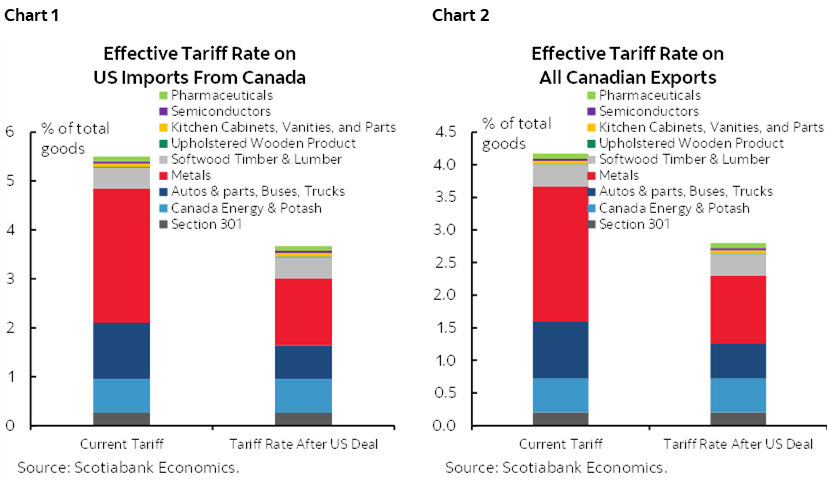
Herein lies the dilemma. The macroeconomic impact of such low tariff rates—albeit higher than the 1% rate that existed before this nonsense started—is quite low and manageable. I’ll come back to the macro context.
The impact upon individual sectors, however, could be profound.
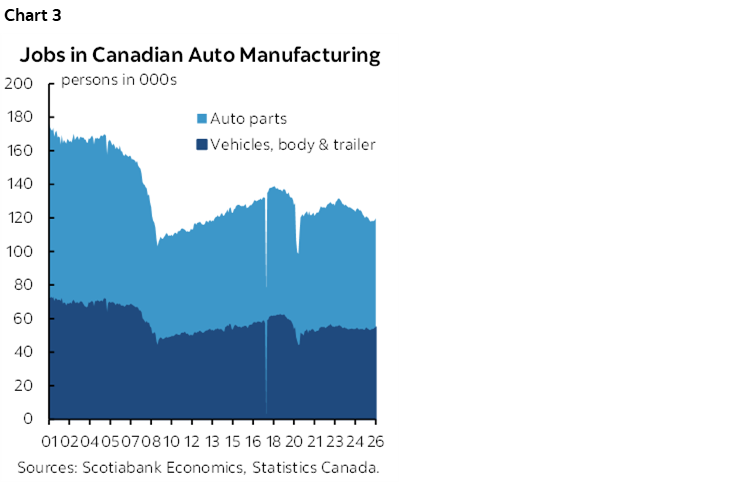
For instance, autos and parts only represent about 0.75% of Canadian GDP and ½% of jobs (chart 3), but the tariffs that are being proposed would be damaging to the sector and related industries. We think the tariff will drop from a sticker rate of 25% to 15% and that only the US content in finished automobiles will be exempted but the CUSMA-compliant content in parts that come from Canada, Mexico and the US will be exempt. The result lowers the auto sector’s contribution to the overall effective tariff rate compared to previously, but it still dominates as the single biggest share of the overall rate.
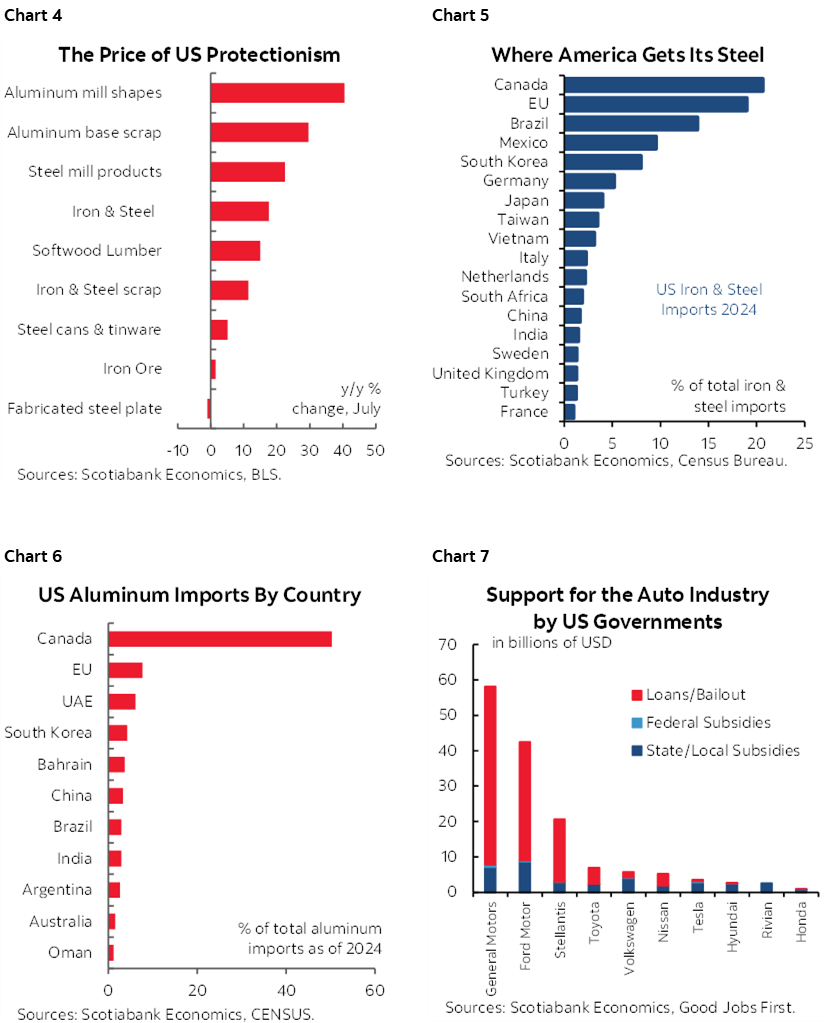
The impact upon steel may require a very rapid pivot toward feeding domestic infrastructure and defence needs. That’s because the US reportedly seeks a 25% tariff rate up to 4 million tonnes per year of steel imported from Canada and 50% above this level. In 2024, Canada exported 6.1 million metric tonnes of steel mill product to the US and so if this were to persist then Canada would pay 25% on the first 4 million and 50% on the next two million. Canada accounted for about one-quarter of all US imported steel in 2024 and just over one-half of aluminum imported into the US.
There is no word of progress on lumber. There is little information on dairy that is available within the existing and complex quota and tariff system (see here for a partial explanation) but it sounds like US dairy producers will be able to sell directly to Canadian retailers with much more detail required.
These sectors have small weights in the Canadian economy. Multiplier effects reach further vertically and horizontally across supply chains.
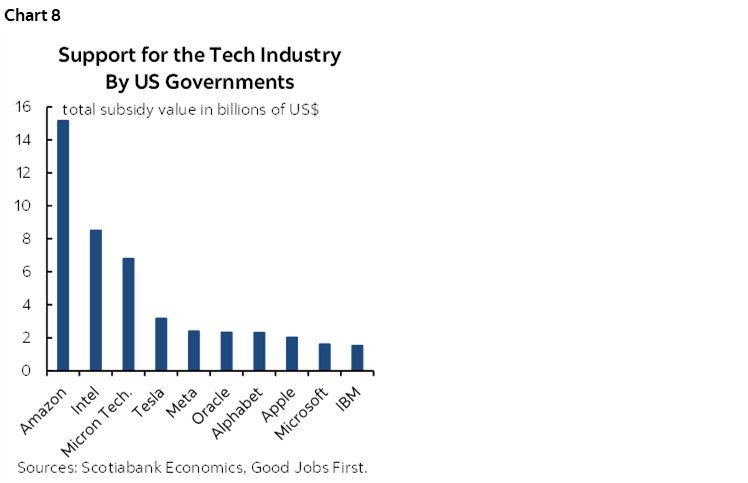
The impact is to lessen competition in the US behind a tariff wall. This benefits profits at the protected firms that are able to dramatically raise prices. Chart 4 shows prices for various steel, aluminum and lumber products in the US producer prices index. These higher prices are paid by everyone else. It will get worse as large shares of US imports are thwarted (charts 5, 6) while subsidies abound (charts 7, 8).
This would have never surprised Adam Smith. As narrow commercial interests capture US industrial policy, they are benefiting themselves at the expense of consumers and other businesses in the US and abroad. Everything that I said would happen under President Trump before the US election has come to fruition in bond markets, immigration policy, trade policy, geopolitical risk, fiscal deficits and threats to federal agencies and the Federal Reserve.
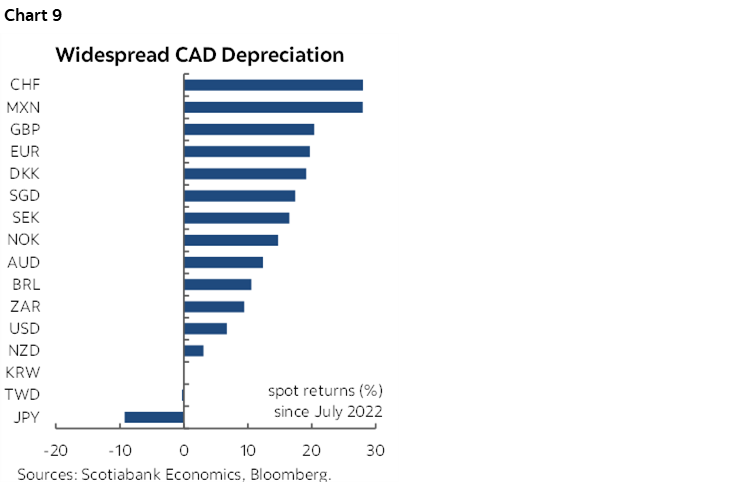
Coming back to a broader macro picture is more encouraging. The overall weighted tariff burden is likely to move lower and remain small. It will be lower than charged by the US against any other major trading partner to the US. Canada will pick up trade diversion flows away from other markets. Many Canadian exports are priced in USD and therefore do not get a direct insulating benefit from CAD depreciation, but many other currencies have appreciated to CAD since it began weakening around mid-2022 and this does present opportunity for greater price competitiveness against those markets (chart 9).
As trade uncertainty probably ebbs and the overall tariff hit reduces, we would likely raise our growth forecasts into 2027. Implications for slack in the economy and the Bank of Canada are discussed later in this weekly.
The real issue will be selling any pact to Canadians which may be an uphill battle. There is anger in Canada toward this US administration that is broadly reflected in polls and a petition to boot the US Ambassador. Some will continue to believe that Canada should fight. Some will feel that the country is being humiliated by such an agreement after years of insults and attacks that will tarnish Canada-US relations for years. Some will argue that the US administration is on the ropes into midterms amid tumbling polls and that the time to fight is now.
Others will argue that irrationality dominates Washington these days and that escalating protectionism and retaliation would be deeply damaging so it’s better to take a hit in concentrated sectors while pivoting to other forms of support through infrastructure and defence while continuing to diversify away from the US.
Perhaps the ultimate question will be whether rationality will one day return to Washington. Biden had the chance to do so on trade and passed while axing Keystone-XL, so perhaps don’t hold your breath. The MAGA thesis falsely blames the rest of the world for large fiscal and current account deficits. One reason that’s false is that some of this is caused by attractive investment opportunities in the US that drive outflows of investment payments within the current account deficit. Another reason is that the US runs patently irresponsible fiscal policy with perennially high fiscal deficits around 6% of GDP as public debt eclipses an astounding US$40 trillion. The myth of unfair competition from Canada and other trading partners is countered by the fact the US tops international rankings for the prevalence of subsidies in agriculture, autos, tech industries, aerospace and the broad economy.
CANADIAN BANK EARNINGS—AN INCREDIBLE RUN
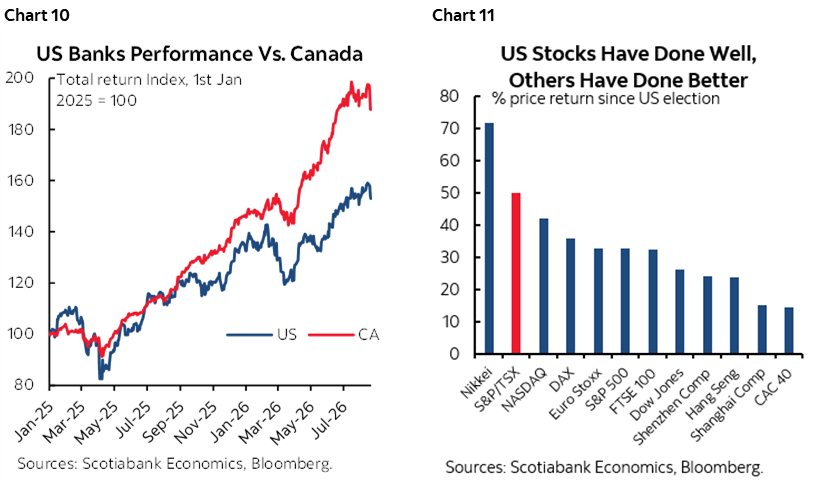
Canada’s Q3 bank earnings season kicks off on Tuesday and lasts all week. Bank shares have been doing very well coincidentally ever since ‘Liberation Day’ last April and have outperformed American banks since then and in fact since the US election (chart 10). I’ve delivered many presentations over time that have also noted the outperformance of Canada’s overall stock market since the US election as the US AI advantage has been restrained by the administration’s policies (chart 11), similarly tight Canadian corporate bond spreads as in the US, tighter provincial bond spreads in Canada, and a 110bps long-end yield advantage to the US that reflects less debt supply pressure and inflation risk.
Real variables—like foreign direct investment—have also continued to grow strongly with US investment into Canadian structures and equipment rising rapidly since just before the pandemic but outpaced by FDI from the rest of the world as the US share falls. Export volumes are also surging and so is job growth that has outpaced the US since the election. Canada has been remarkably resilient since the US election.
Bank shares have been wavering more recently on both sides of the border, although this has been a little more pronounced in Canada. In fact, the broad TSX-banks subindex has gone flat to slightly lower since the end of June during which valuation multiples of the banks have been at record highs.
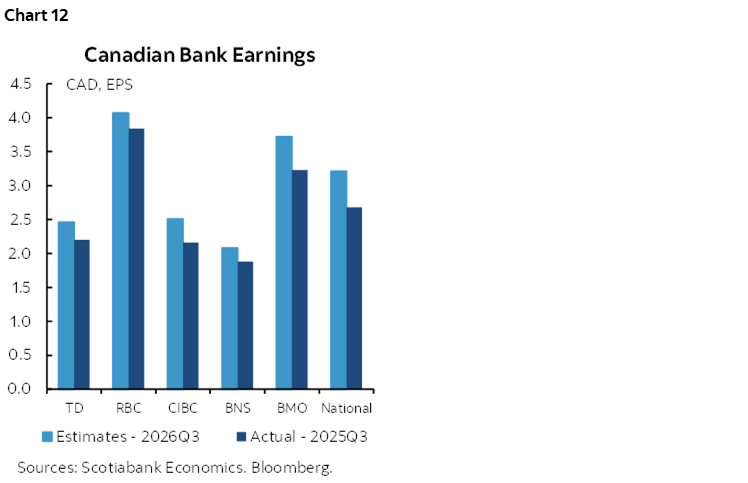
Could earnings restore the upside potential? We’ll find out starting on Tuesday when BNS (my employer) and BMO kick off the earnings parade. RBC, TD and CIBC follow on Thursday and then Laurentian wraps it up on Friday. Consensus expectations for earnings per share are shown in chart 12 compared to the same quarter last year given the numbers are not seasonally adjusted.
One issue to monitor is share buybacks as our bank analyst notes by reference TO excess capital of about $80 billion (~5% of market capitalization).
Another issue may be references to whether the nascent stage of an improving economy is helping. Jobs have been on a tear over the past several months and GDP is smartly rebounding. Lagging effects might add a dose of cautious optimism particularly if a trade deal with the US continues to gather momentum.
CANADA’S ECONOMY—RESILIENT REBOUND?
On Friday, we’ll find out how rapidly the Canadian economy is rebounding and gain some further clues about how sustainable the momentum may be.
Canada updates GDP figures for Q2 as well as the individual months of June and July on Friday. Q2 growth could land at 4% q/q SAAR. That’s using the traditional expenditure-based approach. The BoC had forecast 2.5% growth in its MPR on July 15th. Since then, we have received more data.
Using what we know from monthly GDP figures reveals tracking of 3.4% q/q SAAR growth in Q2. Monthly GDP is income-based. Expenditure-based GDP considers additional factors like inventory investment swings and more thoroughly incorporates the effects of trade figures.
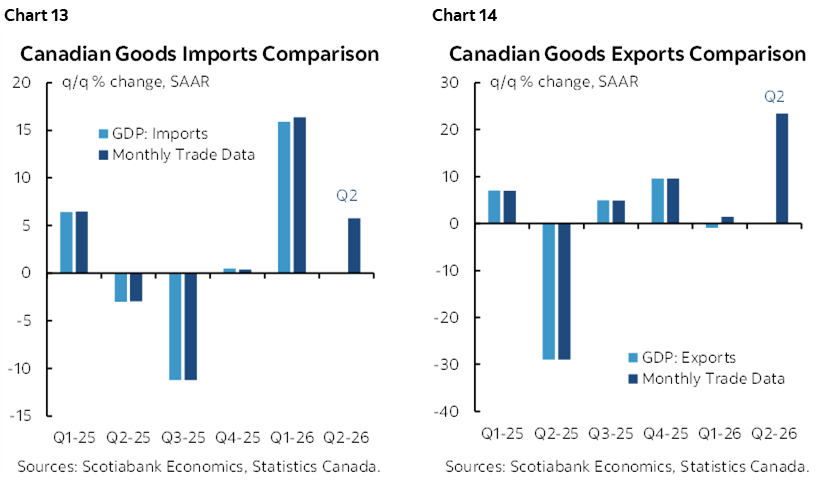
On that note, it may be tough to repeat the large 4% weighted addition to Q1 GDP growth from inventory investment. Higher import volumes suggest that there could be ongoing inventory additions even if at a slower pace (chart 13). Export volumes, however, have been on an absolute tear and this could make net export contributions to GDP growth offsetting to inventory swings (chart 14).
Either way, Q2 GDP growth should be a solid print that could be the strongest growth since at least 2025Q1 and perhaps since 2023Q1.
As for momentum, it’s too early to really tell, but what we do have suggests that the economy has a good, solid, running headstart. Monthly GDP figures up to June and our early estimate for July—when hours worked jumped higher by 0.6% m/m SA—imply baked-in Q3 GDP growth of 1.8% q/q SAAR.
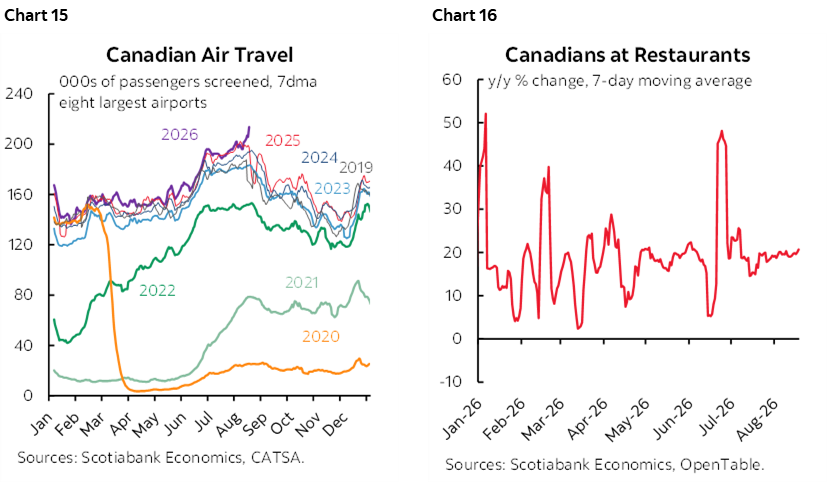
The consumer has some momentum into Q3 as well. Retail sales volume growth has slowed from 6 ½% q/q SAAR in Q1 to 1.8% in Q2 and with <1% baked into Q3 with two cautions on the latter point. One is that July’s advance sales guidance from Statcan for a -0.8% m/m SA drop in the value of sales was partly a reversal of the explosive surge in e-commerce sales in June related to Prime Day. Two is that other readings of consumer spending not capture by retail sales—like all services—are looking buoyant such as airfare (chart 15) and restaurants (chart 16).
Furthermore, I suspect that when we revise our broad macro forecasts in early September we will lift the quarterly profile for Canadian economic growth in 2027 if a trade and security deal is indeed struck with the US.
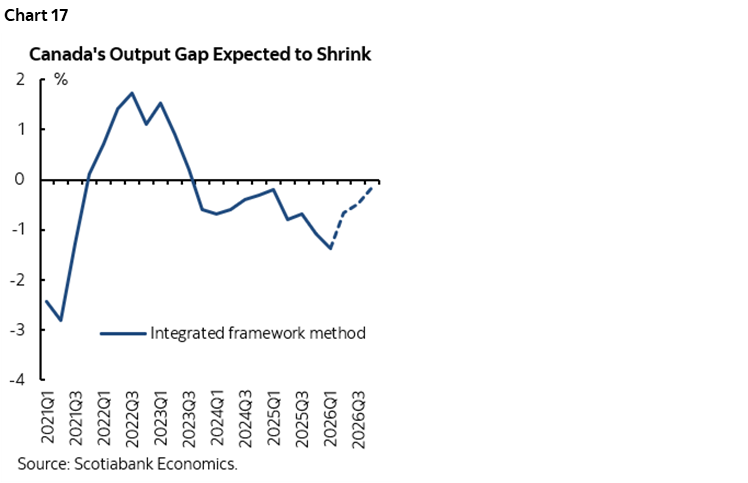
The implications for the BoC could be significant. From a range of -1.4% to -2.2% back in 2026Q1, I'm getting the output gap landing at between 0% and 1% by the end of this year. The range reflects which of the BoC's two measurement concepts of the gap that we use. Hence, by year-end, slack in Canada’s economy may be shut or reduced with an average of small ½% output gap (chart 17). Improved growth in 2027 could either completely close slack or push the economy into excess aggregate demand.
The Bank of Canada would not be advised to wait until that happens before acting to move off the bottom end of the neutral rate range.
JACKSON HOLE—NOT YOUR TYPICAL MOUNTAIN RETREAT
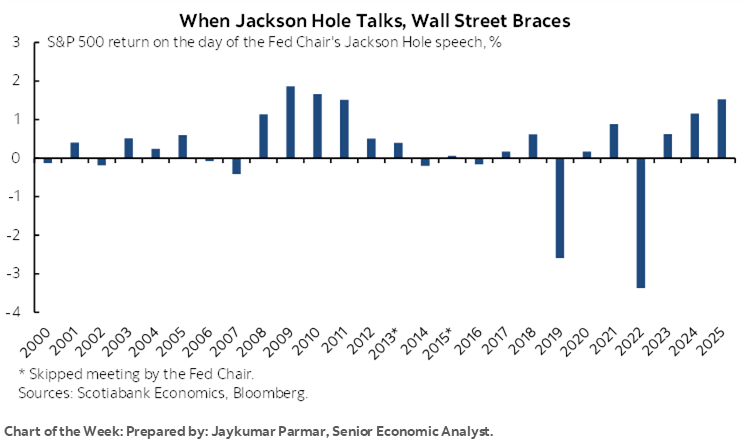
Friday morning, 10amET. Be there, virtually at least, other than the privileged few who attend in person. That’s when Chair Warsh will deliver his customary speech.
What will he say? That’s more up in the air than usual this time. That’s because when asked during his press conference on July 29th what he might do with this year’s address, he said:
“I look at it as a blank sheet of paper. Historically it would be sort of a setting up speech of what was going to be happening in the Fall. I haven't made any judgements on that. I'd also like to frame the big questions. What's happened with productivity? Demographics? Shocks? I haven't decided is it a big picture speech of a set up of all the action we'll have between September and December.”
Warsh also indicated that he may or may not have early thoughts on progress by the task forces.
If Warsh does go the route of teeing up future possible moves, then a) it would conflict with his stance against providing explicit forward guidance, but b) would probably lean more toward the neutral-dovish side of expectations.
Why? The Committee’s Summary of Economic Projections in mid-June anticipated that the fed funds rate would remain unchanged at 3.75% through to year-end before cutting once next year. This year’s dot plot was split 50–50 between no action with one putting down a cut, and one hike.
Since June, US data has deteriorated somewhat in terms of the dual mandate. Core inflation has ebbed and nonfarm payrolls have been disappointing with very little net gain of just 60k over the past three months. Financial market conditions have been volatile, but the surge in the 10-year Treasury yield to 4.7% has backed into higher mortgage rates. Recent evidence for a data-wedded Committee wouldn’t really support sounding incrementally hawkish.
It may also be too soon to begin sharing the work of the five Task Forces that Warsh set up to report back into the Fall and by year-end.
This year’s theme is “Financial Innovation: Implications for Payments and Policy.” Content that aligns with the theme may be more informative to those whose interests are closely aligned with changes in the financial system. Watch for the agenda to be released on Thursday night ahead of the retreat that lasts into Saturday.
Also watch for possible remarks from the sidelines or formal appearances on the agenda itself by other global central bank officials. There may be more information on attendees available through the media in the run-up to the event. We do not as yet have such indications. ECB President Lagarde may be likely since it could be her last given a pledge to stay on until at least year-end and the possibility she may step down before her term is up in October 2027 given the French election will be held in Spring and a desire to have a successor chosen before then.
SANCTIONS—BESSENT PLAYS DUBYA
“You are either with us or against us.”
Treasury Secretary Bessent dredged up those words from twenty-five years ago when he set Monday as the delayed date for announcing what sanctions may be applied against countries (namely China), organizations, banks, insurers, shipping companies, commodity traders, exchange houses and other companies thought to be directly or indirectly aiding Iran whether explicitly or passively so.
Sound familiar? Those were George W. Bush’s words when rallying support after 9/11. It wasn’t hard to do back then, given the horrifying, heinous and cowardly attack on the US that day that rallied every compassionate soul regardless of borders. Every sensible ally—including Canada—leapt to the defence of America and offered assistance in a variety of ways. That included fighting side-by-side with coalition partners that the White House acknowledged at the time but that the Trump administration has more recently downplayed. It included smaller, heartfelt gestures, such as ‘Operation Yellow Ribbon’ when Canada handled flights diverted from US airspace on that horrible day and Canadians opened their homes to provide shelter to stranded passengers. Canadians stood by their American friends.
Securing such coordination has been more challenging this time in a vastly different context.
As for what Bessent has in mind, I won’t repeat it here, but please see last week’s weekly on page 4 which included speculation about the possible measures and on how they may be ill-advised by courting unintended, destabilizing consequences.
Does Treasury know this? Probably. Then again, Bessent knows that the US has a deep-rooted fiscal challenge with persistently higher deficits (6% of GDP), yet under his watch has not provided a convincing plan to get to a three-handled deficit-to-GDP ratio that he promised late last year to deliver before the end of Trump’s term. Treasury should know that measures to engage in FX intervention like the euro-yen play and long-end Treasury buybacks at best offer fleeting effects. Cognitive dissonance is in plentiful supply these days.
NONFARM BENCHMARKING—A-W-K-W-A-R-D!
By ‘awkward’ I’m speaking in reference to the fact that the annual preliminary nonfarm payrolls benchmarking revisions will be released on Friday at 10amET—the exact same time as Chair Warsh’s speech.
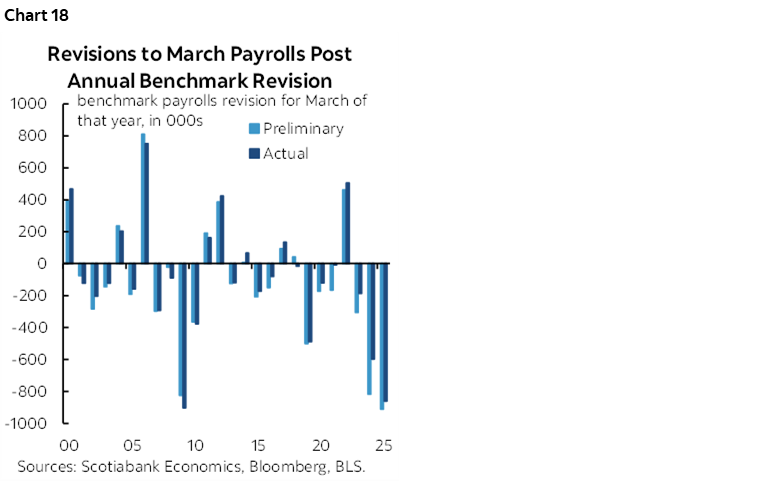
Recall that these are the annual revisions that affect the estimated level of payrolls as at March of this year and over the year stretching back to April 2025. They can cause a bang, such as each of the two prior years when they sharply marked down estimated job gains (chart 18). Last September’s revisions took out 911,000 jobs as at March 2025 for an average of -76k/month which then got revised to a slightly less bad -862k downward revision in the final estimates this past February.
Will this year’s revisions be as big a deal? Based on what we can track so far it doesn’t look like it; in fact, the revisions could actually add to payrolls this time. The best guesstimate is an addition of 250–350k to March 2026 payrolls, or about +20–30k per month on average over the year to that point. If so, then it would not massively change the picture for the Federal Reserve. The average monthly payroll gain over this period was 23k and so raising this to the 40–50k range per month would still signal a moderate pace of job gains.
Whatever number is announced will be the preliminary figure to be finalized next February at which point it will be formally incorporated into a revised nonfarm payrolls series.
Besides, the Fed’s more dominant focus is inflation at the moment, while any concern about payrolls would be about the slow down over the most recent three months that have averaged about +20k/month.
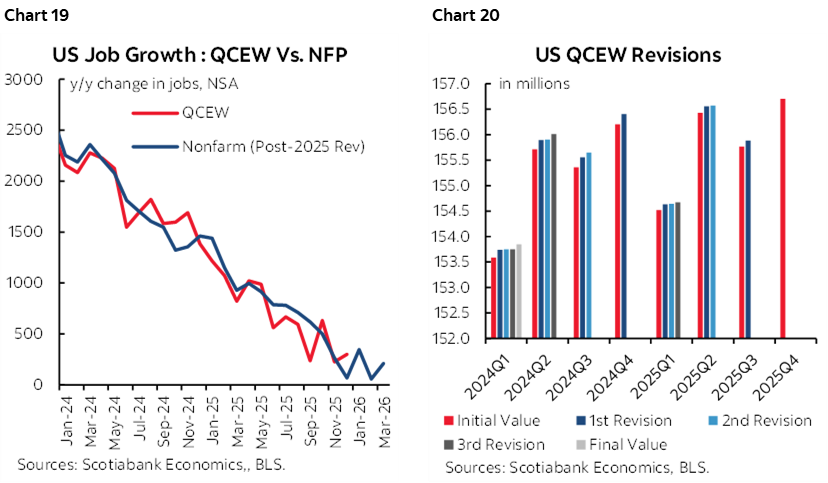
To arrive at this revision estimate, the BLS uses state level employment figures from the Quarterly Census of Employment and Wages (QCEW, here). While lagging and less timely, this data is believed to be a more accurate indication of hiring because it is a comprehensive dataset for the number of establishments and employment covered by State unemployment insurance laws and Federal workers covered by Federal unemployment programs.
Our tracking of the payroll counts from the QCEWS data is much closer to nonfarm payrolls so far than in prior years and with the aforementioned modest upside (chart 19). The rub lies in the fact that QCEWS data can be heavily revised each quarter that it comes out (chart 20) and we only have it from 2025Q2 to 2025Q4 which is missing 2026Q1 that gets released on Friday. Therefore our +300k positive revision is a guesstimate at this point.
CENTRAL BANKS—ONE OR TWO HIKES
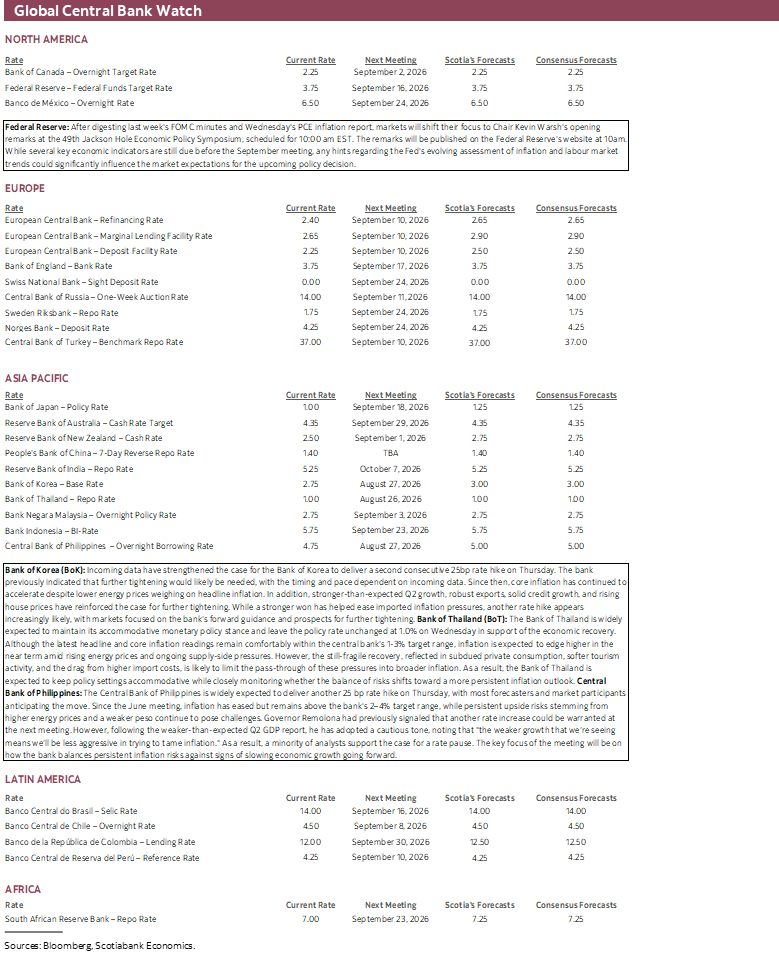
Three Asian central banks will weigh in with policy decision this week and two of them are likely to hike. RBA minutes (Monday) are likely to be stale in light of recent guidance and a weak jobs report.
Bank of Thailand—Continued Holding Pattern
Consensus widely expects the BoT to leave its repo rate unchanged at 1% on Wednesday where it has been since a rate cut in February. Inflation remains at the middle of the 1–3% target range with core CPI at the bottom of the range at 1.3% y/y. Growth recently disappointed with GDP contracting by -0.2% q/q SA in Q2. Accommodative policy is likely to persist.
Bank of Korea—Expected to Hike
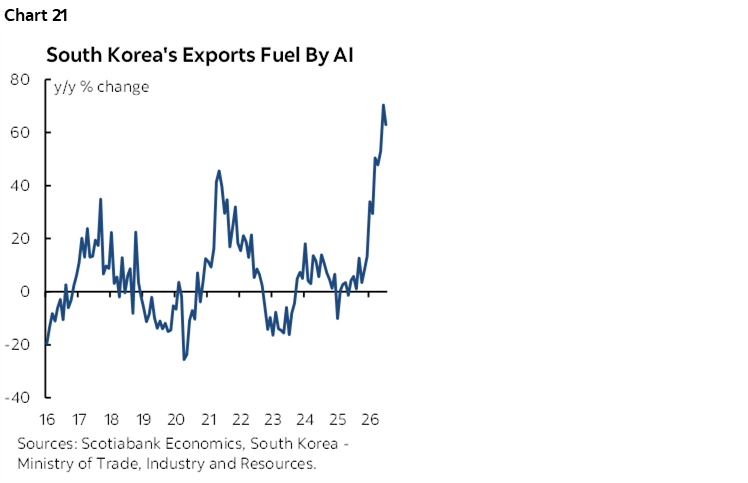
A 25bps rate hike to a new bank rate of 3% is widely expected to be delivered on Thursday. Core CPI inflation ex-food and energy continues to rise to 2.6% y/y in July. Seoul’s pace of house price gains may be topping but remains at over 9% y/y. South Korea has been plugged right into AI through exports (chart 21) while its stock market has been in turmoil.
BSP—Weaker Guidance
Most forecasters expect Bangko Sentral ng Pilipinas to hike by 25bps to a new overnight rate of 5% on Thursday. A small minority thinks it could hold. Governor Remolona had guided that the central bank could tighten again but data has been less cooperative since his initial remarks which led him to rein in such guidance.
GLOBAL MACRO—SIGHTS ON INFLATION
Most of the focus on the data release calendar will be upon inflation reports from the US, Eurozone, Japan and Australia alongside updates on US consumer spending. I’ve partnered with Jay Parmar for this section.
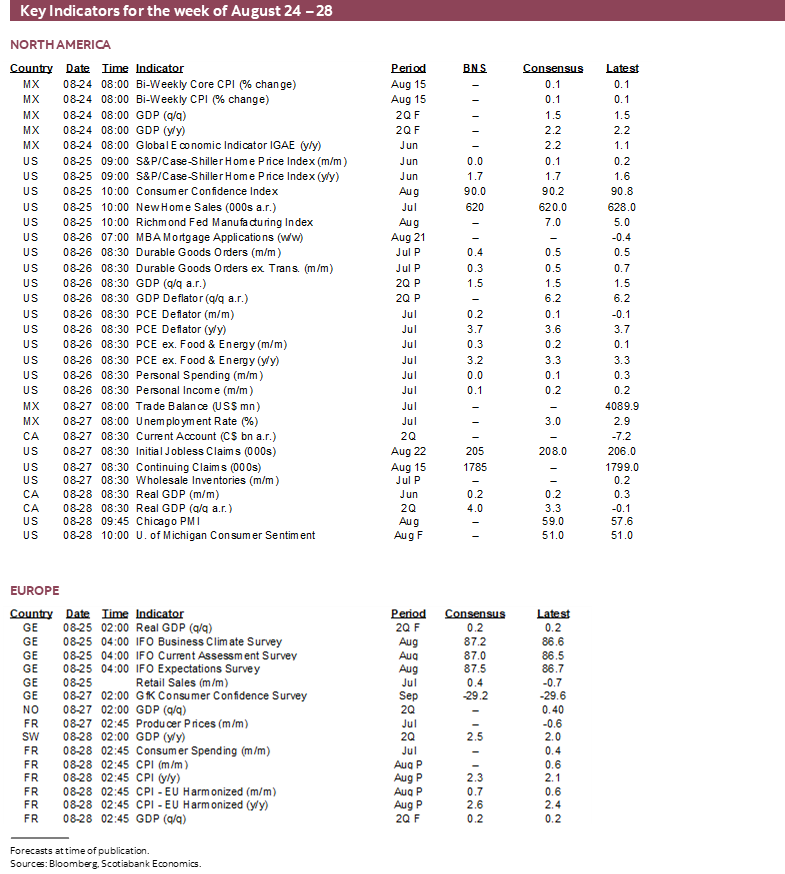
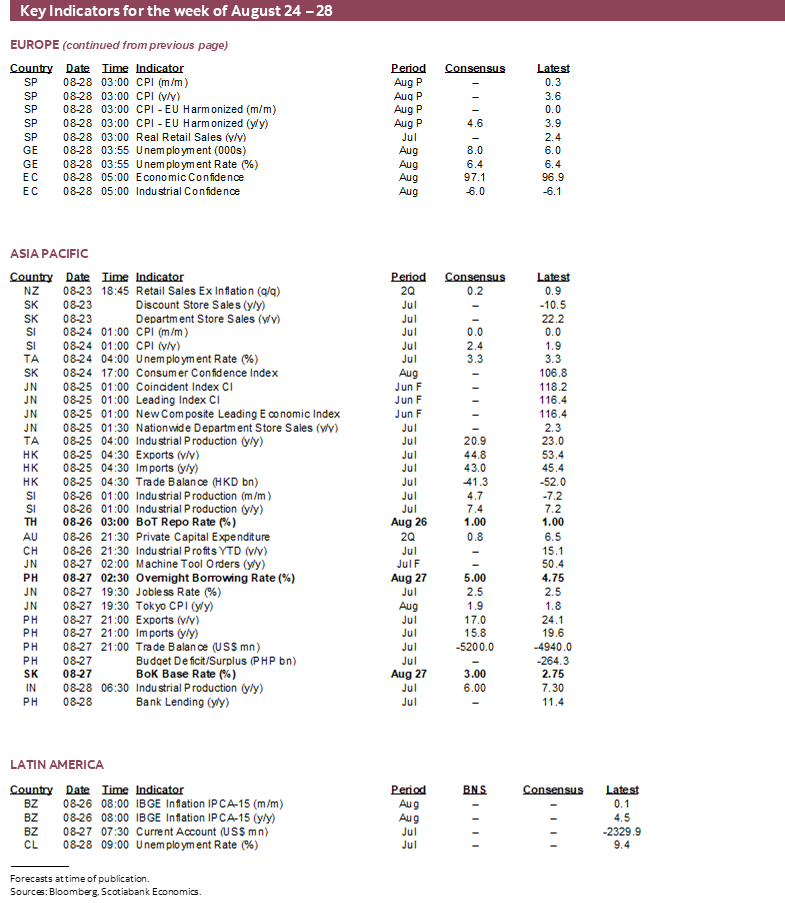
Several US macro indicators are on tap for the coming week and I’ve front-loaded the list below with what I think will be the most important ones.
- PCE Inflation (Wednesday): It used to be the Federal Reserve’s preferred measure of inflation but now we’re not sure given Chair Warsh’s taskforce assigned to explore the matter. I’ve estimated an above consensus 0.2% m/m SA rise in total PCE inflation (consensus 0.1%) and 0.3% m/m SA for core PCE (0.2% consensus). At an annualized rate, this could propel underlying inflation back onto the hawks’ radar even though I think they’re too backward focused. Ingredients to the call include core CPI’s 0.2% rise, the components in producer prices that flow into PCE, weighting differences between CPI and PCE, and compensating for methodological differences between CPI and PCE.
- Consumer spending and incomes (Wednesday): Consumer spending probably stalled out in July. Nominal spending was probably flat over June such that inflation-adjusted spending probably fell. Part of the issue is weak incomes; July may post only a slight gain in total nominal personal income and hence a flat to lower reading in inflation adjusted terms. The US household sector has not posted income growth for several quarters.
- Q2 GDP revisions (Wednesday): The second swing at Q2 US GDP isn’t expected to deliver material revisions to the original 1.5% q/q SAAR reading. Data since the original print on July 30th hasn’t much budged the needle. That’s not the same as saying no chance at revision since historically it’s not at all uncommon. Available evidence to date points to a sharply slowing US economy after it grew by 3.8% and 4.4% in Q2/Q3 last year and then only 0.5% in Q4, 2.1% in Q1 and 1.5% last quarter.
- Consumer confidence (Tuesday): Confidence is expected to be stable in August’s reading, but with the caveat that it is trending around lows last seen in the pandemic year of 2020. This measure is more driven by the fragile labour market than the UofM sentiment measure that is more driven by financial conditions.
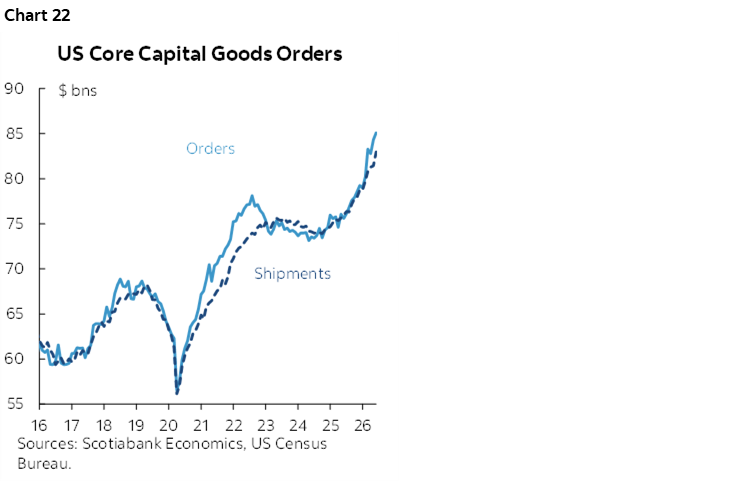
- Durable goods orders: Orders probably grew again in July based in part on Boeing plane orders. Key will be orders ex-defence and air as a measure of core business investment. This measure has soared over the past year with the AI and data centre craze playing a prominent role largely due to heavy subsidies (chart 22).
- Others: New home sales during July (Tuesday), advance goods trade and the trade balance during July (Thursday), and house prices in June and Q2 (Tuesday) round out the line-up.
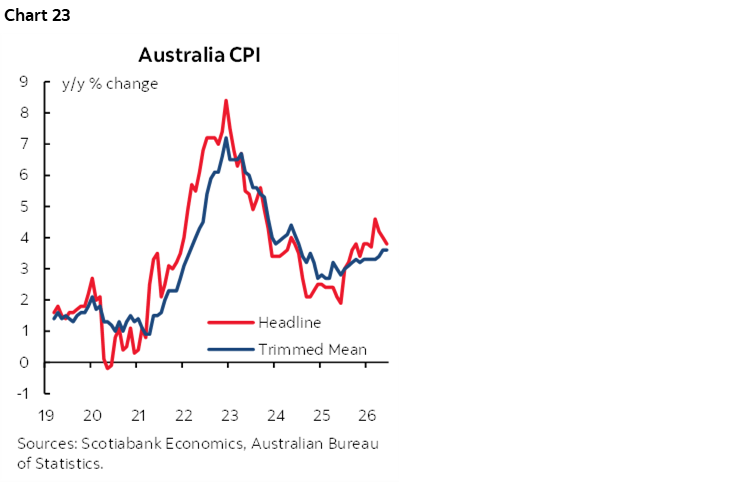
Australia will kick off the week with its July inflation update on Tuesday. The focus will be on the RBA's preferred trimmed mean measure (chart 23), which is expected to remain steady at 3.6% y/y. However, following last week's soft labour market report, and with another employment release due ahead of the September policy meeting, the bar for further policy tightening remains high, leaving the RBA firmly on hold for now.
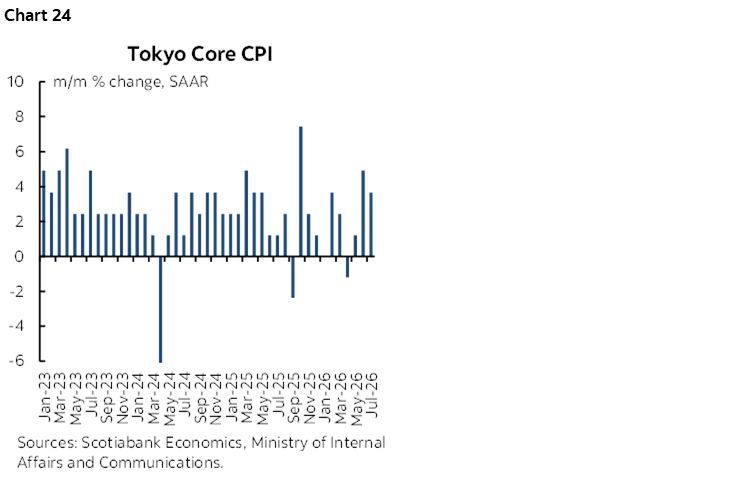
Next up, Tokyo's August CPI release on Thursday will provide an important update on inflationary pressures ahead of the BoJ's September 18th meeting, with markets already pricing in a 25bp hike. While headline inflation is expected to ease, the key focus will be the seasonally adjusted annualized month-over-month core measure (chart 24), which has recently pointed to a pickup in underlying inflation. Rising import and producer prices also suggest pipeline price pressures remain elevated.
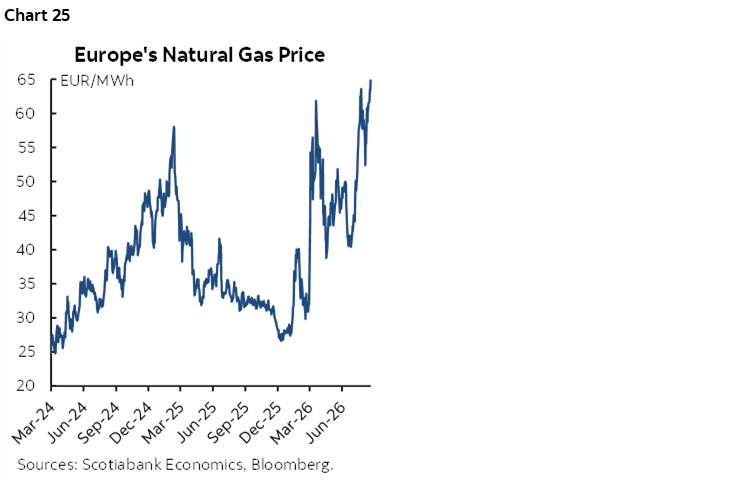
Meanwhile, August inflation readings from France and Spain on Friday will provide an early indication of eurozone inflation ahead of the region-wide release the following week. However, with higher global oil prices and European natural gas prices (chart 25) at their highest levels of the year, the ECB is likely to place greater emphasis on upside risks to the medium-term inflation outlook. Markets already have a 25bp rate hike priced in for September, with another expected by year-end.
Turning to growth, the Nordic economies will deliver their Q2 GDP updates, with Norway reporting on Thursday and Sweden on Friday. While Norway is expected to benefit from favourable terms-of-trade dynamics, Sweden's data will provide an important update for the Riksbank on the pace of recovery following the Q1 contraction.
DISCLAIMER
This report has been prepared by Scotiabank Economics as a resource for the clients of Scotiabank. Opinions, estimates and projections contained herein are our own as of the date hereof and are subject to change without notice. The information and opinions contained herein have been compiled or arrived at from sources believed reliable but no representation or warranty, express or implied, is made as to their accuracy or completeness. Neither Scotiabank nor any of its officers, directors, partners, employees or affiliates accepts any liability whatsoever for any direct or consequential loss arising from any use of this report or its contents.
These reports are provided to you for informational purposes only. This report is not, and is not constructed as, an offer to sell or solicitation of any offer to buy any financial instrument, nor shall this report be construed as an opinion as to whether you should enter into any swap or trading strategy involving a swap or any other transaction. The information contained in this report is not intended to be, and does not constitute, a recommendation of a swap or trading strategy involving a swap within the meaning of U.S. Commodity Futures Trading Commission Regulation 23.434 and Appendix A thereto. This material is not intended to be individually tailored to your needs or characteristics and should not be viewed as a “call to action” or suggestion that you enter into a swap or trading strategy involving a swap or any other transaction. Scotiabank may engage in transactions in a manner inconsistent with the views discussed this report and may have positions, or be in the process of acquiring or disposing of positions, referred to in this report.
Scotiabank, its affiliates and any of their respective officers, directors and employees may from time to time take positions in currencies, act as managers, co-managers or underwriters of a public offering or act as principals or agents, deal in, own or act as market makers or advisors, brokers or commercial and/or investment bankers in relation to securities or related derivatives. As a result of these actions, Scotiabank may receive remuneration. All Scotiabank products and services are subject to the terms of applicable agreements and local regulations. Officers, directors and employees of Scotiabank and its affiliates may serve as directors of corporations.
Any securities discussed in this report may not be suitable for all investors. Scotiabank recommends that investors independently evaluate any issuer and security discussed in this report, and consult with any advisors they deem necessary prior to making any investment.
This report and all information, opinions and conclusions contained in it are protected by copyright. This information may not be reproduced without the prior express written consent of Scotiabank.
™ Trademark of The Bank of Nova Scotia. Used under license, where applicable.
Scotiabank, together with “Global Banking and Markets”, is a marketing name for the global corporate and investment banking and capital markets businesses of The Bank of Nova Scotia and certain of its affiliates in the countries where they operate, including; Scotiabank Europe plc; Scotiabank (Ireland) Designated Activity Company; Scotiabank Inverlat S.A., Institución de Banca Múltiple, Grupo Financiero Scotiabank Inverlat, Scotia Inverlat Casa de Bolsa, S.A. de C.V., Grupo Financiero Scotiabank Inverlat, Scotia Inverlat Derivados S.A. de C.V. – all members of the Scotiabank group and authorized users of the Scotiabank mark. The Bank of Nova Scotia is incorporated in Canada with limited liability and is authorised and regulated by the Office of the Superintendent of Financial Institutions Canada. The Bank of Nova Scotia is authorized by the UK Prudential Regulation Authority and is subject to regulation by the UK Financial Conduct Authority and limited regulation by the UK Prudential Regulation Authority. Details about the extent of The Bank of Nova Scotia's regulation by the UK Prudential Regulation Authority are available from us on request. Scotiabank Europe plc is authorized by the UK Prudential Regulation Authority and regulated by the UK Financial Conduct Authority and the UK Prudential Regulation Authority.
Scotiabank Inverlat, S.A., Scotia Inverlat Casa de Bolsa, S.A. de C.V, Grupo Financiero Scotiabank Inverlat, and Scotia Inverlat Derivados, S.A. de C.V., are each authorized and regulated by the Mexican financial authorities.
Not all products and services are offered in all jurisdictions. Services described are available in jurisdictions where permitted by law.