

Next Week's Risk Dashboard
- Immaculate Canadian disinflation? Don’t bet on it…
- …with three reasons why the BoC should fade jobs, focus on inflation
- US Q3 earnings season commences…
- …and a bond-equity allocation pivot?
- US CPI — Backward Doesn’t Matter, But Tell Me Anyway??
- Warsh, Macklem and Bailey to speak…
- …at the IMF/IIF Annual Meetings in Bangkok…
- …with most of the focus on the latter two central bankers
- Global macro — US retail, UK readings, Aussie jobs
- … Latam GDP proxies, China/India CPI
- Canadian Thanksgiving — local markets shut Monday
Chart of the Week
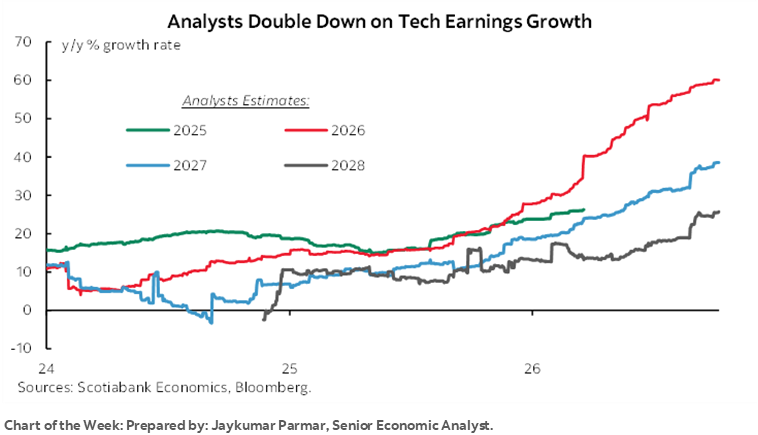
Much of the coming week’s focus across global markets will be upon the intersection between US inflationary pressures and company earnings reports and how the two impact overall risk appetite. Toss in what could be important guidance from the Fed, BoC and BoE at the annual IMF/IIF meetings in Bangkok and we have a recipe for a potential step forward in our understanding of nearer-term asset allocation choices. Multiple valuation approaches suggest that equities are dear relative to cheap bonds in a multi-decade divide between the two. I’m not sure that any of the rumoured candidates for Monday’s Nobel Prize in Economics would be able to shed useful light on these topics but that may not stop the media from asking—and the winner from trying.
EARNINGS SEASON AND ASSET ALLOCATION
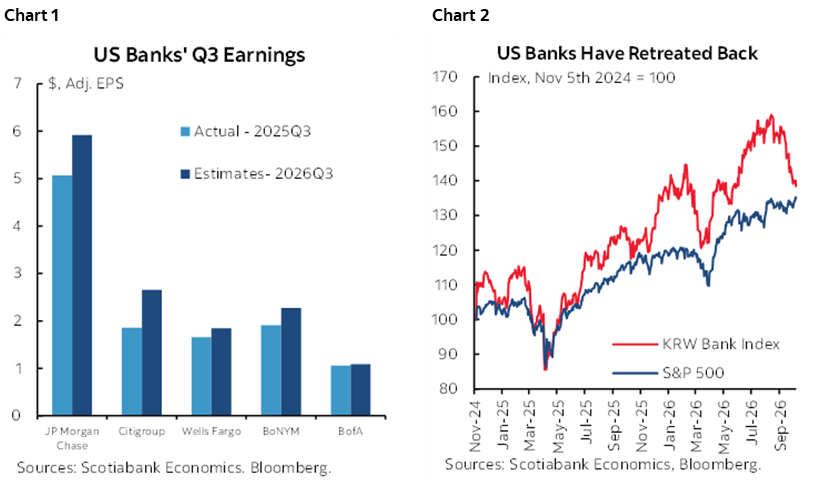
The US Q3 earnings season begins in earnest on Tuesday with banks leading the parade. Twenty-seven firms release including names like Goldman Sachs, JP Morgan, Wells Fargo and Citigroup (Tuesday), Blackrock, BofA and Morgan Stanley (Wednesday).
Analysts’ expectations are shown in chart 1 compared to the same calendar quarter a year ago since earnings are not seasonally adjusted. Bank shares have pivoted more cautiously ahead of the season (chart 2).
Earnings are one part of the equation. Multiples are the other. That begs the question about relative bond versus equity valuations.
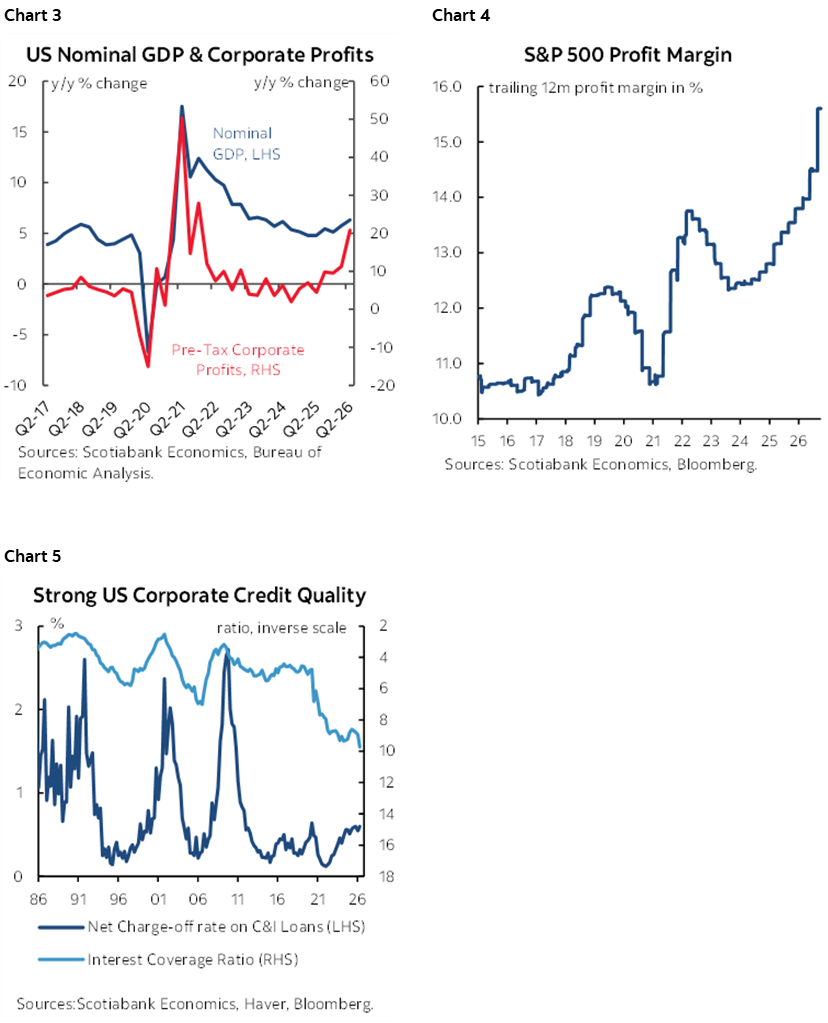
There is no doubt that corporate balance sheets and earnings are solid. US corporate profits are outpacing the milder pick-up in nominal GDP partly as a positive technology shock works through (chart 3). Profit margins continue to rise (chart 4). Corporate interest coverage is at a record high and helps to understand well-behaved charge-off rates on C&I loans (chart 5). Proxies for corporate bond spreads over US Treasury yields remain on the tight side. High long-bond yields deflate future health and pension liabilities in present value terms, but the effects vary tremendously across types of industries, firms and workforces. In short, the fundamentals look rock solid.
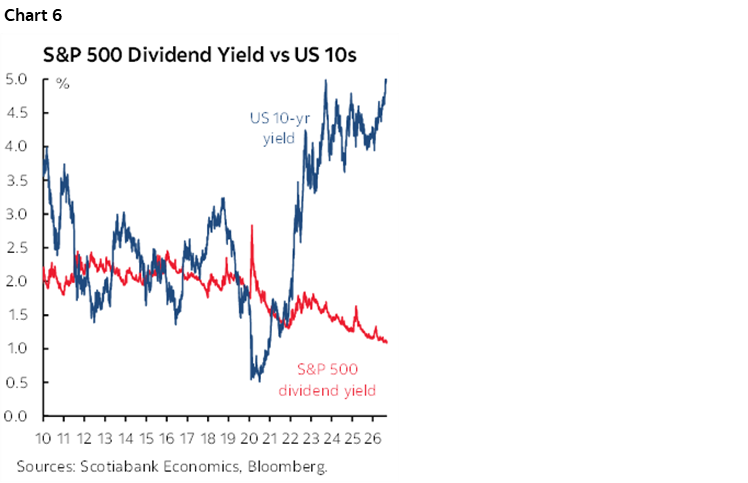
And generously priced by equities relative to bonds. Whether equities are too dear in the midst of a massive technology shock or if bonds are too cheap with inflation and issuance concerns is subject to widely varying opinions in markets, but relative to one another presents a case for a more careful relative asset allocation shift in my opinion.
The Benjamin Graham approach that some once called the Fed model and that compares the 10-year Treasury yield to the dividend yield on the S&P reflects the widest spread in decades (chart 6).
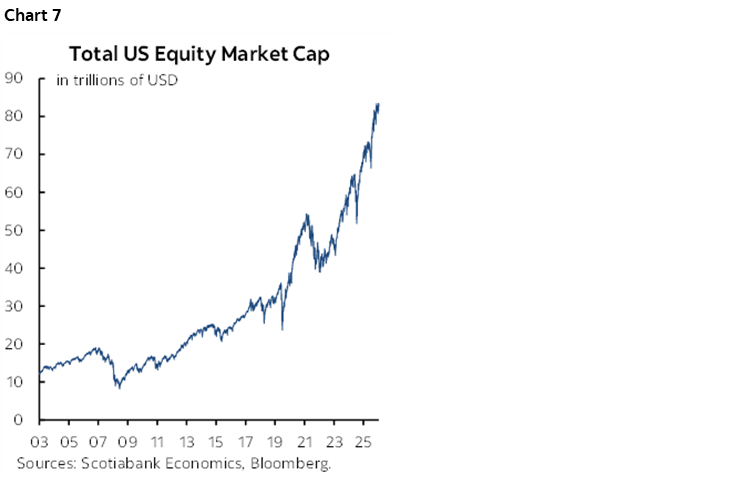
US equity market capitalization has risen by about 140%, or by nearly US$50 trillion to $83T since just before the pandemic began (chart 7).
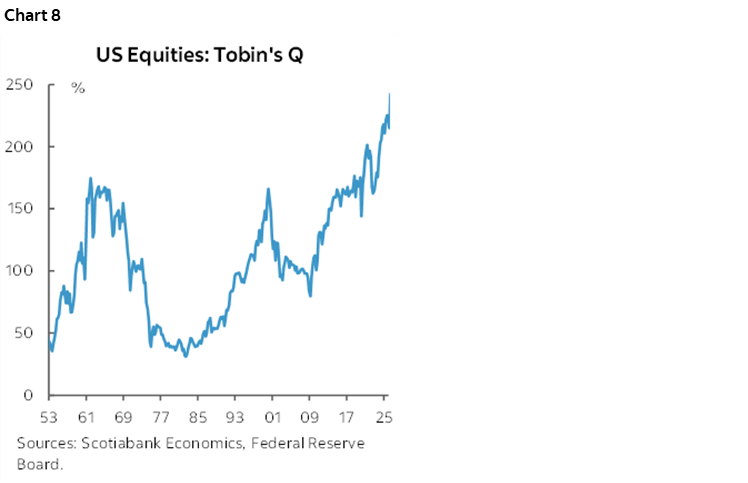
Tobin’s Q—or price to the replacement cost of assets—is at a post-war record high (chart 8). On its own, this may not be surprising in the context of a rapidly evolving technology shock that is rapidly replacing assets at higher valuations, but you certainly can’t point to a chart like that and say equities are cheap.
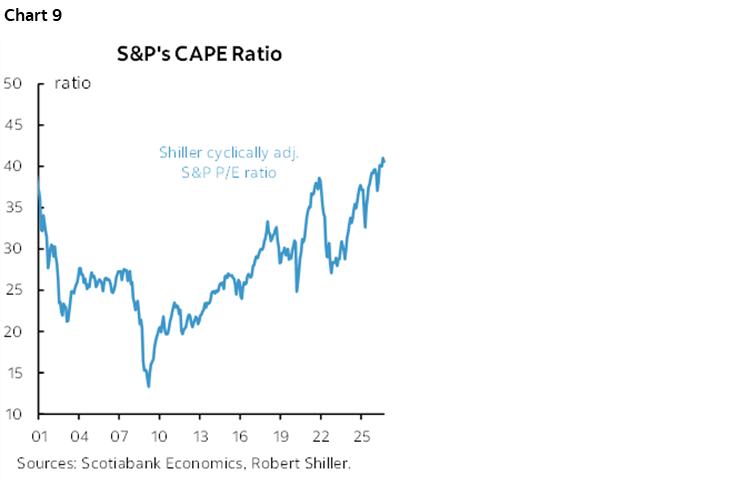
Shiller’s smoothed Cycle Adjusted Price to Earnings ratio is also at a record high (chart 9), but faces a similar challenge as Tobin’s Q—what if comparing prices to smoothed earnings over a decade entirely and inappropriately smooths out important positive shocks to earnings?
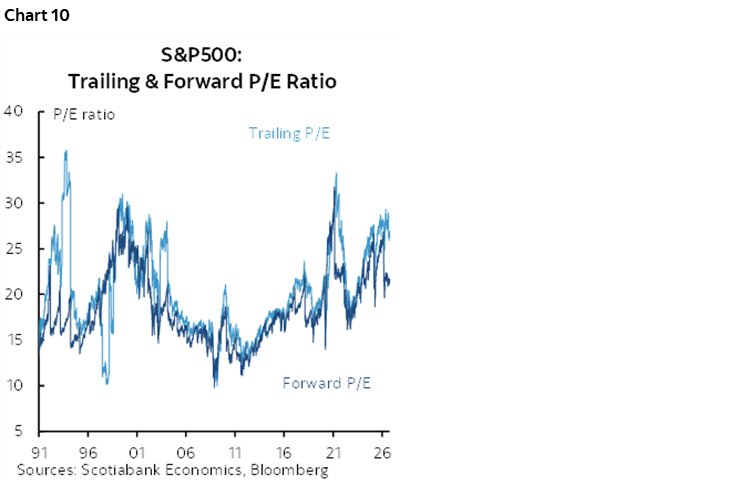
Price-to-earnings on a trailing basis are not outlandishly high by historical standards (chart 10). Ditto for price-to-forward-earnings on a one-year ahead basis. Still, when they’ve been this richly valued or higher in the past it has often either had unique circumstances—like basically free money in the pandemic—or not ended well.
No one single valuation measure is perfect. Taken together, however, the suite of measures suggests that whatever the outcome of this or future earnings season, equities are more richly priced relative t o bonds than witnessed in at least a generation.
US INFLATION—DOESN’T MATTER, BUT TELL ME ANYWAY
Federal Reserve Chair Warsh is fond of saying that he’s not focused on recent data in favour of the past five years of inflation evidence and the potentially long path forward. So, Wednesday’s CPI refresh for September won’t matter. Except it will. The FOMC as a whole appears to be more data dependent than the rhetoric.
This update might spook the hawks if estimates prove to be close to the mark. I’ve estimated a CPI gain of 0.6% m/m SA that would lift the year-over-year rate to 3.7% from 3.4%. Key, however, will be core CPI ex-food and energy that I’ve estimated to be up 0.3% m/m SA, or up a tick to 2.5% y/y. There is material risk that core CPI may be weaker than estimated.
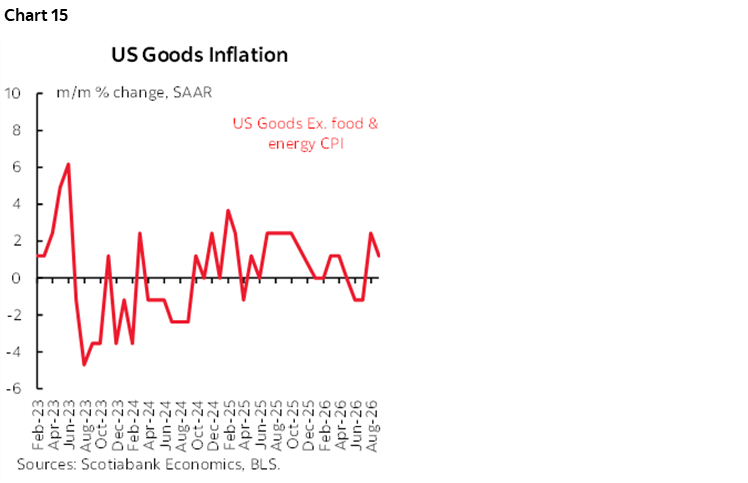
Higher gasoline prices are one driver along with food price inflation. Market-based services inflation is another (chart11). Core service price inflation was quite hot in August which could mean September softens from this high jumping off point (chart 12). Tamer housing inflation has arrived through both OER and primary rent (charts 13-14). Key may be further pass through of cost pressures into services and goods prices (chart 15). Countering this is whether squeezed real wages leave little appetite by consumers to accept price hikes outside of commodities like food and gas.
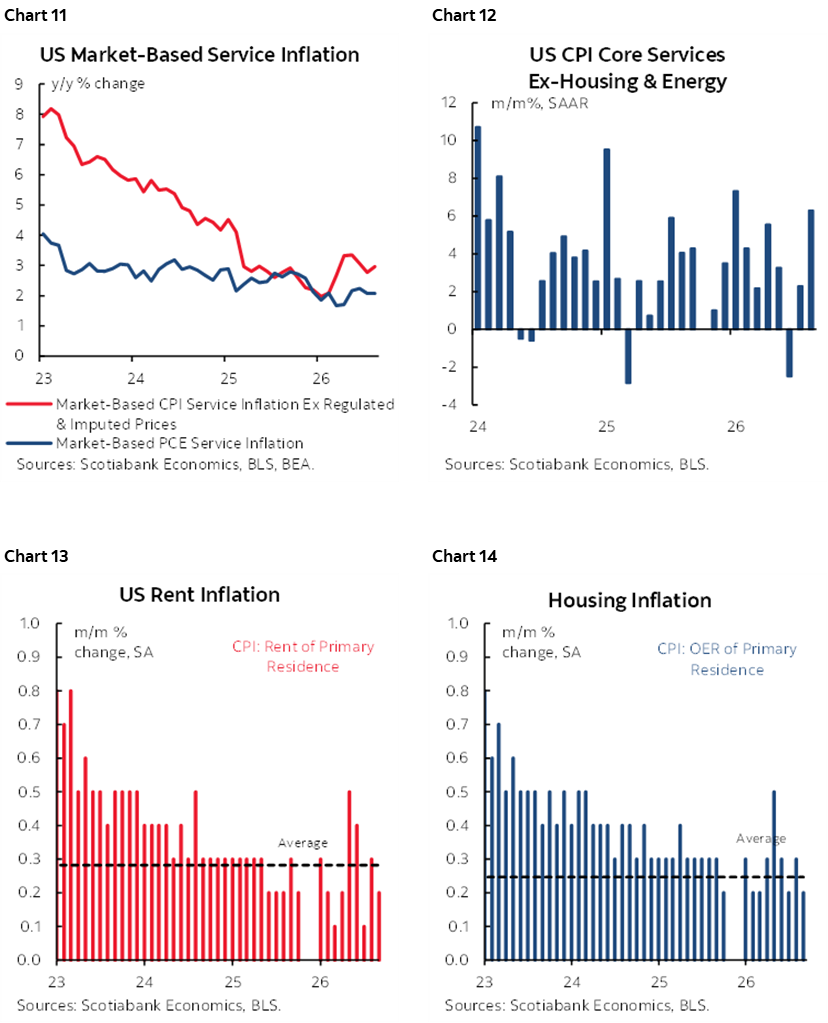
By Thursday we will have what we need to estimate the next core pce inflation reading albeit not due until the day after the FOMC's next rate decision. Producer prices are due that day and while they are expected to accelerate, it's the specific components that flow into PCE that will matter. They include items in health care services, portfolio management services etc.
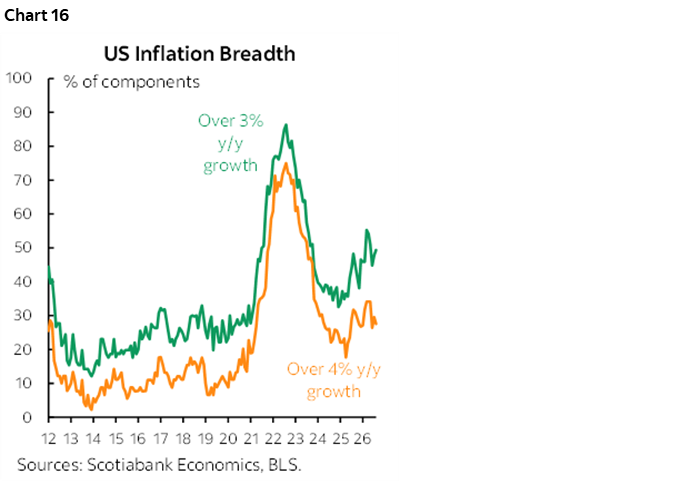
Breadth to inflationary pressures is elevated (chart 16). Key is whether initially high breadth will be sustained in second round effects or short circuit through demand destruction-induced disinflation. Low wage growth and falling real house prices alongside uncertain equity market directions could limit sustained inflation.
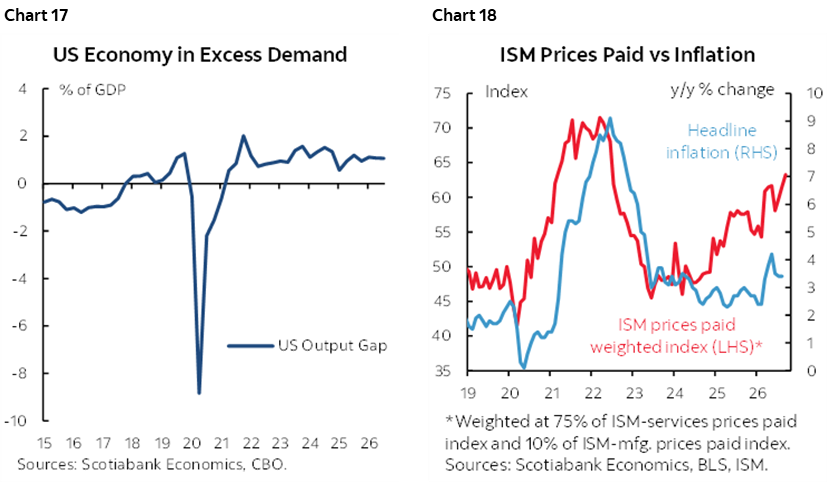
Yet what also matters are capacity constraints. The US output gap—the balance between supply and demand pressures—remains in net excess demand (chart 17). We think balance could be restored into next year as growth slows, easing capacity constraints and inflationary pressures. Further, soft survey-based data suggests coming upside risk to inflation (chart 18).
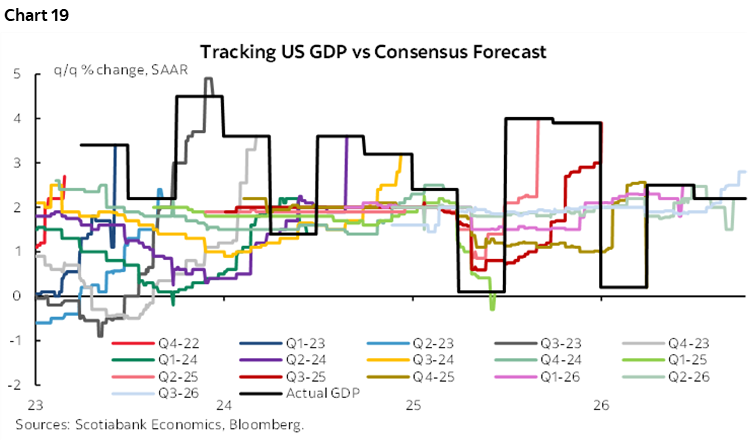
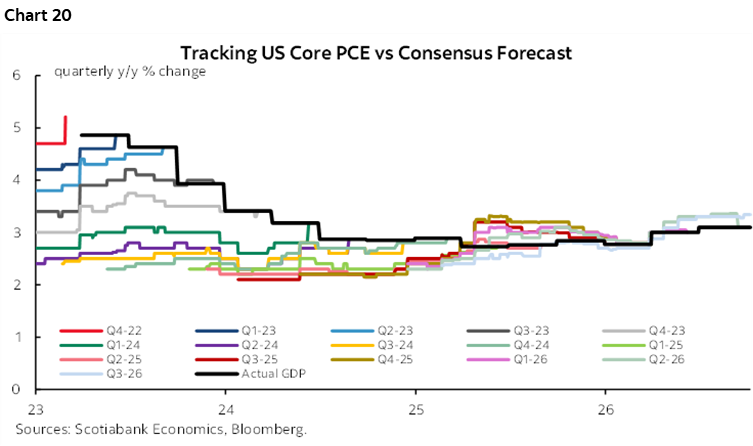
Then again, there is a clear serial bias among forecasters to lowball US GDP growth and it has been going on for years (chart 19). The black line shows actual quarter-over-quarter GDP growth at an annualized rate. All of the other lines are consensus projections across Bloomberg surveys. We at Scotiabank Economics have also had a similar experience; in fact, growth has outperformed our expectations more than consensus across recent quarters. Granted, what was once a serial bias toward going too low on forecast core PCE inflation has largely shaken out of late (chart 20).
CENTRAL BANKS—PACK YOUR WELLIES
Several of the world’s top central bankers will descend upon Bangkok, Thailand this week for the annual meetings of the Institute for International Finance (agenda here) and the IMF (agenda here). Maybe bring your wellies, raincoats and umbrellas as more rain is expected after devastating floods.
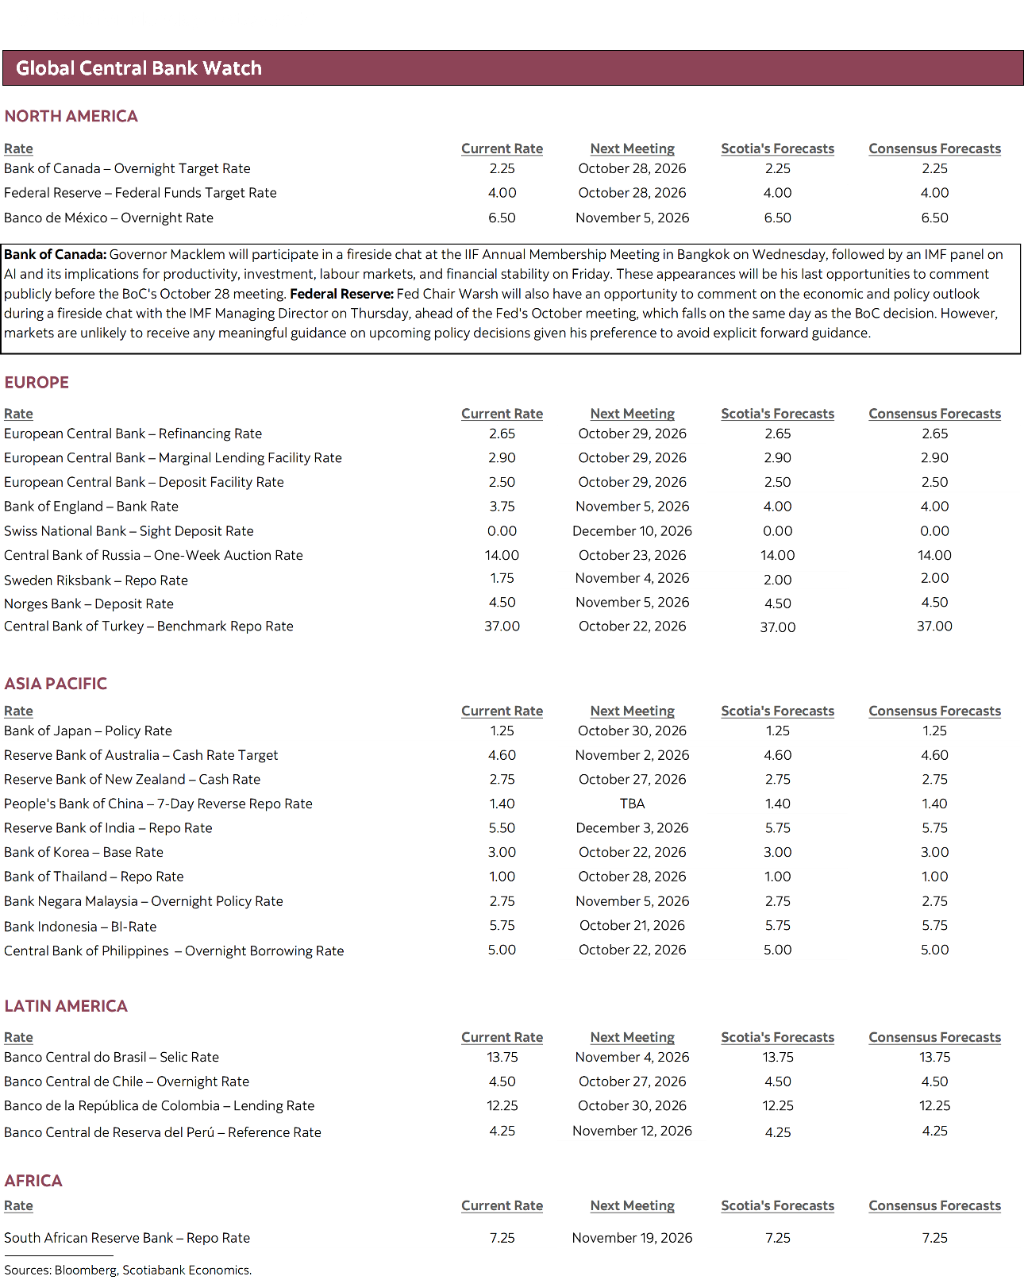
Bank of Canada Governor Macklem appears twice this week and may further elaborate upon monetary policy matters ahead of the following Tuesday’s blackout period before the October 28th decision. If he has something to say about fresh developments, then now may be the time to say it with the forecast process well underway alongside completed quarterly surveys to be released the following week.
If you’re in my time zone, then you’ll either have to be an insomniac to trade anything he says or defer to overseas colleagues. The first time will be on Wednesday in a 20-minute moderated fireside chat at the IIF meetings in Bangkok, Thailand (2:05amET, no text). It could be Macklem’s swan song before this forum ahead of the end of his current term next June. Macklem chairs the Group of Governors and Heads of Supervision at the BIS so that role could shape his remarks. The second time will be on Friday at the IMF meetings in Bangkok on a one-hour panel about “AI and the Global Economy: From Risk to Opportunity” along with five others that could give about 12 minutes to each participant.
See my next section for colour on how I would approach things if I were Macklem.
Bank of England Governor Bailey also appears at the IIF meetings Friday during a 20-minute moderated conversation (10:30pmET).
Federal Reserve Chair Warsh will be among the closing acts when his 30-minute moderated fireside chat unfolds on Friday morning in Bangkok (11:30pmET Thursday). The FOMC blackout commences the next day before the October 28th decision for which little chance at a hike is priced. We forecast one more hike this year, likely in December. Warsh doesn’t believe in forecasts or giving direct guidance so it’s unclear how relevant his remarks may be to markets.
WHAT MIGHT—OR SHOULD—MACKLEM SAY?
Is Bank of Canada Governor Macklem likely to pivot dovishly because of the latest jobs report? He might, given what I perceive to be his often-dovish mindset, but here are three reasons why he shouldn’t. We are accordingly standing by our forecast for the Bank of Canada to hike thrice by early next year and leaning toward more in a coming update.
First, I strongly believe that this was a fake jobs report. As argued here, I flat out don’t believe that public sector jobs principally in Quebec and during an election campaign suddenly became among the world’s riskiest forms of employment. The CAQ did not run the best campaign as evidenced by the results, but there’s a limit to thoughts around how they would have self-immolated. I also think that there was an unusually strong supply shock to the labour force that explained the lost jobs and kept the unemployment rate little changed. Also remember that this is a small sample that receives responses from about ½% of folks in the labour force with a high degree of statistical noise represented by a 95% confidence band of +/-57k jobs around the mean estimate. You could turn the CN Tower sideways and ram it clean through such bands. It also employs a panel rotation method that sticks to sampling the same households for six months at a time, rotating out one-sixth of the sample per month. It’s entirely possible that the sample pivots too slowly and thus oversampled job losses. Using AI methods I turn up maybe 2,500 gross job reductions at nationwide school boards and hospitals and it’s a time of year that usually offsets this through hiring. Not -68k.
Second, the BoC’s job is to manage inflation and inflation risk. Not jobs. I believe we have enough evidence that inflation is on or above the BoC’s 2% target which should have them leaning toward an inflation risk management perspective to guard against overshooting as the Canadian economy closes off spare capacity and higher costs hit. Core CPI has been 3% m/m SAAR or higher for four straight months, so stop denying pass through effects. Trimmed mean and weighted median have been at 2¾% m/m SAAR for the past two months. TM and WM average about 2% y/y. Headline CPI is well over 3% y/y. Why is the BoC still on the lower bound of neutral with a zero to negative real policy rate with inflation on or above target if they treat their inflation target seriously?
Third, there is no such thing as immaculate disinflation. During the pandemic, opponents to rate hikes argued that higher borrowing costs would damage the economy and therefore they wouldn’t happen. They missed the plot. They may be missing it again. You don’t get disinflation without planting its seed through tighter financial conditions and monetary policy while inflation—being the complex beast that it is—has many drivers beyond jobs. So does growth, as fiscal policy ramps up, commodity markets buoy growth, and Canada continues to adapt nicely to tariffs through US growth pulling in more imports, CAD depreciation against many global currency crosses, a lower tariff shock against Canada than anyone else which brings trade diversion benefits, and distance from most of the tariff shocks.
And while this may not merit a fourth point, the BoC tends to look at broad trends, taking the supply and demand sides into account simultaneously on the path toward fresh forecasts later this month that are likely to raise growth and inflation.
GLOBAL MACRO—A FEW MORSELS
A lighter than usual global line-up of other major releases will mainly focus upon US retail sales, UK monthly readings on the economy, Australian jobs, Chinese and Indian CPI, and monthly GDP proxies from a pair of LatAm economies. Jay and I tackle what follows.
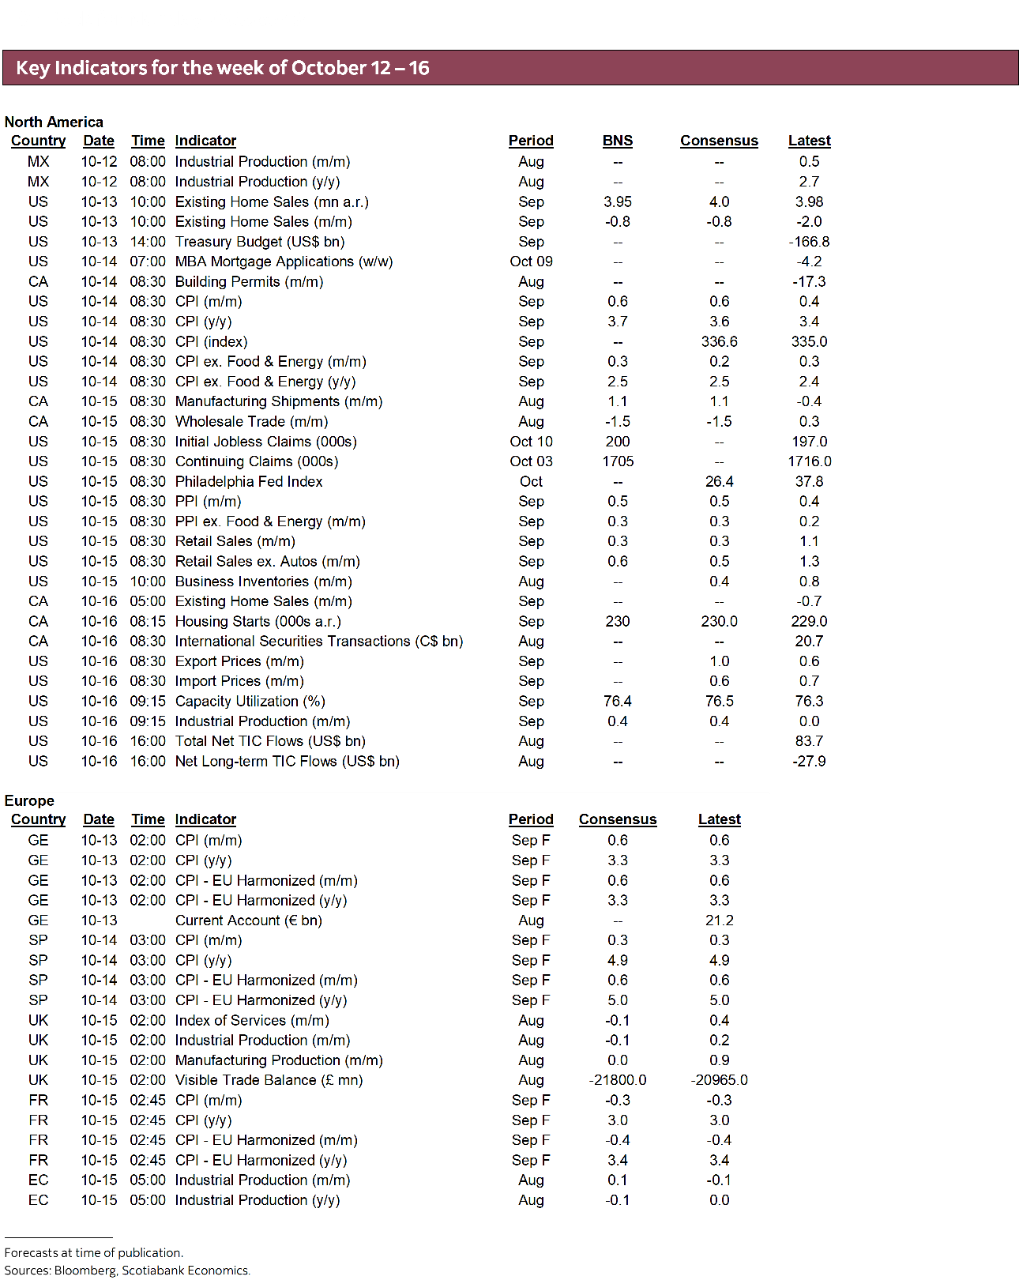
US markets face three main calendar-based risks this week: US CPI (see above), limited other data, especially retail sales, and Fed Chair Warsh’s appearance (see earlier). As for data, existing home sales during September were probably flat at just shy of 4 million annualized (Tuesday). Thursday’s retail sales could struggle to stay afloat after a strong prior gain of over 1% m/m and given a nearly 5% m/m SA drop in vehicle sales. Yearly growth of inflation-adjusted wages in September (Wednesday) will likely remain slightly negative. Industrial figures will include the Philly Fed’s regional gauge of manufacturing activity (Thursday) and industrial output during September (Friday).
Canada’s calendar goes fairly quiet this week with just minor releases due out. Advance guidance from Statcan based upon a partial sample of responses pointed to a gain of over 1% m/m in the value of manufacturing shipments with the final estimates and details like volumes and prices due on Thursday. Advance guidance also pointed to a drop of around 1½% m/m to the value of wholesale shipments, also due Thursday. Existing home sales during September (Friday) follow the first dip in five months and housing starts could stabilize in the 230k annualized range if permit volumes serve as a guide when September figures are updated on the same day.
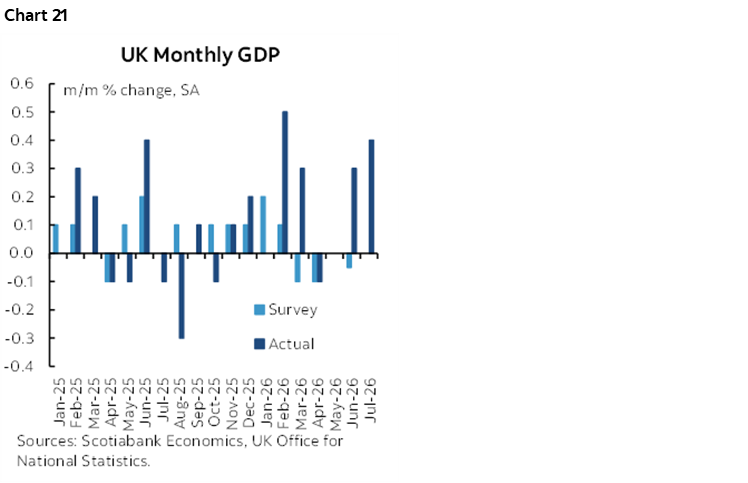
The UK calendar will be dominated by August activity data on Thursday, helping refine Q3 GDP tracking. July's stronger-than-expected 0.4% m/m GDP growth marked a second consecutive upside surprise (chart 21), with industrial and manufacturing output also exceeding expectations. Growth has remained more resilient than anticipated, supported in part by AI-related services. Whether that resilience can be sustained will be key, however, as rising energy bills put increasing pressure on households and businesses.
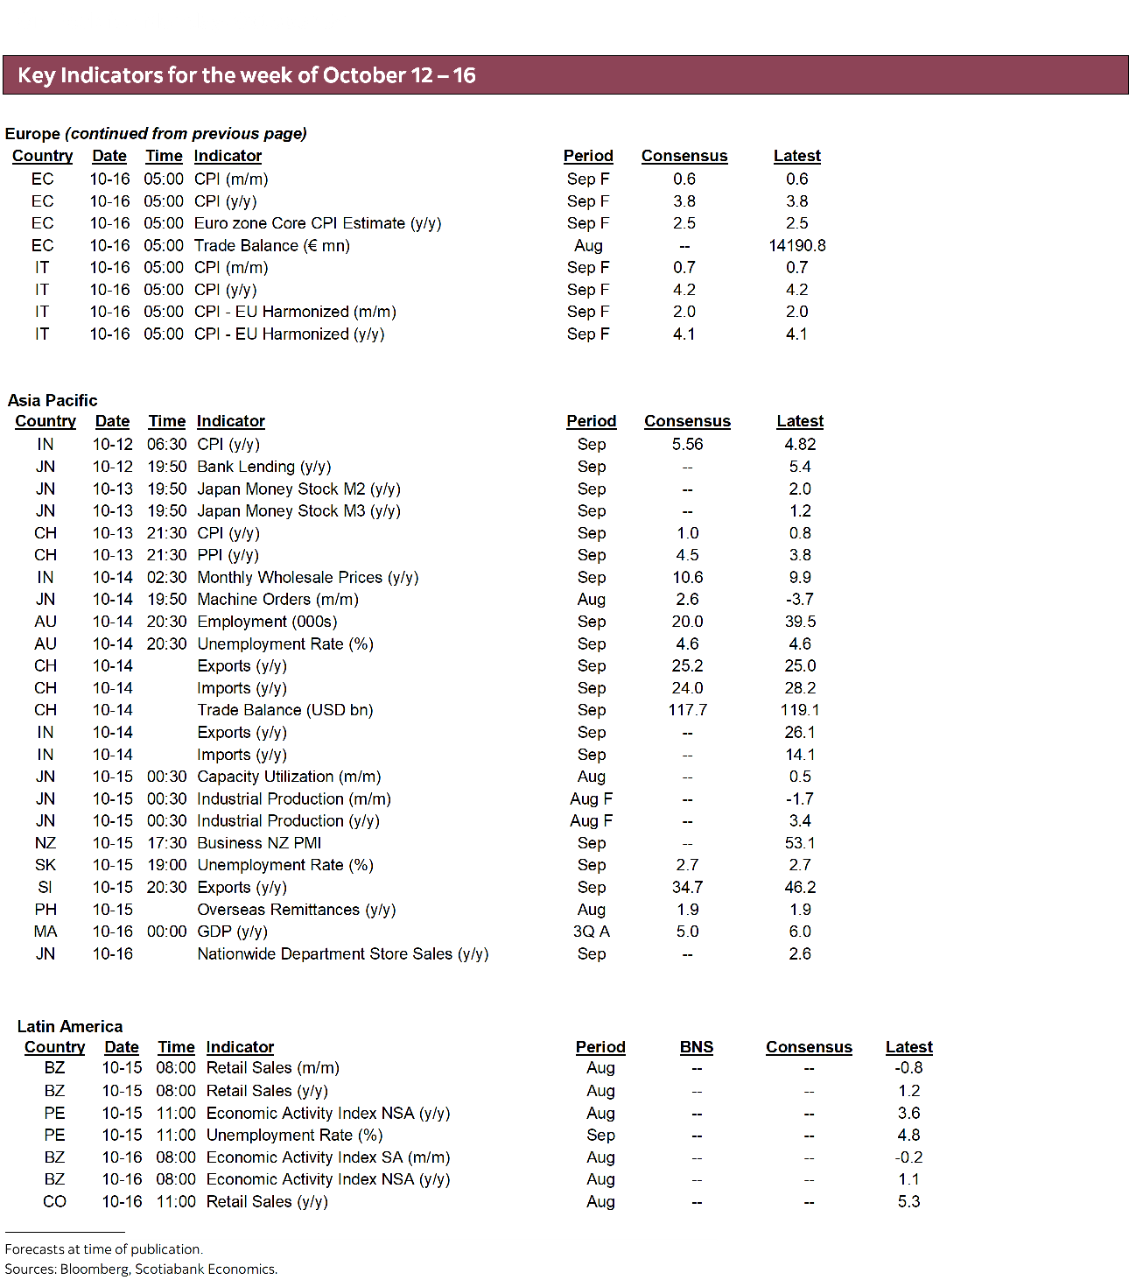
Across Asia-Pacific, September inflation reports in India (Monday) and China (Tuesday), followed by Australia's labour market data on Wednesday, will provide an important read on regional economic conditions.
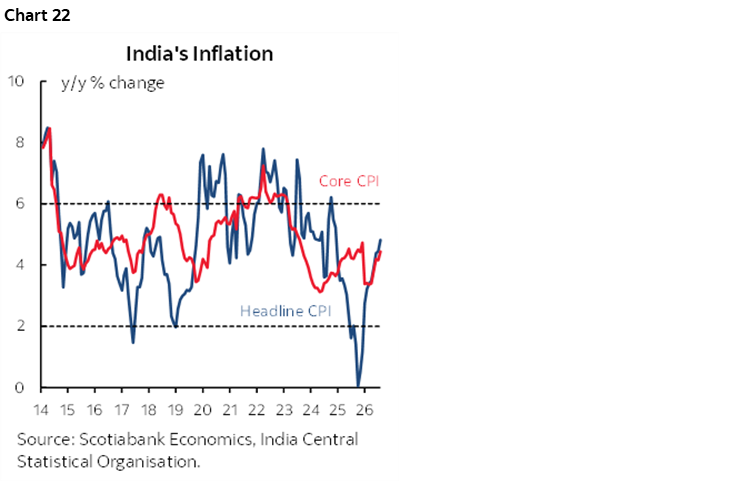
In India, inflation is projected to move higher toward the upper end of the RBI's 2-6% target range (chart 22), driven by food and energy prices alongside signs of broadening price pressures. With two inflation prints remaining before the RBI's December meeting, following last week's 25 bp hike, incoming data will be critical for shaping policy expectations.
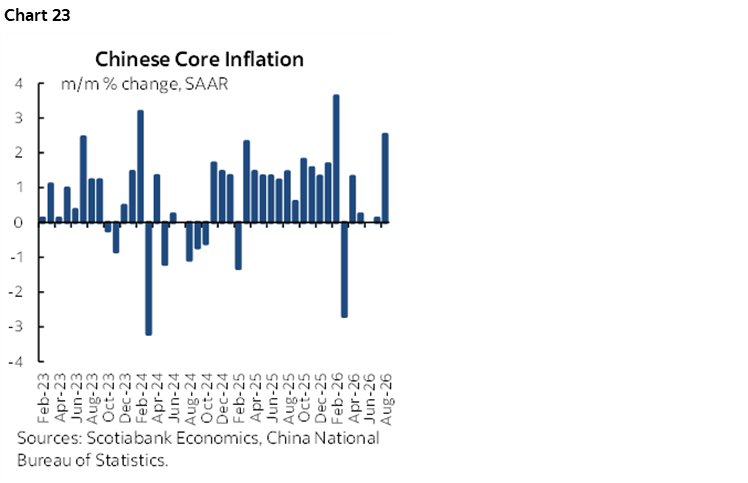
In contrast, China's CPI is expected to edge up to 1% while remaining well below the PBoC's target. Although month-over-month core CPI accelerated in August, further evidence is needed to confirm a sustained uptrend (chart 23).
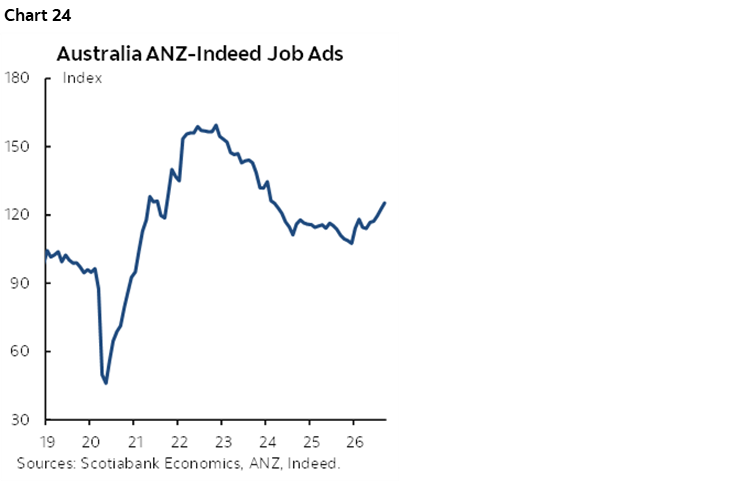
Australia's labour market is expected to post another month of modest job growth in September, supported by resilient labour demand and a pickup in Indeed job postings and ANZ-Indeed job ads (chart 24). However, the key focus will be on whether labour force growth continues to outpace employment gains as participation recovers, putting upward pressure on the unemployment rate. Despite adding 177k jobs so far this year, the economy has seen the labour force expand by 270k people, resulting in the unemployment rate rising to 4.6% from 4.1% at the start of the year.
In Latin America, August activity data from Peru and Brazil on Thursday and Friday will provide a fresh read on the region's growth dynamics. Leading indicators in Peru point to another solid expansion following July's strong rebound, supported by resilient domestic demand, although El Niño-related disruptions remain a key risk. By contrast, activity in Brazil is expected to remain subdued as the effects of restrictive monetary policy continue to weigh on growth.


DISCLAIMER
This report has been prepared by Scotiabank Economics as a resource for the clients of Scotiabank. Opinions, estimates and projections contained herein are our own as of the date hereof and are subject to change without notice. The information and opinions contained herein have been compiled or arrived at from sources believed reliable but no representation or warranty, express or implied, is made as to their accuracy or completeness. Neither Scotiabank nor any of its officers, directors, partners, employees or affiliates accepts any liability whatsoever for any direct or consequential loss arising from any use of this report or its contents.
These reports are provided to you for informational purposes only. This report is not, and is not constructed as, an offer to sell or solicitation of any offer to buy any financial instrument, nor shall this report be construed as an opinion as to whether you should enter into any swap or trading strategy involving a swap or any other transaction. The information contained in this report is not intended to be, and does not constitute, a recommendation of a swap or trading strategy involving a swap within the meaning of U.S. Commodity Futures Trading Commission Regulation 23.434 and Appendix A thereto. This material is not intended to be individually tailored to your needs or characteristics and should not be viewed as a “call to action” or suggestion that you enter into a swap or trading strategy involving a swap or any other transaction. Scotiabank may engage in transactions in a manner inconsistent with the views discussed this report and may have positions, or be in the process of acquiring or disposing of positions, referred to in this report.
Scotiabank, its affiliates and any of their respective officers, directors and employees may from time to time take positions in currencies, act as managers, co-managers or underwriters of a public offering or act as principals or agents, deal in, own or act as market makers or advisors, brokers or commercial and/or investment bankers in relation to securities or related derivatives. As a result of these actions, Scotiabank may receive remuneration. All Scotiabank products and services are subject to the terms of applicable agreements and local regulations. Officers, directors and employees of Scotiabank and its affiliates may serve as directors of corporations.
Any securities discussed in this report may not be suitable for all investors. Scotiabank recommends that investors independently evaluate any issuer and security discussed in this report, and consult with any advisors they deem necessary prior to making any investment.
This report and all information, opinions and conclusions contained in it are protected by copyright. This information may not be reproduced without the prior express written consent of Scotiabank.
™ Trademark of The Bank of Nova Scotia. Used under license, where applicable.
Scotiabank, together with “Global Banking and Markets”, is a marketing name for the global corporate and investment banking and capital markets businesses of The Bank of Nova Scotia and certain of its affiliates in the countries where they operate, including; Scotiabank Europe plc; Scotiabank (Ireland) Designated Activity Company; Scotiabank Inverlat S.A., Institución de Banca Múltiple, Grupo Financiero Scotiabank Inverlat, Scotia Inverlat Casa de Bolsa, S.A. de C.V., Grupo Financiero Scotiabank Inverlat, Scotia Inverlat Derivados S.A. de C.V. – all members of the Scotiabank group and authorized users of the Scotiabank mark. The Bank of Nova Scotia is incorporated in Canada with limited liability and is authorised and regulated by the Office of the Superintendent of Financial Institutions Canada. The Bank of Nova Scotia is authorized by the UK Prudential Regulation Authority and is subject to regulation by the UK Financial Conduct Authority and limited regulation by the UK Prudential Regulation Authority. Details about the extent of The Bank of Nova Scotia's regulation by the UK Prudential Regulation Authority are available from us on request. Scotiabank Europe plc is authorized by the UK Prudential Regulation Authority and regulated by the UK Financial Conduct Authority and the UK Prudential Regulation Authority.
Scotiabank Inverlat, S.A., Scotia Inverlat Casa de Bolsa, S.A. de C.V, Grupo Financiero Scotiabank Inverlat, and Scotia Inverlat Derivados, S.A. de C.V., are each authorized and regulated by the Mexican financial authorities.
Not all products and services are offered in all jurisdictions. Services described are available in jurisdictions where permitted by law.