Next Week's Risk Dashboard
- Markets are too complacent toward global inflation
- 4th time lucky for pandemic-era US inflation?
- PBOC should look through deflation hype
- Canada has yet to slip into an inflation soft patch
- FOMC minutes will hold back on the pom poms
- Temporary UK inflation relief?
- Japanese inflationary pressures
- Indian inflation facing sharp upside risk
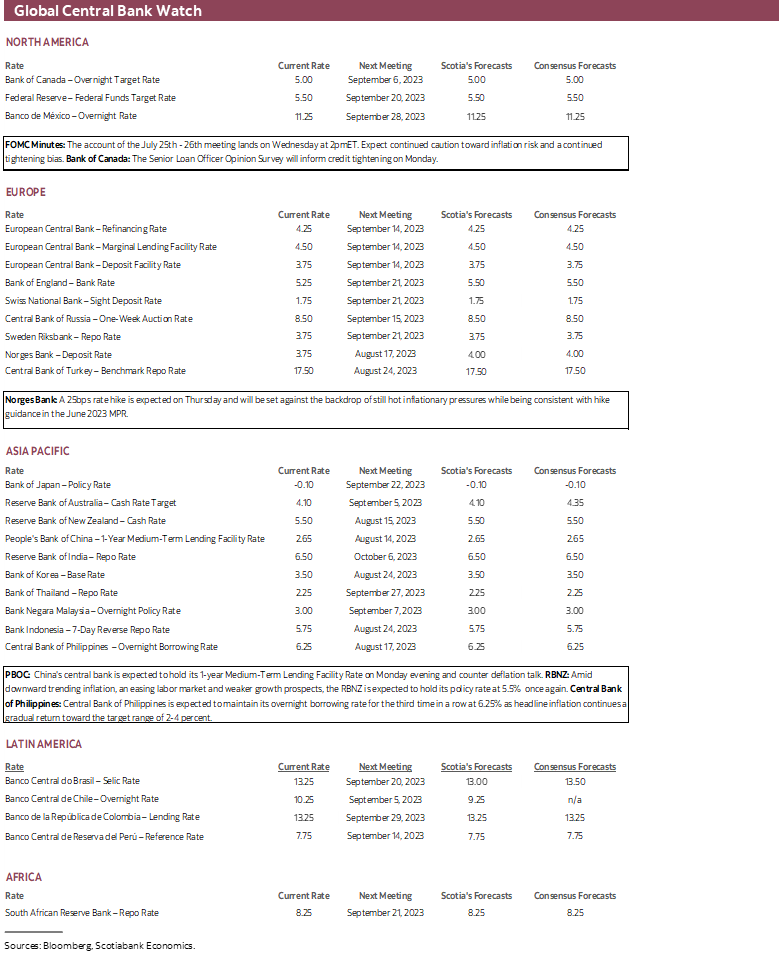
- Norges Bank to hike again
- RBNZ, BSP to hold
- RBA minutes superseded by testimony
- US, UK retail sales to update consumer tracking
- Chinese macro readings to inform Q3 GDP tracking
- Australia’s jobs juggernaut
- UK wages supporting second-round inflation risks
- Q2 GDP: Japan, Colombia, Chile, Malaysia
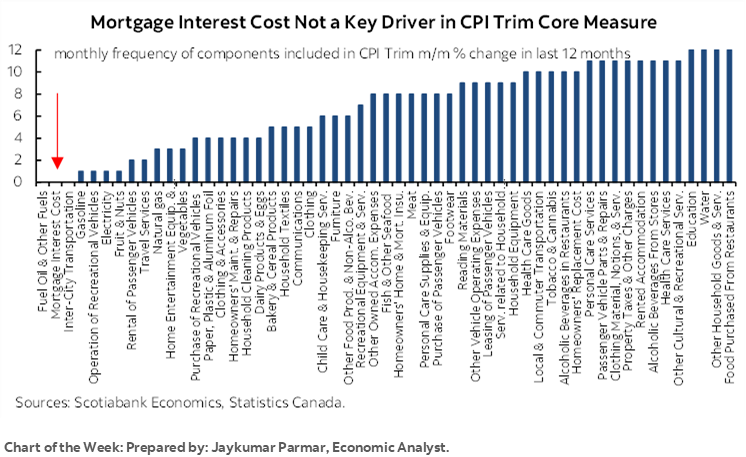
Chart of the Week
There is plenty of precedence to back the belief that market movements during August need to be taken with a healthy dose of skepticism until markets transition toward what often turn out to be more difficult conditions through which to navigate. True, seasonality may be overhyped, as Mark Twain’s writings once quipped: “October: This is one of the peculiarly dangerous months to speculate in stocks. The others are July, January, September, April, November, May, March, June, December, August and February.”
Nevertheless, the wild volatility that we’ve been seeing over recent weeks is perhaps testament to the stereotype about August and what may lie ahead. Markets have swung wildly back and forth from curve steepeners to flatteners, and risk-on to risk-off sentiment. One minute the prevailing narrative has been that US bond supply and a ratings downgrade will doom everything, and then the next minute to oh wait, it’s not so bad since, after all, it’s the US and it gets away with a lot in global markets.
Right now, the market sense is that inflation has been licked in the largest markets like the US and China, as well as smaller ones like Canada, and that perhaps a darker scenario of falling prices is at a nascent stage of development. This has motivated markets to return to pricing US rate cuts while heaped on dovish commentary on where China is headed.
Perhaps transitioning toward September when attention shifts back toward major central bank decisions and summertime markets are behind us will bring needed clarity. Supply will return as a focal point the week after next, but in the meantime, inflation—and how central banks are reacting to it—will remain the focus over the coming week.
I’ll argue that in my opinion, markets and much of the dovish inflation narrative are getting ahead of themselves. This argument will be advanced below for each of China, the US, Canada, the UK, Japan and India. Among the drivers are that key global commodity prices are broadly rising, wage pressures are strong across several markets, and tight conditions persist in economies and their labour markets.
PBOC—COUNTERING DEFLATION TALK
The People’s Bank of China is widely expected to leave its one-year Medium-Term Lending Facility Rate unchanged at 2.65% on Monday evening (eastern time as always in this report). That would probably mean that banks will leave their 1- and 5-year Loan Prime Rates unchanged the following week lest pressure to narrow spreads be brought upon the largest banks.
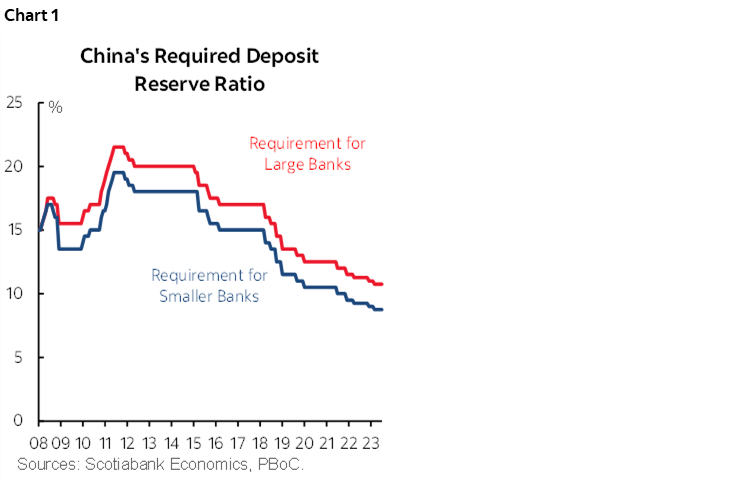
Policymakers have guided markets to expect modest and targeted stimulus that may leave the door open to further policy rate reductions following the 10bps rate cut in June but more likely in the form of a further reduction to required reserve ratios (chart 1), limited fiscal policy supports and somewhat easier regulations. More of the focus is likely to be brought to bear upon making lending easier through non-price measures after the recent softening of lending volumes.
But don’t expect the PBOC to ring the deflation alarm bells. Nor should they. That’s true not only because it would be destabilizing to markets by signalling panic within a culture that is hardwired to put on a brave face and a financial system that remains a long way off from being truly open and transparent while managing a dirty fixed peg to the dollar. It’s also true because it would lack merit at least at this point and perhaps newly appointed Governor Pan Gongsheng will offer substantive interpretations.
In my opinion, talk of deflation in the wake of this week’s minor -0.3% y/y drop in CPI is off base. The widespread media headlines about deflation are unbalanced, a marked departure from professional journalism, and are making four interpretive errors.
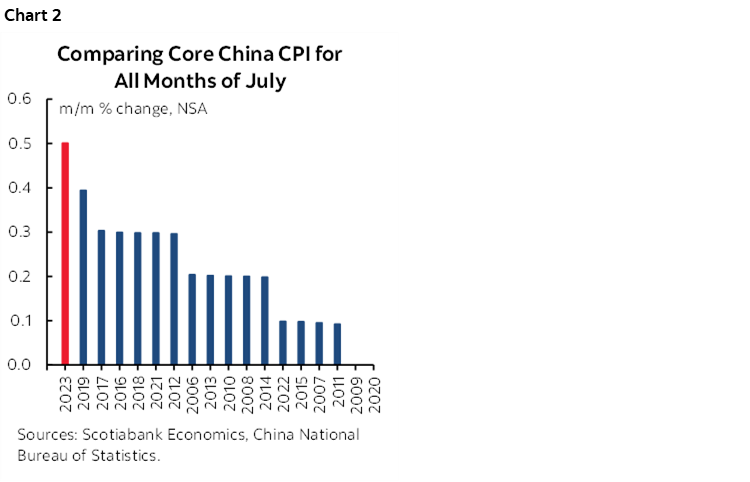
- The most glaring one is that China just posted the strongest month-over-month rise in core CPI for a month of July in records back to at least 2012 (chart 2). At 0.5% m/m NSA, the gain strongly exceeded the average for months of July over the past dozen years that works out to 0% m/m NSA. The evidence at the margin points toward a strong rebound in inflation pressures.
- Second is that deflation has to be about more than just year-ago base effects and yet that was the only reason why CPI fell in year-over-year-terms.
- Third is that the negative year-over-year headline CPI reading was narrowly driven by food prices (-1.7% y/y). Ex-food, prices were flat at 0% y/y. Ex-food and energy CPI was up 0.8% y/y. Deflation isn’t just about commodity prices and yet it was commodity prices that drove the negative year-over-year CPI reading.
- Fourth is a casual interpretation of what constitutes deflation. Most economists would define deflation as a sustained, economy-wide decline in a broad array of prices that affects behaviour in such fashion as to result in decisions like postponing consumption and investment into periods when cheaper prices are expected to prevail. That can be a devastating spiral effect that is difficult for policy to turn around. Think 1930s or, to a lesser extent, Japan over much of the past 30+ years. Whether China follows Japan is an open debate, but to this point, China is nowhere close to facing this scenario and the talk of deflation is often far too fast and loose.
This is important because it strikes to the heart of the narrative that China will export deflation abroad and turn all other central banks to be more dovish. The opposite could be closer to the truth based upon the points above and especially if China’s limited stimulus and time afford the opportunity to return to a more growth-supportive environment.
FOMC MINUTES—RESIST GETTING OUT THE POM POMS
Minutes to the FOMC’s July 25th – 26th policy meeting arrive on Wednesday. Recall that the policy rate was raised by 25bps at that meeting as expected and guidance remained data dependent, open to further tightening from here, and rather wishy washy given the long gap between the July and September meetings (recap here). Expect the minutes to largely reinforce this narrative and don’t be so sure that they should be written off as stale.
For one thing, the statement referenced that the economy has been expanding “at a moderate pace” instead of previously describing it as “modest.” Fed language tends to indicate that “moderate” is a slightly stronger reference to growth than “modest.” That was just before US GDP landed at 2.4% q/q SAAR and solidly beat expectations which vindicated the Fed’s language tweak. It wasn’t long ago that consensus was forecasting a contracting US economy in each of 2023Q1 and Q2 so the magnitude of resilience has been impressive notwithstanding pockets of weakness.
Second is whether the latest readings show that the US is at a dovish inflation turning point or simply in a temporary soft patch. I think the FOMC will remain circumspect toward this debate and lean toward a relatively hawkish bias until much further evidence is available. And rightly so.
Chart 3 vividly warns markets not to be lulled into a sense of complacency. We’re in the midst of what may be the fourth soft patch for core CPI during the pandemic era. The chart shows average month-over-month changes in core CPI in SA terms during each of these soft patches, and then what happened to this measure over the ensuing three months as inflationary pressures returned with a vengeance.
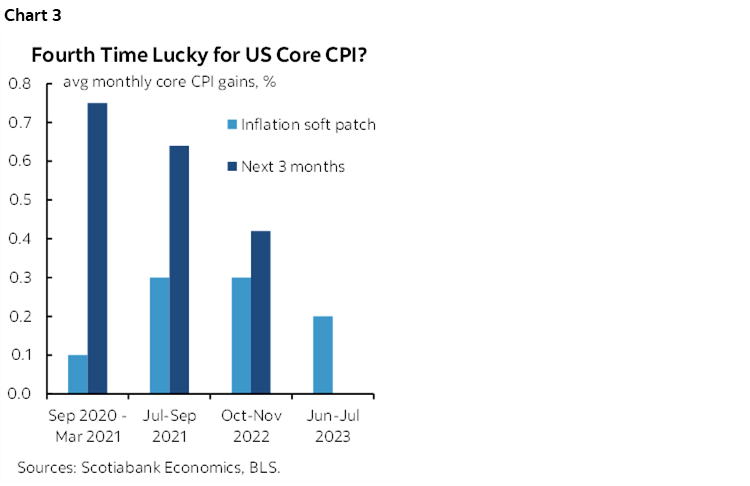
Whether the same thing happens this time or not isn’t clear, but the outcome will shape the direction of financial markets over the duration of 2023 and the tone of central bank communications and decisions with markets having returned to pricing significant policy easing by the Federal Reserve over 2024.
A case for caution was outlined here. Various measures of global food price inflation are returning albeit in volatile fashion and including the trend in CRB spot US food prices, not to mention rice prices for the few billion folks who treat it as a staple in their diets with particular implications for many EMs. So is energy inflation such as WTI that’s up by about US$16 since June along with firmer gasoline prices this month. Then there are strong wage gains in a tight labour market, an economy that is still not taking steps toward opening up disinflationary slack as GDP growth outpaces potential GDP growth, and mixed evidence across global supply chains that are at a highly nascent stage of being revamped. Add in solid consumer confidence that still has them spending and wealth effects such as the S&P’s 25% gain since last October plus rebounding house prices with the repeat sales house price index up for four straight months in a row now. Inflation’s dead you say?
The point is that markets notoriously pounce on every short-term data point and swing with the prevailing breeze in volatile fashion. The Fed can't afford to behave that way. Their bar for a sustained period of soft inflation prints is likely set much higher than the markets such that the Committee would probably require at least six and perhaps as many as a protracted year-long string of soft readings before being confident to ease up. Pardon the image, but we’re still a long way from Powell pulling out the pom poms and doing sky high leg kicks in a press conference!
CANADIAN CPI—NO SOFT PATCH SO FAR
On Tuesday, Canada will update the last CPI inflation report before the Bank of Canada’s next policy decision on September 6th. It will combine with Monday’s BoC lending survey and the Q2 GDP release on September 1st to present the final ingredients to the next data dependent decision. The next report on jobs and wages won’t arrive until two days after the decision.
Canada, by contrast to the US, has not experienced a soft patch in the preferred inflation readings that are closely followed by the Bank of Canada. If readings remain warm to hot this week, then they will merely extend the pattern in hawkish fashion; if they stall out, then it will only be one month with many more months of soft readings required to soothe the BoC’s concerns.
I’ve pencilled in an estimated 0.3% m/m NSA rise in July’s headline CPI with a comparable gain in traditional core CPI ex-food and energy. They would translate into seasonally adjusted increases of 0.3-0.4% m/m for headline and 0.1% for traditional core. July tends to be a seasonally soft month for prices. Gasoline prices should not have a material effect but will tentatively add a bit to the next reading for August. Food prices could be an upside risk as trend global food market prices have accelerated.
One key thing to watch will be evidence on pressures at the margin in terms of the BoC’s preferred measures of core inflation. Recall that in June, trimmed mean and weighted median CPI both accelerated to 3.6% m/m SAAR and therefore reversed the prior month’s dip (chart 4). On a three-month moving average basis, weighted median CPI has been running at 3.6% m/m SAAR and trimmed mean has been up by 4.1%.
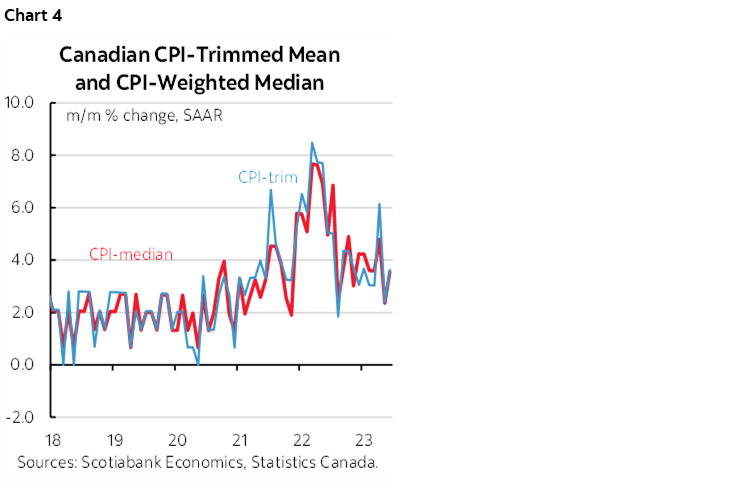
These readings emphasize how it is in the very least premature to be saying that inflation is on the BoC’s 2% medium-term target. In fact, it’s downright false to be asserting as much. Underlying price pressures remain materially hotter than desired which is why the BoC emphasizes that progress has been made, but the next push down to 2% may be more difficult to achieve.
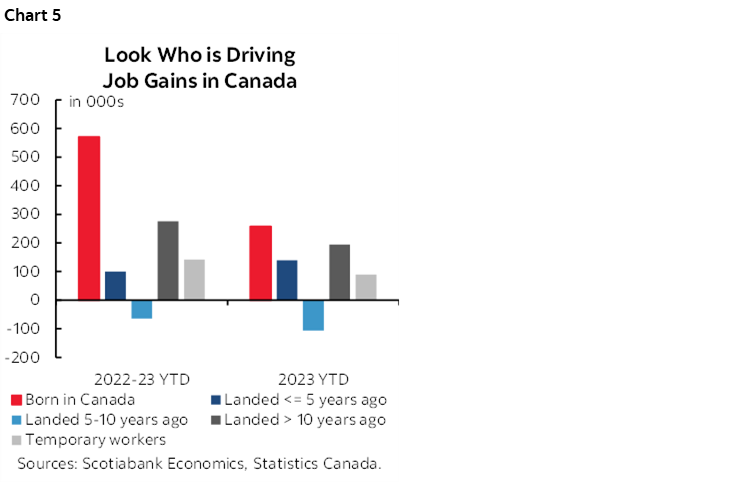
What reinforces this concern is wage growth particularly net of productivity in the context of a still very tight labour market that lost a statistically negligible number of jobs in July (-6k) especially given the +/-57k 95% confidence interval around monthly changes in employment. It would take hundreds and hundreds of thousands of lost jobs to make me think that the labour market is finally rolling and that is nowhere close to having begun—with or without the effects of immigration. Job growth continues to be dominated by those born in Canada and immigrants who have been in the country for many years with all estimates subject to wide confidence intervals as per the norm with the Labour Force Survey (chart 5).
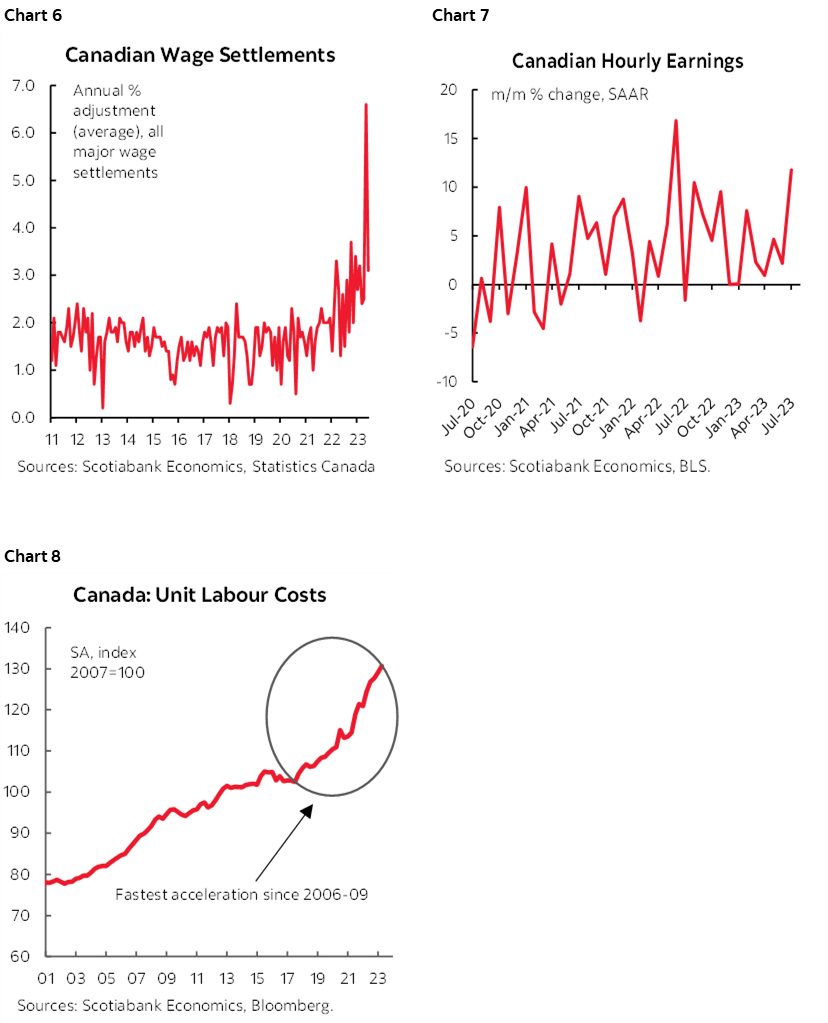
By contrast, collective bargaining decisions have already driven accelerated wage settlements and many of the recent agreements have yet to be fully factored into pay as more strike action continues to surface and even after a sharp upward revision to the data (chart 6). From your grocery store’s deli counter to dock workers, civil servants to airline pilots and educators, it seems that much of the country has spent 2023 monitoring labour strikes perhaps second only to wildfires, although that’s a close call. The outcome of Ontario’s appeal of the ruling against Bill 124 is also still pending. Overall wage growth for all Canadians accelerated to about 11% m/m SAAR in July (chart 7). Since worker productivity—defined as output per hour worked—has been performing so poorly, gains in employment costs net of productivity have continued to accelerate sharply (chart 8).
As argued back in April (here), IMF research shows that countries with high rates of unionization and tight labour markets tend to see stronger spillover effects of collective bargaining wage gains elsewhere in the labour market. Canada ticks both boxes with a 30% unionization rate—triple that of the US—and a tight job market.
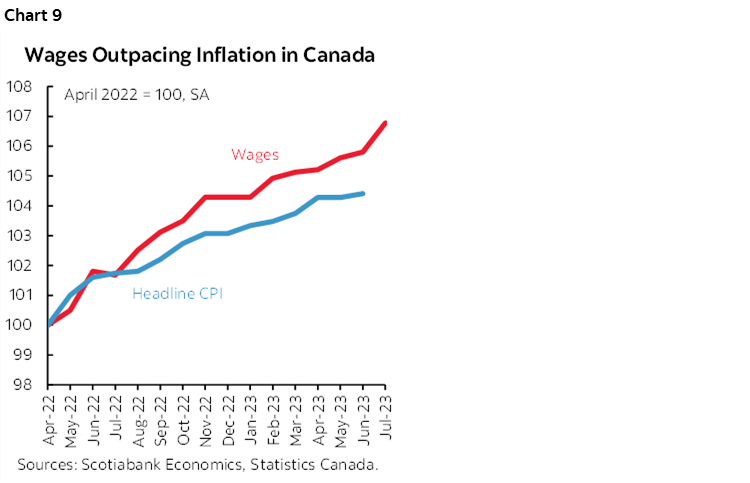
The plea that it’s all just to keep up with inflation is understandable with all of the pressures upon household finances, but the recent facts say otherwise. Properly measured, the average trend Canadian wage gain has been exceeding inflation for over a year now (chart 9).
Like the US, we can add to this picture. The economy remains in excess demand conditions after 2023H1 growth blew the socks off forecasters. Canada’s economy has therefore not yet begun the process of opening up disinflationary slack and then embarking upon a 1-2 year lagged effect toward lower inflation. The TSX has underperformed the US S&P 500 but held its own while a housing wealth effect has returned amid rising house prices. Energy prices are creeping higher at an unusual moment in late summer. Food price inflation appears to be returning. Supply chain progress remains mixed beyond narrow measures like the improvement in order backlogs.
For these reasons, it’s premature in my view to say that the BoC is done raising rates. It’s definitely premature to be thinking of rate cuts any time soon and I’m skeptical toward the consensus view that they begin to ease by 2024Q3 which is basically what almost everyone is guessing.
A key consideration will be that the Canadian economy has not even begun the process of opening up a material amount of disinflationary slack. Consensus forecasts for Q2 GDP growth have swung from contraction toward expecting 1½% growth. Scotiabank Economics’ estimate is the same and so is the Bank of Canada’s in their July MPR. Serial shocks including multiple strikes and wildfires are among the considerations that are making it difficult to properly read what’s happening in the economy while perhaps adding upside to Q3/Q4 GDP once they shake out.
GLOBAL MACRO—MORE INFLATION AND CENTRAL BANKS!
The week’s inflation focus will extend across other major economies including the following:
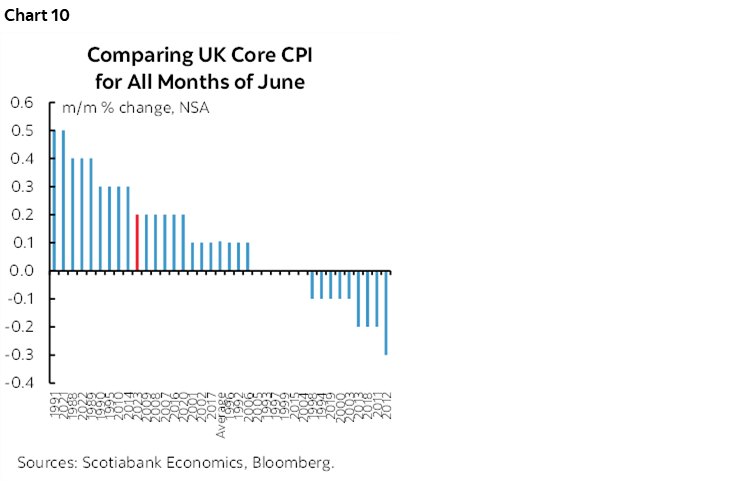
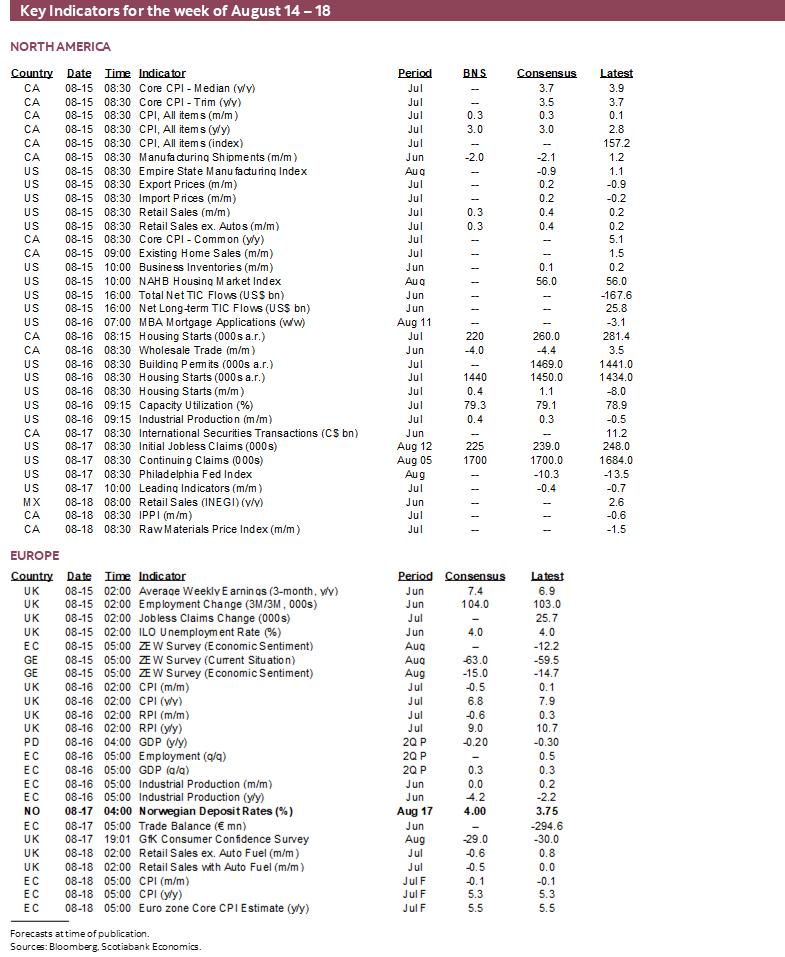
- United Kingdom: CPI for July arrives on Wednesday. Overall prices are expected to drop by -0.5% m/m NSA and Ofgem’s—a UK energy regulator—lowered energy price caps should spell further relief in August and September at least for headline inflation. Key, however, will be core inflation and whether the prior month’s return toward more seasonally normal month-over-month NSA gains is a durable departure from the preceding multi-month pattern of higher than seasonally normal increases (chart 10). As energy price caps fall, the freed up income may come to generate second-round pressures upon core inflation.
- Japan: CPI for July is due on Thursday. We already know that Tokyo CPI edged up with revisions that kept the year-over-year rate steady at 3.2% in each of June and July and the ex-food and energy component higher at 4% y/y from 3.8% previously. The national totals are likely to mostly follow suit and therefore conform to the BoJ’s recent upward revisions to projected inflation that contributed toward the decision to set a higher tolerated yield range on 10-year JGBs.
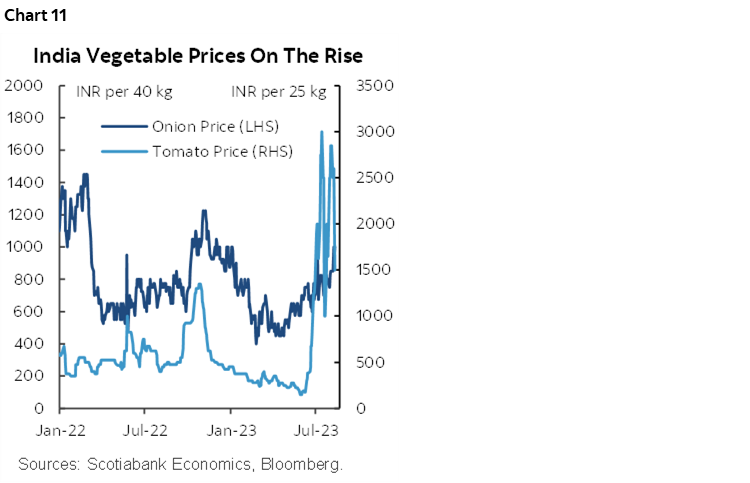
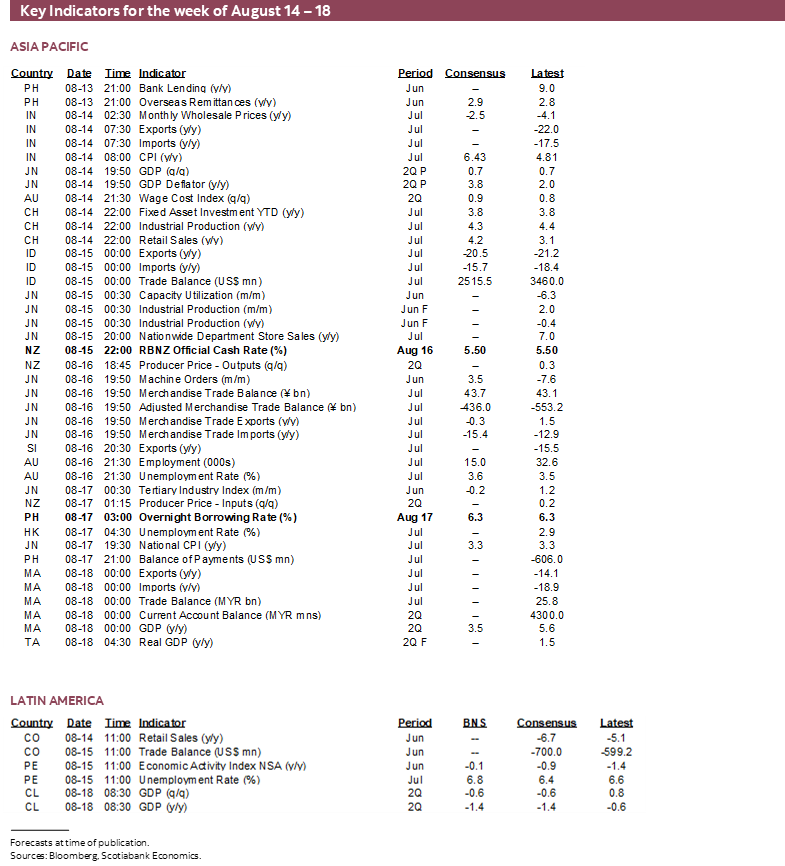
- India: July’s reading on Monday is expected to reaccelerate from 4.8% y/y to back over 6%. Rising prices for onions and tomatoes—key staples in the Indian diet—are contributing factors (chart 11).
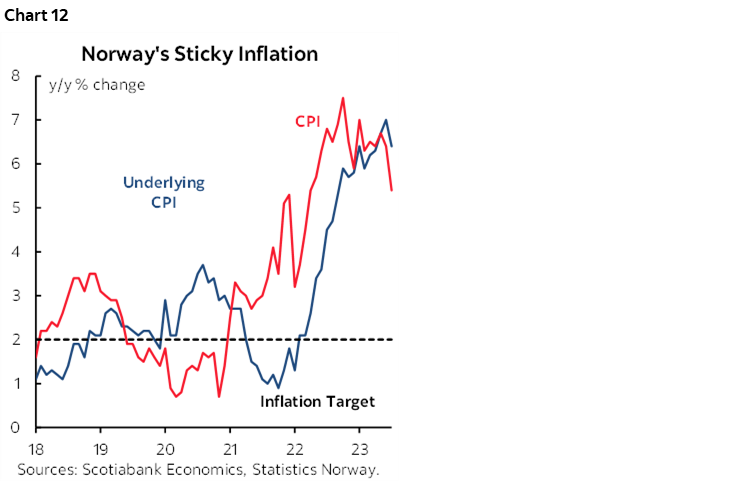
Apart from risks around the PBOC’s decision, other global central banks should be relatively calm during the week. Only Norges Bank (Thursday) is expected to deliver a hike of 25bps (Thursday) set against the backdrop of still hot inflation (chart 12). The RBNZ is on an extended hold and universally expected to keep its cash rate unchanged at 5.5% (Tuesday). Bangko Sentral ng Pilipinas is also expected to hold its overnight rate at 6.25% (Thursday). Minutes to the RBA’s August 1st meeting that held the policy rate at 4.1% are due on Monday evening (ET) but have been superseded by outgoing Governor Lowe’s parliamentary testimony that expressed high data dependence in determining whether to deliver future fine-tuning moves.
Canada will also update a few other activity readings throughout the week. Manufacturing shipments probably fell by -2% m/m in June based upon preliminary guidance from Statistics Canada (Tuesday). Existing home sales are coming off a five-month streak of gains from February through June with July’s update coming on Tuesday. Housing starts soared the month before due to volatile multiple housing units including condos, and July’s tally will probably come back down to earth (Wednesday). Wholesale trade has already been guided to land around 4% lower when June’s reading arrives on Wednesday.
US retail sales during July probably popped mildly higher (Tuesday). We know that vehicle sales volumes moved up a touch. Greater uncertainty surrounds core sales ex-autos and gas that are expected to post a mild nominal gain. Other US indicators will focus upon industrial activity including the start of the fresh round of monthly regional manufacturing gauges including the Empire measure (Tuesday) and the Philly Fed’s guide (Thursday). Industrial production is expected to register a mild overall gain (Wednesday). Housing starts are forecast to recapture some of June’s 8% m/m drop (Wednesday).
Right after the PBOC decision on Monday evening (ET), China will update several activity readings that will inform Q3 GDP growth including retail sales, industrial output, fixed investment and the jobless rate all for July.
GDP figures should continue to depict a resilient Japanese economy when Q2 estimates arrive on Monday night (ET). Another consecutive 0.7% q/q gain is expected. Colombia (Tuesday) and Chile (Friday) will refresh their figures that are expected to be soft. Malaysian GDP is also due for a Q2 refresh at the end of the week.
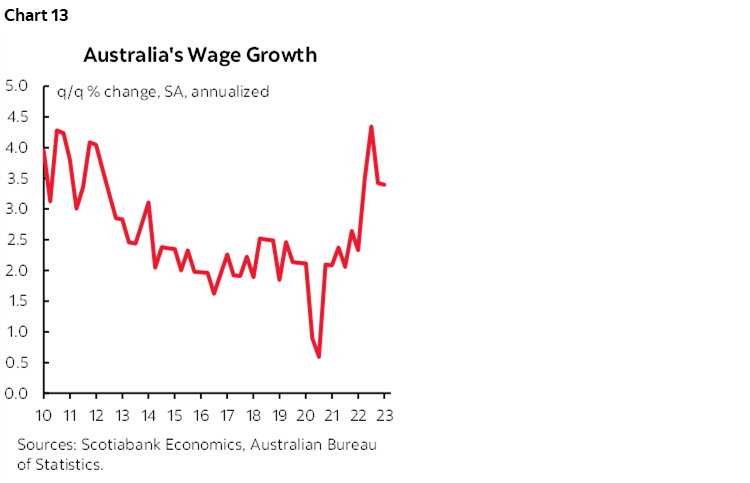
Can Australia record another employment gain when July figures are released on Wednesday evening (ET)? The market has been on fire with over 100k jobs created in the prior couple of months and a quarter million jobs so far this year. Employment is more than 1 million higher than pre-pandemic levels. What could overshadow jobs numbers will be the Q2 update for wage growth given the strong pattern to date (chart 13).
The UK job market has been no slouch either. Total job growth for June and payroll figures for July alongside wages in June arrive on Tuesday. Here too wage growth has been running at a strong clip of over 7% y/y. Also watch retail sales during July (Friday) given expectations for a significant decline in volumes.
DISCLAIMER
This report has been prepared by Scotiabank Economics as a resource for the clients of Scotiabank. Opinions, estimates and projections contained herein are our own as of the date hereof and are subject to change without notice. The information and opinions contained herein have been compiled or arrived at from sources believed reliable but no representation or warranty, express or implied, is made as to their accuracy or completeness. Neither Scotiabank nor any of its officers, directors, partners, employees or affiliates accepts any liability whatsoever for any direct or consequential loss arising from any use of this report or its contents.
These reports are provided to you for informational purposes only. This report is not, and is not constructed as, an offer to sell or solicitation of any offer to buy any financial instrument, nor shall this report be construed as an opinion as to whether you should enter into any swap or trading strategy involving a swap or any other transaction. The information contained in this report is not intended to be, and does not constitute, a recommendation of a swap or trading strategy involving a swap within the meaning of U.S. Commodity Futures Trading Commission Regulation 23.434 and Appendix A thereto. This material is not intended to be individually tailored to your needs or characteristics and should not be viewed as a “call to action” or suggestion that you enter into a swap or trading strategy involving a swap or any other transaction. Scotiabank may engage in transactions in a manner inconsistent with the views discussed this report and may have positions, or be in the process of acquiring or disposing of positions, referred to in this report.
Scotiabank, its affiliates and any of their respective officers, directors and employees may from time to time take positions in currencies, act as managers, co-managers or underwriters of a public offering or act as principals or agents, deal in, own or act as market makers or advisors, brokers or commercial and/or investment bankers in relation to securities or related derivatives. As a result of these actions, Scotiabank may receive remuneration. All Scotiabank products and services are subject to the terms of applicable agreements and local regulations. Officers, directors and employees of Scotiabank and its affiliates may serve as directors of corporations.
Any securities discussed in this report may not be suitable for all investors. Scotiabank recommends that investors independently evaluate any issuer and security discussed in this report, and consult with any advisors they deem necessary prior to making any investment.
This report and all information, opinions and conclusions contained in it are protected by copyright. This information may not be reproduced without the prior express written consent of Scotiabank.
™ Trademark of The Bank of Nova Scotia. Used under license, where applicable.
Scotiabank, together with “Global Banking and Markets”, is a marketing name for the global corporate and investment banking and capital markets businesses of The Bank of Nova Scotia and certain of its affiliates in the countries where they operate, including; Scotiabank Europe plc; Scotiabank (Ireland) Designated Activity Company; Scotiabank Inverlat S.A., Institución de Banca Múltiple, Grupo Financiero Scotiabank Inverlat, Scotia Inverlat Casa de Bolsa, S.A. de C.V., Grupo Financiero Scotiabank Inverlat, Scotia Inverlat Derivados S.A. de C.V. – all members of the Scotiabank group and authorized users of the Scotiabank mark. The Bank of Nova Scotia is incorporated in Canada with limited liability and is authorised and regulated by the Office of the Superintendent of Financial Institutions Canada. The Bank of Nova Scotia is authorized by the UK Prudential Regulation Authority and is subject to regulation by the UK Financial Conduct Authority and limited regulation by the UK Prudential Regulation Authority. Details about the extent of The Bank of Nova Scotia's regulation by the UK Prudential Regulation Authority are available from us on request. Scotiabank Europe plc is authorized by the UK Prudential Regulation Authority and regulated by the UK Financial Conduct Authority and the UK Prudential Regulation Authority.
Scotiabank Inverlat, S.A., Scotia Inverlat Casa de Bolsa, S.A. de C.V, Grupo Financiero Scotiabank Inverlat, and Scotia Inverlat Derivados, S.A. de C.V., are each authorized and regulated by the Mexican financial authorities.
Not all products and services are offered in all jurisdictions. Services described are available in jurisdictions where permitted by law.