

- The final fiscal numbers for FY26 came in better than previously projected for most provinces, leading to a better handoff for FY27.
- The FY27 Q1 fiscal updates revealed increases to projected deficits for some provinces, given continued economic headwinds and steady spending pressures, though the oil-producing provinces have seen their fiscal fortunes improve due to oil prices remaining elevated.
- Over the next couple of months, provinces will publish their mid-year fiscal updates, starting with Ontario tomorrow.
- Our latest economic and financial projections are broadly in line with most provinces’ growth assumptions in their Q1 updates, though we see scope for upgraded revenue forecasts in some provinces—especially the oil-producers.
- Pressures for new spending are continuing, including on core services like health as well as on new supports for industries impacted by the ongoing tariffs from the U.S. However, most provinces have built in prudence and/or contingency reserves into their fiscal frameworks to help offset at least part of the cost of new measures.
- As a result, we expect most provinces’ mid-year updates to their fiscal tracks to be directionally similar to their Q1 updates—with perhaps the biggest revisions coming from Ontario, which has recently announced large new measures that are likely to increase its projected deficits.
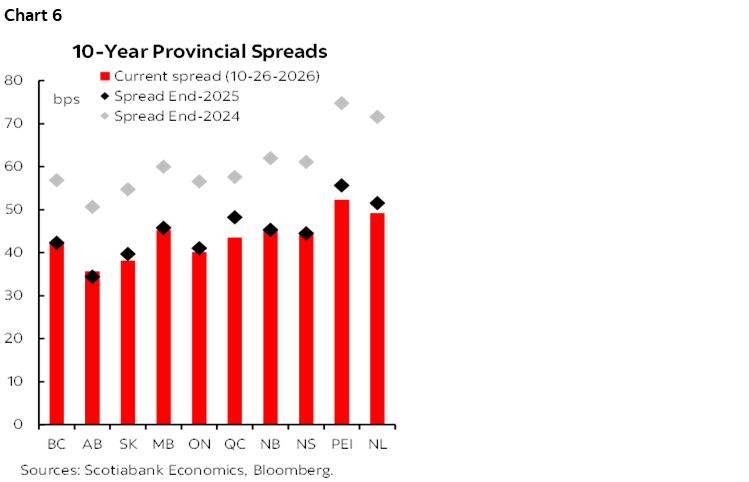
- Credit spreads have been quite stable over the course of the year, though Quebec and Prince Edward Island have seen some further tightening.
ROUND-UP OF FY26 PUBLIC ACCOUNTS AND FY27 Q1 UPDATES
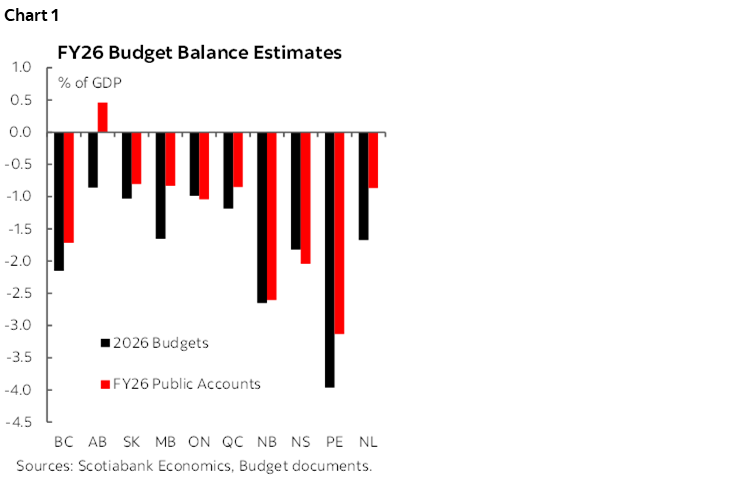
Most provinces overperformed their Budget 2026 estimates for FY26 (chart 1). Each province released its 2025–26 Public Accounts over the past few months, and eight provinces ended up with better budget balances than forecast in the Spring—in some cases quite considerably. Alberta, Manitoba, Prince Edward Island (PEI), and Newfoundland & Labrador (NFLD) all beat their Budget 2026 budget balance forecasts for FY26 by 0.8 percentage points of GDP or more, thanks to revenues coming in higher and spending plans coming in broadly on (or under) budget. Ontario and Nova Scotia were the two provinces that ended up with higher deficits––though not considerably larger ones. Despite its smaller-than-previously-forecast deficit, PEI registered the largest deficit as a share of GDP (around 3%), and Alberta was the lone province recording a budgetary surplus for last year.
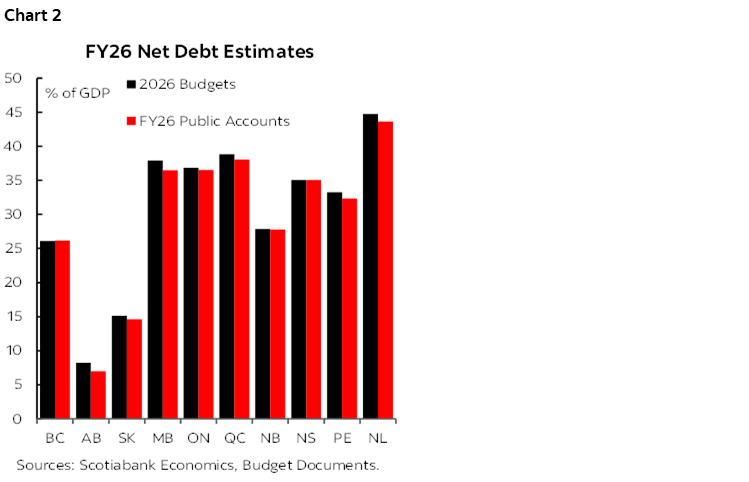
Net debt estimates for FY26 were also mostly better (chart 2). The overperformance on budget balances combined with some upward revisions to nominal GDP growth expectations has meant that most provinces ended FY26 with a slightly lower debt burden than previously expected. These better handoffs will help lower the projected debt paths going forward (all else equal). The overall previous debt burden rankings are broadly unchanged, with NFLD highest (43.6% of GDP) and Alberta lowest (7% of GDP).
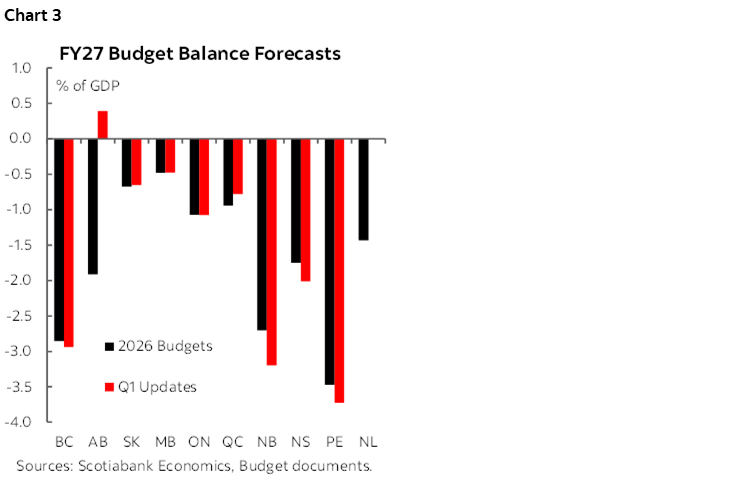
The Q1 fiscal updates showed mixed changes to outlooks for FY27 (chart 3). Nine provinces (all but NFLD) have released updated fiscal estimates for FY27 since their Spring budgets. While changes to projected budget balances are typically quite limited after only one quarter, most provinces have already revised their projections––in some cases fairly substantially. Alberta has flipped from projecting a $9.4B deficit to a $2B surplus, driven by the higher-for-longer oil prices. NFLD has not released updated numbers, but its finance minister has confirmed that the still-high oil prices have also improved its revenue forecasts—and has indicated that the government will use 80% of the windfalls to reduce its deficit/debt. On the flip side, B.C. and the Maritime provinces have increased their projected deficits for this year, driven mainly by increases to planned health spending.
ECONOMIC PROSPECTS HAVE DIVERGED, WITH CONSEQUENCES FOR PROV REVENUES
The shocks facing Canada have become less uniform, especially with the increase in energy prices that has strong benefits for a few provinces. While the slowdown in population growth is broadly similar across Canada, the burden from U.S. tariffs is increasingly different across provinces. The new tariffs in September further increased the elevated effective tariff rates facing the most tariff-exposed provinces, including B.C., Ontario, and Quebec. In addition, oil prices remain fairly elevated––boosting income and incentivizing increased oil production in the oil-producing provinces.
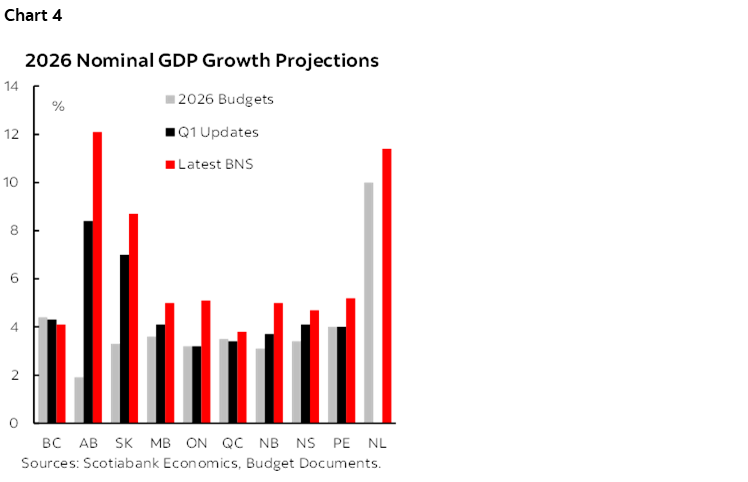
Provincial growth assumptions could further diverge (chart 4). Many provinces revised lower their assumptions for 2026 real GDP growth in their Q1 updates, though upward revisions to GDP inflation expectations led to only B.C. and Quebec revising lower their expectations for growth in nominal GDP––the best broad measure of the tax base. Nominal GDP growth expectations have generally strengthened further in recent months, so we expect to see some further increases in projected nominal GDP growth. We see particularly high scope for nominal GDP growth to be revised higher in the oil-producing provinces, where still-high oil prices should lead to higher energy revenues. If Alberta increases its assumed FY27 average WTI oil price from the US$73.50 in its Q1 update to US$80 in its mid-year update, this would boost its revenue forecast for this year by $4–5B. Our latest forecast is for WTI to average US$89 in FY27.
NEW MEASURES WILL FURTHER INCREASE SOME DEFICITS
Some provinces have already announced new spending or tax measures that could increase deficit projections and borrowing requirements compared to Budget and/or Q1 updates, and further could follow in the mid-year updates. For example:
- B.C.’s incoming government has committed as one of its first actions to increase the standard personal exemption to $32,000 starting in 2027—which has an estimated fiscal cost of $0.7B for this fiscal year and $2.9B in future years.
- Manitoba has announced more than $100M in targeted supports in response to the U.S. tariffs announced in August.
- Ontario has recently announced that it will adopt the federal government’s Mega Deduction to help incentivize new business investment, at a cost of $8B over five years. Ontario also announced in its 2026 budget that it would adopt the federal Productivity Super-Deduction, but the associated $3.5B cost was not included in the fiscal projections at that time because the federal legislation was still pending. Other major announcements since the spring budget include $2.7B in financing assistance for the steel and auto sectors through a joint federal-provincial action plan, as well as new funding related to Toronto housing shelters and First Nations emergency preparedness.
- Nova Scotia has reinstated around $50M in cuts to spending that it had announced in its 2026 budget.
- NFLD has recently announced a series of measures to improve affordability, including cuts to electricity bills, an increase of the home heating supplement, and cut to provincial gasoline and diesel taxes.
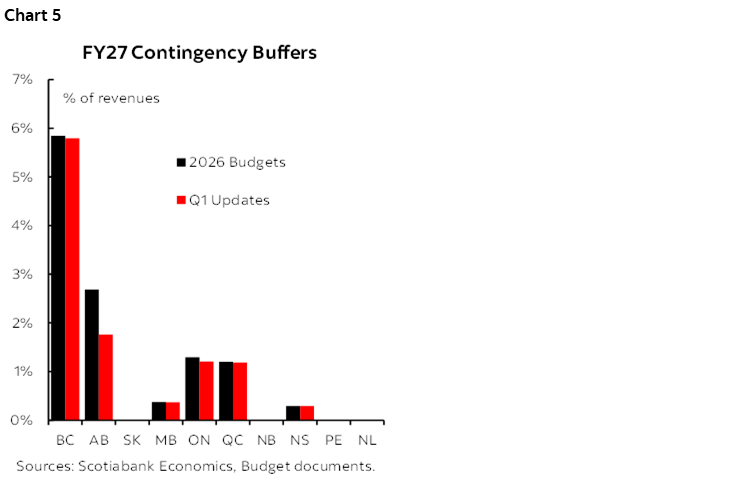
Provinces will likely use some of their existing budget envelopes or forecast buffers to offset the cost of new measures (chart 5). Many provinces continued the practice of setting aside considerable contingency funds in their Spring budgets to protect against lower revenues and/or new spending pressures. As we get deeper into the fiscal year, it is normal to use some of these buffers to help offset the cost of new measures. For example, Ontario reduced its FY27 contingency envelope by $200M in its Q1 update, which reduced the increase in its planned FY27 spending to $140M, and the province has a considerable amount remaining ($2.8B) that it can draw down to help mitigate the incremental fiscal cost of new measures.
PROVINCIAL SPREADS BROADLY STABLE
Provincial spreads (10-year) are mostly in line with end-2025 levels (chart 6). However, some provinces have seen some further tightening, including Quebec and PEI. There have not been any credit further provincial credit rating changes over the past six months, following a number of rating and outlook changes in 2025 and early 2026.
DISCLAIMER
This report has been prepared by Scotiabank Economics as a resource for the clients of Scotiabank. Opinions, estimates and projections contained herein are our own as of the date hereof and are subject to change without notice. The information and opinions contained herein have been compiled or arrived at from sources believed reliable but no representation or warranty, express or implied, is made as to their accuracy or completeness. Neither Scotiabank nor any of its officers, directors, partners, employees or affiliates accepts any liability whatsoever for any direct or consequential loss arising from any use of this report or its contents.
These reports are provided to you for informational purposes only. This report is not, and is not constructed as, an offer to sell or solicitation of any offer to buy any financial instrument, nor shall this report be construed as an opinion as to whether you should enter into any swap or trading strategy involving a swap or any other transaction. The information contained in this report is not intended to be, and does not constitute, a recommendation of a swap or trading strategy involving a swap within the meaning of U.S. Commodity Futures Trading Commission Regulation 23.434 and Appendix A thereto. This material is not intended to be individually tailored to your needs or characteristics and should not be viewed as a “call to action” or suggestion that you enter into a swap or trading strategy involving a swap or any other transaction. Scotiabank may engage in transactions in a manner inconsistent with the views discussed this report and may have positions, or be in the process of acquiring or disposing of positions, referred to in this report.
Scotiabank, its affiliates and any of their respective officers, directors and employees may from time to time take positions in currencies, act as managers, co-managers or underwriters of a public offering or act as principals or agents, deal in, own or act as market makers or advisors, brokers or commercial and/or investment bankers in relation to securities or related derivatives. As a result of these actions, Scotiabank may receive remuneration. All Scotiabank products and services are subject to the terms of applicable agreements and local regulations. Officers, directors and employees of Scotiabank and its affiliates may serve as directors of corporations.
Any securities discussed in this report may not be suitable for all investors. Scotiabank recommends that investors independently evaluate any issuer and security discussed in this report, and consult with any advisors they deem necessary prior to making any investment.
This report and all information, opinions and conclusions contained in it are protected by copyright. This information may not be reproduced without the prior express written consent of Scotiabank.
™ Trademark of The Bank of Nova Scotia. Used under license, where applicable.
Scotiabank, together with “Global Banking and Markets”, is a marketing name for the global corporate and investment banking and capital markets businesses of The Bank of Nova Scotia and certain of its affiliates in the countries where they operate, including; Scotiabank Europe plc; Scotiabank (Ireland) Designated Activity Company; Scotiabank Inverlat S.A., Institución de Banca Múltiple, Grupo Financiero Scotiabank Inverlat, Scotia Inverlat Casa de Bolsa, S.A. de C.V., Grupo Financiero Scotiabank Inverlat, Scotia Inverlat Derivados S.A. de C.V. – all members of the Scotiabank group and authorized users of the Scotiabank mark. The Bank of Nova Scotia is incorporated in Canada with limited liability and is authorised and regulated by the Office of the Superintendent of Financial Institutions Canada. The Bank of Nova Scotia is authorized by the UK Prudential Regulation Authority and is subject to regulation by the UK Financial Conduct Authority and limited regulation by the UK Prudential Regulation Authority. Details about the extent of The Bank of Nova Scotia's regulation by the UK Prudential Regulation Authority are available from us on request. Scotiabank Europe plc is authorized by the UK Prudential Regulation Authority and regulated by the UK Financial Conduct Authority and the UK Prudential Regulation Authority.
Scotiabank Inverlat, S.A., Scotia Inverlat Casa de Bolsa, S.A. de C.V, Grupo Financiero Scotiabank Inverlat, and Scotia Inverlat Derivados, S.A. de C.V., are each authorized and regulated by the Mexican financial authorities.
Not all products and services are offered in all jurisdictions. Services described are available in jurisdictions where permitted by law.