- Provincial governments had the difficult task of finalizing their annual budgets just as the U.S. was starting a global trade war. Each made different assumptions about the economic and fiscal impacts of the trade war, and many built in contingencies into their fiscal frameworks to buffer against trade war impacts.
- Taken together, the provincial budgets’ baseline scenarios project the aggregate provincial deficit to rise from $20.6 bn (0.7% of nominal GDP) in FY25 to $44.9 bn (1.4% of GDP) in FY26 (chart 1).
- This reflects a worsened revenue outlook due to the deteriorated economic outlook, combined with continued operational and capital spending growth, as well as substantial increases to contingency reserves. New tax or spending measures were generally relatively minor, reflecting the challenging economic and fiscal situations facing provincial governments.
- Provinces’ borrowing requirements are expected to remain elevated at roughly $138 bn in FY26, somewhat lower than the $147 bn recorded in FY25 but still substantially more than the $112 bn raised in FY24. This reflects the higher operational deficits and rising capital spending in most provinces.
- Aggregate net debt as a share of GDP is projected to increase from 29.6% in FY25 to 33.2% by FY28 (chart 2), with the largest increases expected in British Columbia (B.C.), Nova Scotia, and Prince Edward Island. Aggregate debt service as a share of revenues will rise from 6.2% to 6.4% in FY26.
- The provinces’ fiscal outlooks face risks from the ongoing U.S. trade war. Using our latest provincial economic growth projections instead of the economic growth assumed in each budget, we estimate that there could be revenue shortfalls, but within the contingency buffers set aside by most provinces.
- However, in a more negative economic scenario, combined with an increase in spending by provinces, contingency buffers could be overwhelmed in most provinces.
- While most provinces maintain relatively sound fiscal positions, given the deteriorated fiscal outlook and residual downside risks, a number of provinces have seen credit rating or outlook downgrades in the last month, and more downgrades could follow.
- As impacts from the trade war and associated uncertainty gradually subside in the medium term, fiscal outlooks should improve, especially if provinces can deliver on promised spending restraint over the medium-term.

DETERIORATION ACROSS THE BOARD
With the incipient U.S. trade war weakening the economic outlook, provincial governments downgraded their expectations for near-term economic growth. While the provinces released their budgets at different point in the U.S. global trade war, and made different assumptions about the duration and impacts of the conflict, essentially all provinces downgraded their expectations for economic growth. The downward revisions were greatest in Newfoundland and Labrador, Prince Edward Island, Alberta, and Ontario (chart 3).

Revenues are expected to be lower than previously expected, reflecting the weaker economic outlook as well as some tax cuts. Despite revenues ending up stronger in FY25 than initially expected, the worsened economic outlook has led to lower expected near-term revenues. In addition, some provinces have announced new tax cuts, which further weigh on the revenue outlook. Most notably, Alberta and Nova Scotia implemented personal income tax cuts.
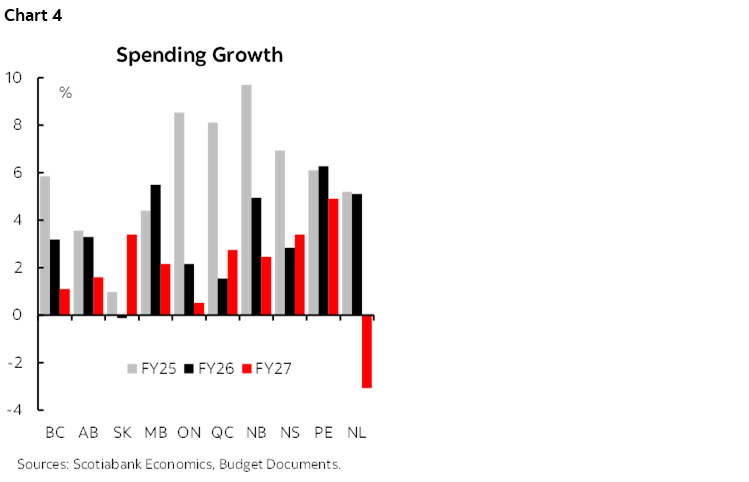
Spending is projected to rise further after a significant increase in the year just ended. Aggregate provincial spending growth was a robust 5.4% in FY25, led by 9.7% in B.C. and 8.1% in Quebec. Provincial spending is forecast to increase a further 2.8% in FY26 and 2.6% in FY27 on aggregate, but with considerable differences across provinces (chart 4). Saskatchewan is planning to reduce spending in FY26, and Newfoundland and Labrador is forecasting lower spending in both FY27 and FY28. In contrast, spending in Prince Edward Island is forecast to increase by a further 6.3% this year and 4.9% next year.
In addition, many provinces have prudently established or increased contingency buffers to protect against downside fiscal risks. Such risks could include revenue shortfalls from weaker-than-expected economic growth and/or increased spending for program to support workers and businesses impacted by the U.S. global tariff war. B.C. and Alberta lead the pack, by setting aside amounts equivalent to roughly 5% of revenues for each of the next two years (chart 5).

The aggregate provincial balance is expected to drop from -$20.7 bn in FY25 to -$44.9 bn in FY26 before improving to -$20.0 bn in FY27. The latest projected aggregate FY26 deficit is roughly $24 bn larger compared to FY26 projections in last year’s provincial budgets. While Alberta and Nova Scotia recorded surpluses in FY25, all provinces expect to record deficits in FY26, and all but Saskatchewan and Newfoundland and Labrador are also projecting deficits for FY27 (chart 6).

This would imply that the aggregate provincial deficit will peak at 1.4% of GDP in FY26. This is a deterioration from the 0.7%-of-GDP deficit estimated for FY25, but substantially lower than the provincial deficits recorded in FY21 during the pandemic.
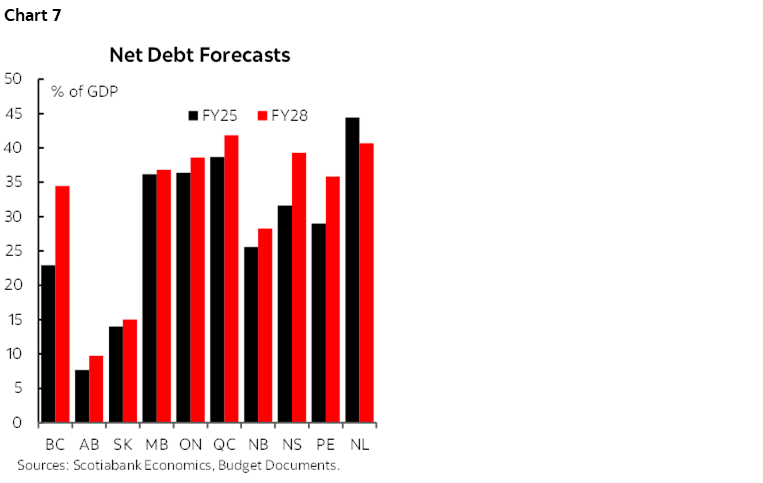
Net debt is projected to increase in most provinces. With the exception of Newfoundland and Labrador, which is expecting strong revenue growth related to hydroelectricity, all provinces are forecasting that their net debt will increase in the coming years (chart 7). The sharpest projected increases are by B.C., Nova Scotia, and Prince Edward Island. In aggregate, the provinces are projecting that their net debt burden will increase from 29.5% in FY25 to 33.2% by FY28, though this includes considerable variability across provinces. Alberta and Saskatchewan are projecting to keep net debt below 15% of GDP, whereas Quebec, Newfoundland and Labrador, Nova Scotia, Ontario, and Manitoba are expecting to have burdens above 35% of GDP by FY28.
Aggregate debt service as a share of revenues is projected to tick up from 6.2% to 6.4% in FY26. This is less than half of the peak provincial interest burden experienced in the mid-90s, despite the current aggregate provincial debt burden being similar to the level at that time. This reflects the lower interest rate environment over the past decade. However, as debt with higher interest rates replaces lower-rate, pandemic-era debt, debt charges will become more costly—especially for those provinces with higher deficits. B.C., for example, is forecasting that its public debt charges as a share of revenues will increase from 3.3% in FY23 to 8.2% by FY28.
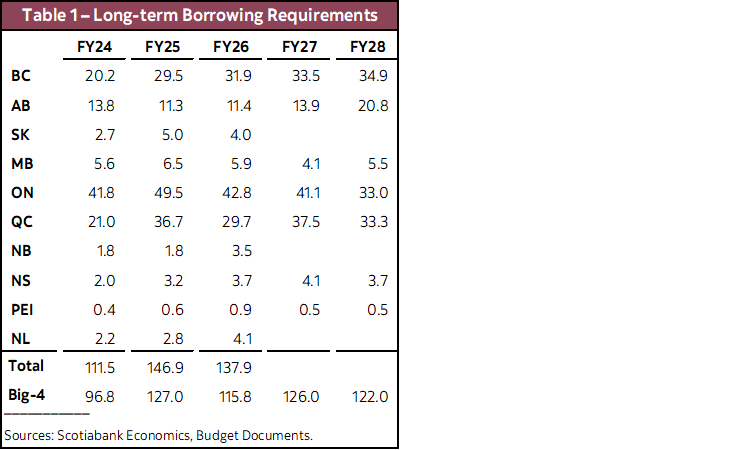
Provincial borrowing is projected to remain elevated at $138 bn in FY26. This is somewhat lower than the $147 bn raised last year, but still substantially more than the $112 bn raised in FY24. In addition, long-term borrowing forecasts by the four largest provinces suggest that issuance will increase again in FY27 (table 1). Increased supply could put upward pressure on provincial spreads, particularly for the provinces that are experiencing the largest bottom-line deteriorations. A number of provinces have seen credit rating (or outlook) downgrades in the past weeks, and more could follow. That said, to date spreads have been fairly stable, with most provinces’ spreads 5–7 basis points wider since the end of 2024, and remain below their pre-COVID averages (chart 8). This indicates that the new provincial fiscal forecasts have not led to markets significantly repricing provincial credit risks. This stability could partially reflect the large contingencies built into many budgets, which could ultimately result in provinces recording better fiscal performances than forecasted.

STRESS-TESTING BUDGET FORECASTS AGAINST DOWNSIDE RISKS
The different provincial budgets used different economic outlooks, with some taking an average of private sector forecasters, and others using other assumptions. In addition, each budget was formulated and released at a different time, during a period where there was very significant fluidity in the economic outlook—not to mention the very significant differences in contingency buffers across the different budgets. As a result, comparing each published provincial fiscal forecast is not exactly an apples-to-apples comparison.
To approximate as best we can a fair comparison across the provincial budgets, we can adjust the forecasts to be in line with our latest in-house provincial economic forecast. We can use the close relationship in most years between growth in own-source provincial revenues (i.e., provincial revenues excluding transfers from the federal government) and growth in nominal GDP (chart 9) to roughly approximate how revenue forecasts would change under the economic growth anticipated in our latest forecast, and then compare the differences to the contingency buffers set aside.

Our latest provincial forecast (which is more recent than the forecasts in most of the provincial budgets) anticipates lower growth than assumed by many of the provinces in their budgets, especially in 2026 (chart 10). Using our latest provincial economic growth projections instead of the economic growth assumed in each budget, we estimate that provinces with contingency buffers will be able to absorb revenue shortfalls (chart 11).

That said, the economy could deteriorate more than we have projected in our April forecast, and provinces could respond with new discretionary spending in the form of supports for impacted workers and businesses, or increases in infrastructure spending. In a weaker economic scenario—taking an additional one percentage point off of growth in each province in both 2025 and 2026—combined with an extra one percentage point increase in spending growth in both FY26 and FY27, our rule-of-thumb approach indicates that the current contingency amounts would not be sufficient in most provinces (chart 12).

DISCLAIMER
This report has been prepared by Scotiabank Economics as a resource for the clients of Scotiabank. Opinions, estimates and projections contained herein are our own as of the date hereof and are subject to change without notice. The information and opinions contained herein have been compiled or arrived at from sources believed reliable but no representation or warranty, express or implied, is made as to their accuracy or completeness. Neither Scotiabank nor any of its officers, directors, partners, employees or affiliates accepts any liability whatsoever for any direct or consequential loss arising from any use of this report or its contents.
These reports are provided to you for informational purposes only. This report is not, and is not constructed as, an offer to sell or solicitation of any offer to buy any financial instrument, nor shall this report be construed as an opinion as to whether you should enter into any swap or trading strategy involving a swap or any other transaction. The information contained in this report is not intended to be, and does not constitute, a recommendation of a swap or trading strategy involving a swap within the meaning of U.S. Commodity Futures Trading Commission Regulation 23.434 and Appendix A thereto. This material is not intended to be individually tailored to your needs or characteristics and should not be viewed as a “call to action” or suggestion that you enter into a swap or trading strategy involving a swap or any other transaction. Scotiabank may engage in transactions in a manner inconsistent with the views discussed this report and may have positions, or be in the process of acquiring or disposing of positions, referred to in this report.
Scotiabank, its affiliates and any of their respective officers, directors and employees may from time to time take positions in currencies, act as managers, co-managers or underwriters of a public offering or act as principals or agents, deal in, own or act as market makers or advisors, brokers or commercial and/or investment bankers in relation to securities or related derivatives. As a result of these actions, Scotiabank may receive remuneration. All Scotiabank products and services are subject to the terms of applicable agreements and local regulations. Officers, directors and employees of Scotiabank and its affiliates may serve as directors of corporations.
Any securities discussed in this report may not be suitable for all investors. Scotiabank recommends that investors independently evaluate any issuer and security discussed in this report, and consult with any advisors they deem necessary prior to making any investment.
This report and all information, opinions and conclusions contained in it are protected by copyright. This information may not be reproduced without the prior express written consent of Scotiabank.
™ Trademark of The Bank of Nova Scotia. Used under license, where applicable.
Scotiabank, together with “Global Banking and Markets”, is a marketing name for the global corporate and investment banking and capital markets businesses of The Bank of Nova Scotia and certain of its affiliates in the countries where they operate, including; Scotiabank Europe plc; Scotiabank (Ireland) Designated Activity Company; Scotiabank Inverlat S.A., Institución de Banca Múltiple, Grupo Financiero Scotiabank Inverlat, Scotia Inverlat Casa de Bolsa, S.A. de C.V., Grupo Financiero Scotiabank Inverlat, Scotia Inverlat Derivados S.A. de C.V. – all members of the Scotiabank group and authorized users of the Scotiabank mark. The Bank of Nova Scotia is incorporated in Canada with limited liability and is authorised and regulated by the Office of the Superintendent of Financial Institutions Canada. The Bank of Nova Scotia is authorized by the UK Prudential Regulation Authority and is subject to regulation by the UK Financial Conduct Authority and limited regulation by the UK Prudential Regulation Authority. Details about the extent of The Bank of Nova Scotia's regulation by the UK Prudential Regulation Authority are available from us on request. Scotiabank Europe plc is authorized by the UK Prudential Regulation Authority and regulated by the UK Financial Conduct Authority and the UK Prudential Regulation Authority.
Scotiabank Inverlat, S.A., Scotia Inverlat Casa de Bolsa, S.A. de C.V, Grupo Financiero Scotiabank Inverlat, and Scotia Inverlat Derivados, S.A. de C.V., are each authorized and regulated by the Mexican financial authorities.
Not all products and services are offered in all jurisdictions. Services described are available in jurisdictions where permitted by law.