- Core inflation measures lit up again, thwarting a short-lived soft patch
- Varied forward-looking risks still point to upside risks to inflation
- The debate should be more about hike risk than the mistake of prematurely easing
- The BoC will require a lot more data before deciding on what to do next
- Canada’s torrid rate of population growth is adding to inflationary pressures
- Canadian CPI m/m % NSA // y/y %, November:
- Actual: 0.1 / 3.1
- Scotia: -0.2 / 2.8
- Consensus: -0.1 / 2.9
- Prior: 0.1 / 3.1
- Trimmed mean CPI: 3.6% m/m SAAR // 3.5% y/y
- Weighted median CPI: 3.5% m/m SAAR // 3.4% y/y
Sorry but I just can’t hop on the bandwagon. In my professional opinion, November’s core inflation readings leaned more toward continued hike risk than toward market pricing for a cut by March/April that would be a major policy error right into the thick of the Spring housing market and Winter government budget season. For now, however, this is short-term data noise for a central bank that is saying it wants a lot of data before doing much of anything.
Markets reacted by driving a half penny appreciation in the C$ relative to the USD, pushing the Canada 2-year yield up 5bps post data to reverse the earlier BoJ-induced rally, and trimming March cut pricing by about 5bps and shaving a little off April cut pricing. Markets are still attaching significant probability to a March cut and are fully pricing a cut by April.
Key are the core measures that all lit up again as shown in chart 1 for trimmed mean and weighted median CPI and chart 2 for traditional core CPI ex-food and energy. Here is a broader set of figures for core inflation:
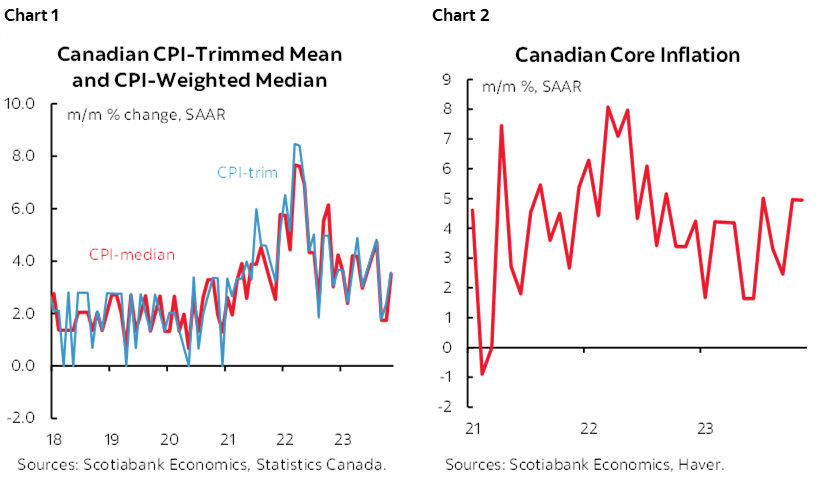
- Trimmed mean CPI was up by 3.6% m/m SAAR in November;
- Weighted median CPI was up by 3.5% m/m SAAR in November;
- Traditional core CPI ex-food and energy was up by 4.9% m/m SAAR;
- CPI excluding the 8 most volatile items was up 4% /m SAAR;
- CPIX was up 4% m/m SAAR.
These are all far too warm for the BoC’s liking. The readings are volatile. While one or two months of a soft patch don’t determine a trend, neither does a month of renewed acceleration in November.
Nevertheless, at the margin, the latest inflation data suggests that the prior couple of months might have simply been yet another false dawn for sustainably getting inflation toward the 2% target.
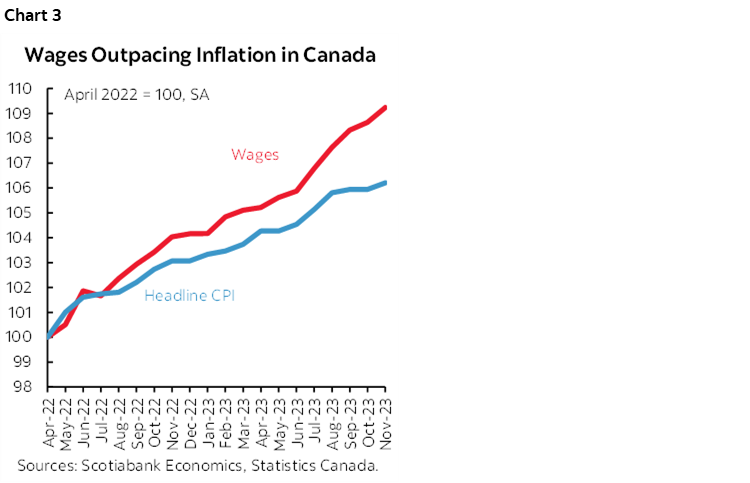
And why would you expect anything but persistent upside risk to inflation Canada?
- Wages are absurdly hot in relation to inflation (chart 3) and tumbling labour productivity with one-third of the workforce that is unionized cementing strong wage gains for years to come.
- 430k jobs have been created so far this year despite all of the gloom.
- Will there be mass job shedding going forward? One out of two of the jobs created since the start of the pandemic are not going away because they’re all in the public sector absent austerity measures. Labour hording is a common theme in the private sector.
- Immigration is excessive full stop. Canada just added about 431k people in Q3 alone (here). That’s like presto, here’s a new city of London, Ontario created in one quarter. Or almost a new City of Hamilton. A 1.1% q/q nonannualized increase in population in one quarter. Statcan noted that even just the first 9 months of this year exceeded population growth for any other year since Confederation in 1867. In percentage terms, q/q population growth of 1.1% was the fastest since 1957. Population growth is now at 3.2% y/y and the fastest of any peer group major industrialized nation by far. Population has increased by 1.25 million people in just one year and population is 2.29 million higher than two years ago in a country that started with just 38.2 million folks at the time and now has 40.5.
- The problem remains that there is little to no housing available for them and it’s only going to get worse. Ditto for N.A. auto inventories and with the retail inventories to sales ratio having come off the depressed bottom during the pandemic to a still lean pre-pandemic level. Ditto for inadequate infrastructure in transportation, in health care services, etc. That connotes capacity pressures upon infrastructure and concomitant funding and price pressures over time.
- Surveys of inflation expectations remain above the BoC’s inflation target for years to come pending January’s updated surveys.
- CAD is undervalued.
- Fiscal stimulus is ongoing and ages past any such requirements with the threat of more to come as governments re-issue forecasts that tamp down interest expense projections. Why? Because financial market conditions are prematurely easing in my view with the 5-year GoC yield at 3.25% down 115bps since Fall and pricing a full cycle’s worth of rate cuts down to little term premium over neutral rate assumptions. With an election looming by October 2025 and the current government down in the polls, it’s probably rather unlikely they’ll tuck aside any reduced projections for interest expense instead of spending it on other things.
Yeah. Throw rate cuts on top of that at a central bank that can’t forecast inflation to save itself despite its bold commitment to its forecasts. You’ll never cut again afterward or you’ll have to chase inflation higher all over again and lose further credibility as a central bank if cuts are delivered too early and too powerfully. The key message here is to cast aside past cycles and understand the idiosyncratic risks to Canada.
DETAILS
What drove it? As in the US, the source of the pressure is on the services side of the picture. Goods price inflation played a role as less of a drag as shown in chart 4, but it was services inflation that lit things up last month (chart 5).
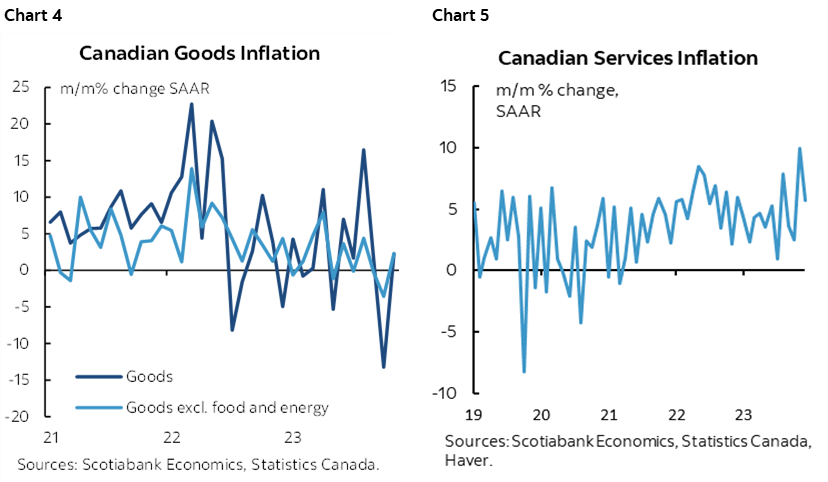
Service prices were up by 5.7% m/m SAAR in November following a 10% m/m SAAR gain in October and with a 3-month moving average of 6.1% m/m SAAR. This continues to reflect the rotation of the drivers of inflation toward the services economy. If that doesn’t cool down, then it could be joined by renewed goods inflation over the coming year as recent softness in goods price inflation stabilizes in the wake of coming off the boil from the goods shortages earlier in the pandemic.
There was also high breadth to the readings. Among the major categories were the following m/m seasonally adjusted gains:
- Recreation, education/reading 0.7%
- Shelter 0.5%
- Clothing and footwear 0.4%
- Food 0.2%
- household ops/furnishings/equip 0%
- Transportation 0.2%
- Health and personal care 0.1%
What drove services higher?
- Rent +0.41% m/m NSA, normally 0.24% in Nov in recent years
- Airfare was up 1.1% m/m NSA, normally -1.2%;
- Auto insurance was up another 0.94% m/m NSA, normally 0.5%;
- Health care 0.14%, normally 0.07%;
- Electricity 0.7%, normally 0.2.
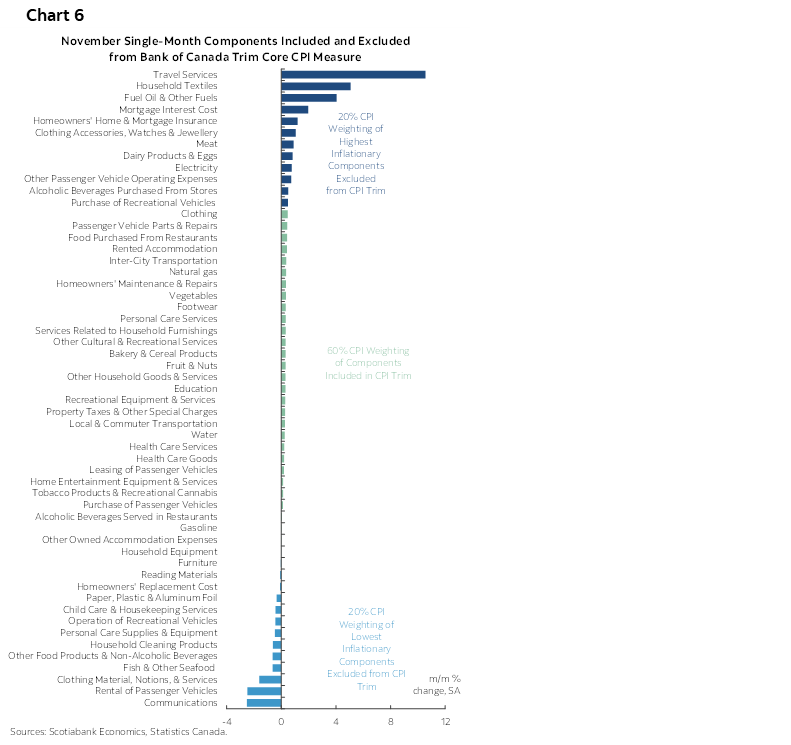
Recall that while mortgage interest was up by 1.9% m/m NSA and remains hot, it isn't even captured in the trimmed mean and weighted median measures that the BoC uses to operationalize achievement of its 2% headline target. Mortgage interest is included in total CPI, but not the measures the BoC focuses upon as gauges of underlying price pressures. In fact, mortgage interest has never been included in trimmed mean and weighted median CPI throughout the entire rate hike cycle. Chart 6 provides the latest evidence on this matter.
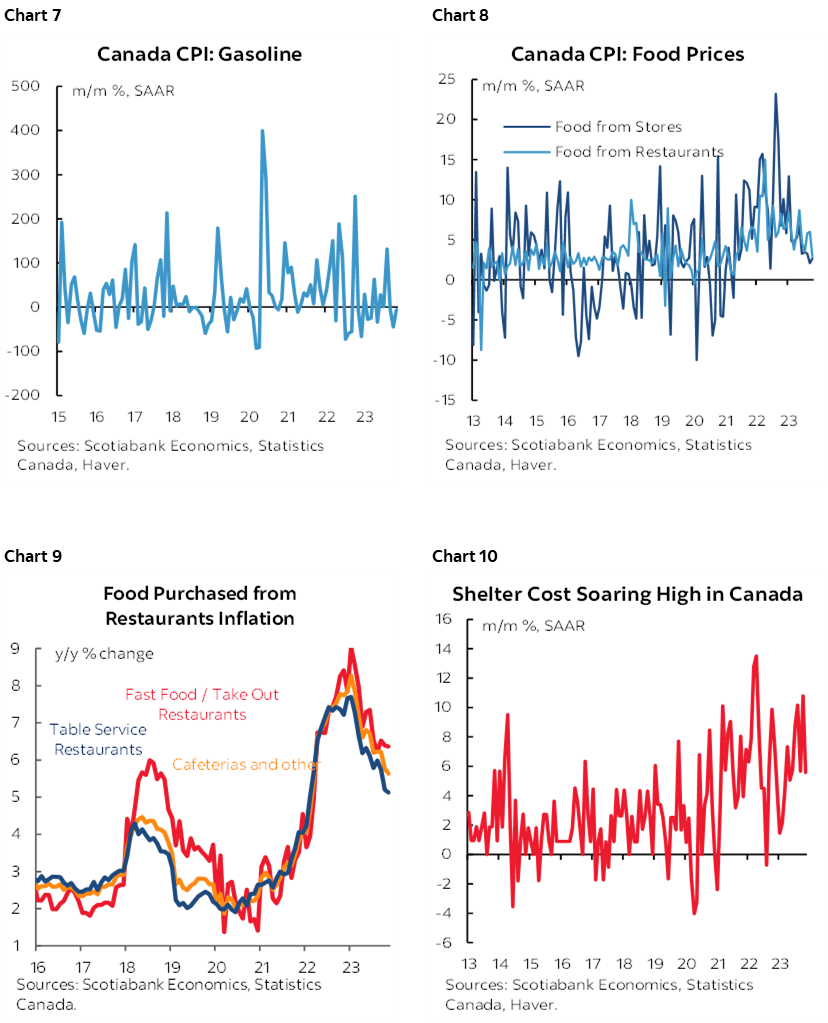
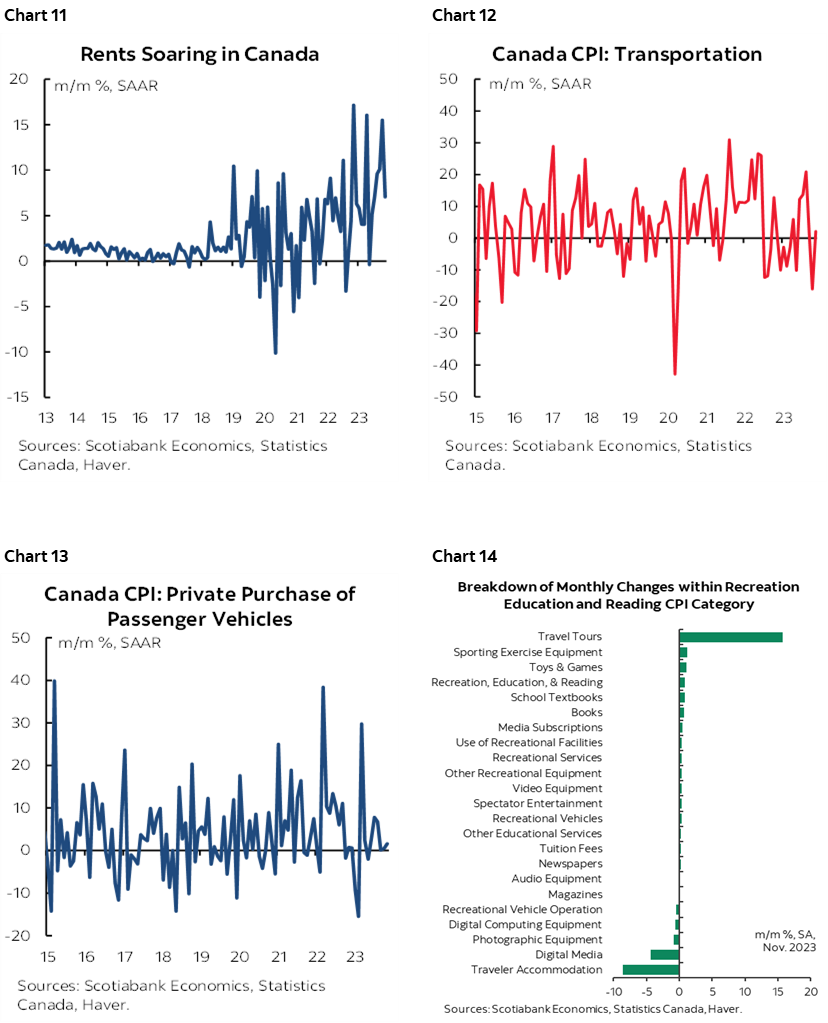
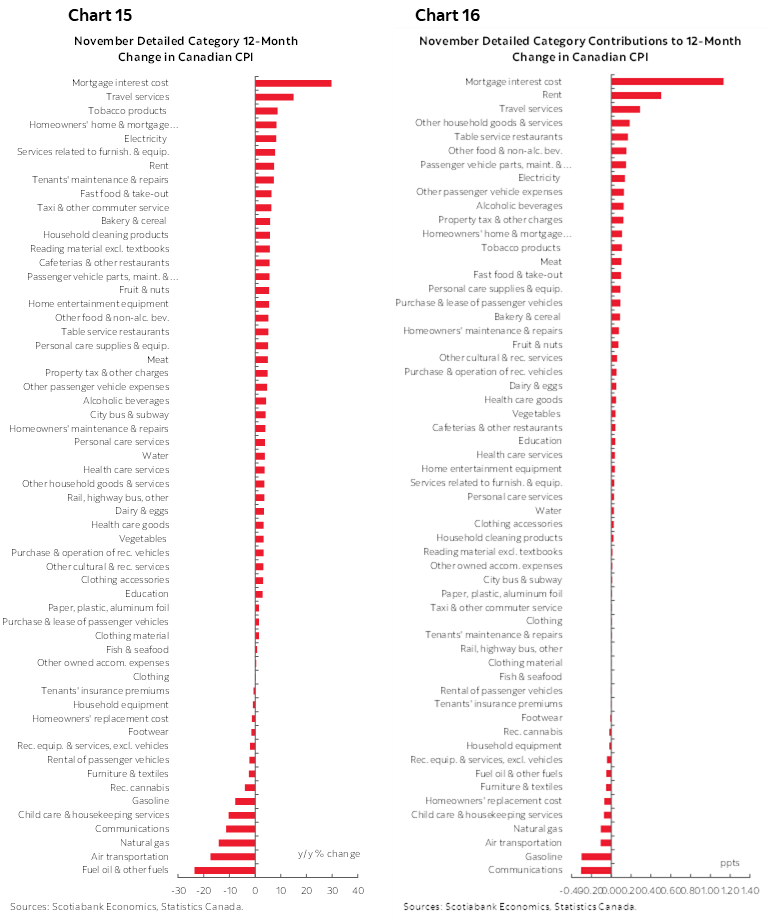
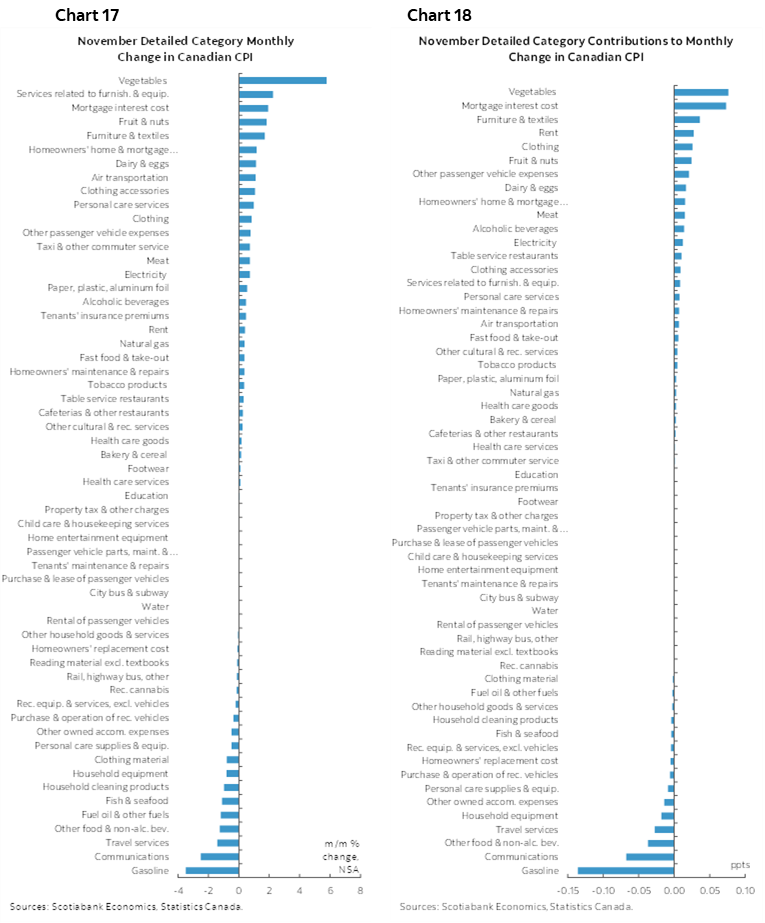
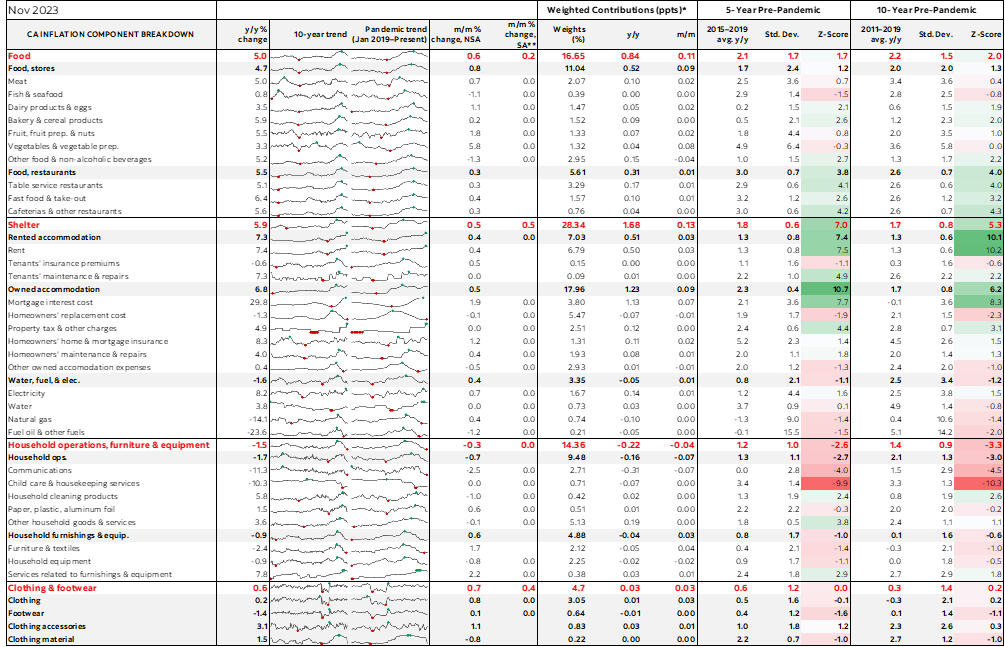
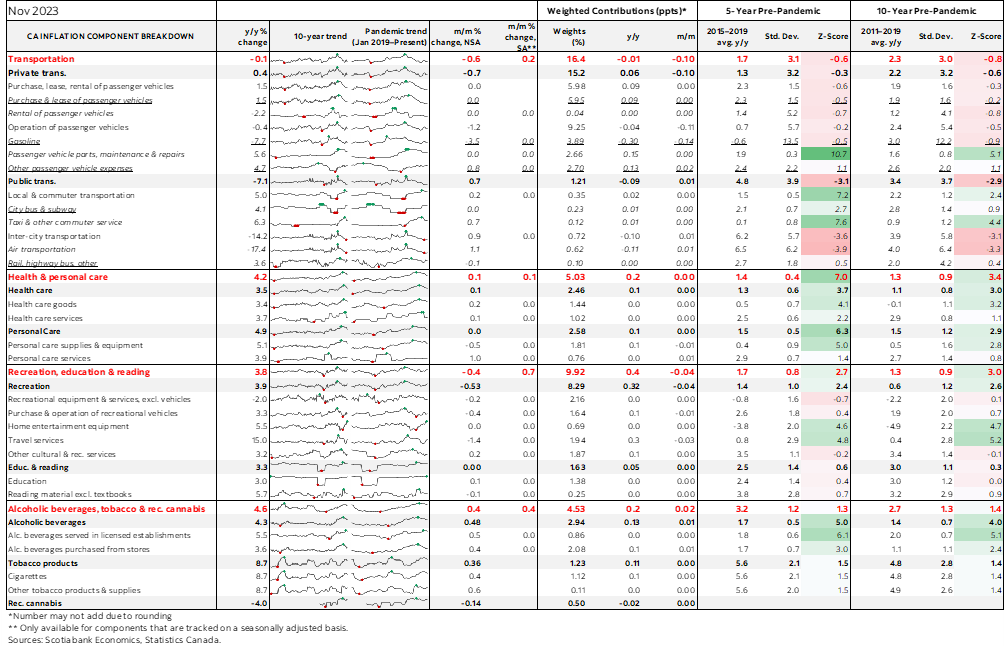
Charts 7–14 break down select components. Charts 15–16 break down the CPI basket in y/y % change terms and in terms of weighted contributions to y/y CPI inflation. Charts 17–18 show the same things in m/m terms.
The table on the final page shows a detailed table by component including micro charts and z-score measures of deviations from norms by component.
DISCLAIMER
This report has been prepared by Scotiabank Economics as a resource for the clients of Scotiabank. Opinions, estimates and projections contained herein are our own as of the date hereof and are subject to change without notice. The information and opinions contained herein have been compiled or arrived at from sources believed reliable but no representation or warranty, express or implied, is made as to their accuracy or completeness. Neither Scotiabank nor any of its officers, directors, partners, employees or affiliates accepts any liability whatsoever for any direct or consequential loss arising from any use of this report or its contents.
These reports are provided to you for informational purposes only. This report is not, and is not constructed as, an offer to sell or solicitation of any offer to buy any financial instrument, nor shall this report be construed as an opinion as to whether you should enter into any swap or trading strategy involving a swap or any other transaction. The information contained in this report is not intended to be, and does not constitute, a recommendation of a swap or trading strategy involving a swap within the meaning of U.S. Commodity Futures Trading Commission Regulation 23.434 and Appendix A thereto. This material is not intended to be individually tailored to your needs or characteristics and should not be viewed as a “call to action” or suggestion that you enter into a swap or trading strategy involving a swap or any other transaction. Scotiabank may engage in transactions in a manner inconsistent with the views discussed this report and may have positions, or be in the process of acquiring or disposing of positions, referred to in this report.
Scotiabank, its affiliates and any of their respective officers, directors and employees may from time to time take positions in currencies, act as managers, co-managers or underwriters of a public offering or act as principals or agents, deal in, own or act as market makers or advisors, brokers or commercial and/or investment bankers in relation to securities or related derivatives. As a result of these actions, Scotiabank may receive remuneration. All Scotiabank products and services are subject to the terms of applicable agreements and local regulations. Officers, directors and employees of Scotiabank and its affiliates may serve as directors of corporations.
Any securities discussed in this report may not be suitable for all investors. Scotiabank recommends that investors independently evaluate any issuer and security discussed in this report, and consult with any advisors they deem necessary prior to making any investment.
This report and all information, opinions and conclusions contained in it are protected by copyright. This information may not be reproduced without the prior express written consent of Scotiabank.
™ Trademark of The Bank of Nova Scotia. Used under license, where applicable.
Scotiabank, together with “Global Banking and Markets”, is a marketing name for the global corporate and investment banking and capital markets businesses of The Bank of Nova Scotia and certain of its affiliates in the countries where they operate, including; Scotiabank Europe plc; Scotiabank (Ireland) Designated Activity Company; Scotiabank Inverlat S.A., Institución de Banca Múltiple, Grupo Financiero Scotiabank Inverlat, Scotia Inverlat Casa de Bolsa, S.A. de C.V., Grupo Financiero Scotiabank Inverlat, Scotia Inverlat Derivados S.A. de C.V. – all members of the Scotiabank group and authorized users of the Scotiabank mark. The Bank of Nova Scotia is incorporated in Canada with limited liability and is authorised and regulated by the Office of the Superintendent of Financial Institutions Canada. The Bank of Nova Scotia is authorized by the UK Prudential Regulation Authority and is subject to regulation by the UK Financial Conduct Authority and limited regulation by the UK Prudential Regulation Authority. Details about the extent of The Bank of Nova Scotia's regulation by the UK Prudential Regulation Authority are available from us on request. Scotiabank Europe plc is authorized by the UK Prudential Regulation Authority and regulated by the UK Financial Conduct Authority and the UK Prudential Regulation Authority.
Scotiabank Inverlat, S.A., Scotia Inverlat Casa de Bolsa, S.A. de C.V, Grupo Financiero Scotiabank Inverlat, and Scotia Inverlat Derivados, S.A. de C.V., are each authorized and regulated by the Mexican financial authorities.
Not all products and services are offered in all jurisdictions. Services described are available in jurisdictions where permitted by law.