Core inflation met expectations at a sticky 1.7% y/y…
...and just tenths away from 2% as the operational guide
Headline inflation climbed by more than expected
Underlying pressures on inflation are building into 2021
Canadian CPI, m/m / y/y %, November:
Actual: 0.1 / 1.0
Scotia: -0.3 / 0.5
Consensus: 0.0 / 0.8
Prior: 0.4 / 0.7
Canadian core CPI, y/y % change, November :
Average: 1.7 (prior 1.7%)
Weighted median: 1.9 (prior (1.9%)
Common component: 1.5 (prior 1.5 revised down from 1.6%)
Trimmed mean: 1.7 (prior 1.7% revised down from 1.8%)
Headline CPI inflation was firmer than expected while core inflation met my guesstimate. There were surprises across several components in a bottom-up approach that best suits trying to guesstimate monthly inflation estimates, but they weren’t enough to materially alter the picture for the Bank of Canada—yet. What could impact thinking at the BoC, however, is nascent evidence of rising upside pressure in some key drivers that could reinforce a general output gap framework approach.
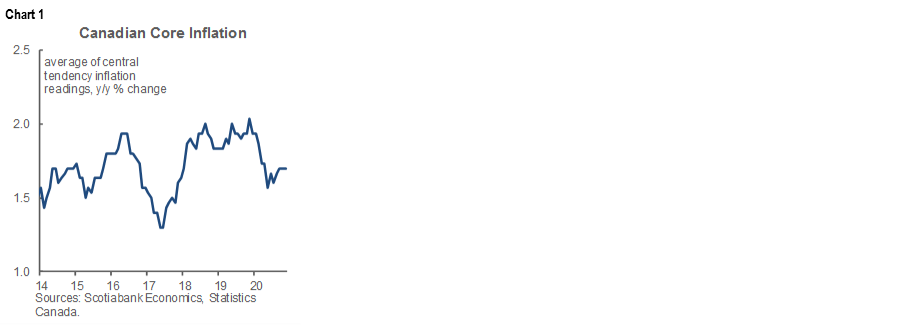
Average core inflation was 1.7% y/y in November. The downward revision to the prior month (from 1.8% to 1.7%) was not anticipated. On balance, trend core inflation is riding at a remarkably sticky 1.7% y/y for four consecutive months.
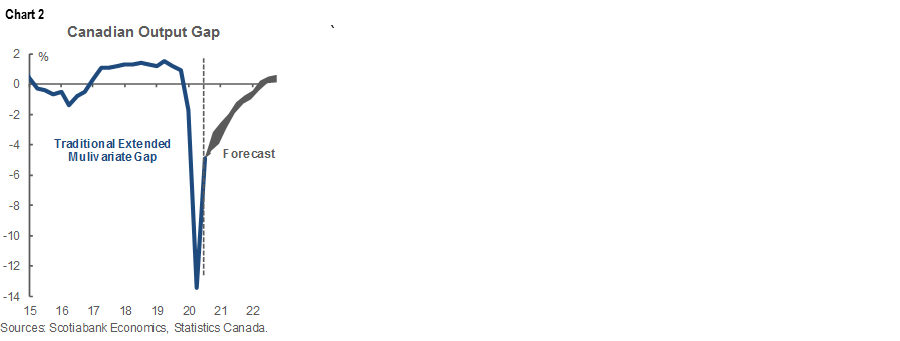
The output gap is forecast to gradually shut over the next 18 months or so using our actual GDP forecast and the mid-point of the BoC’s range fore potential growth (chart 2). As that happens, Canada could well see core inflation converge upon target with headline and core trending toward 2%. Or at least that’s one way of looking at it, but this output gap framework at least needs to be supplemented by more granular bottom-up perspectives. One reason for doing so is the spotty ability of output gaps as a driver of inflation.
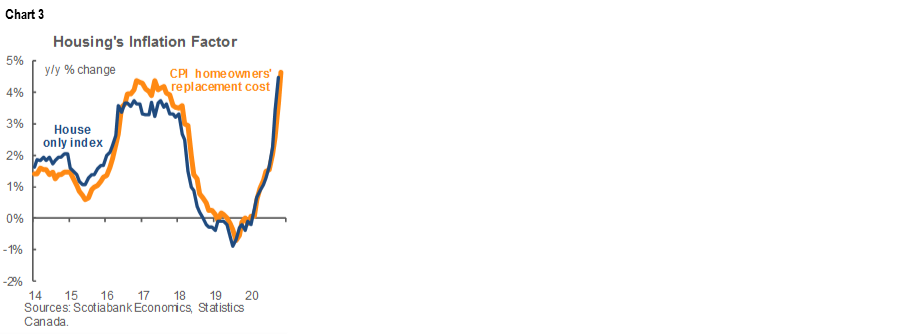
For example, housing costs are a rising driver of inflation. There are multiple ways in which hot housing markets are driving inflation and expected to continue to do so. The way they principally get captured is through owners’ replacement cost which is estimated largely on the basis of what happened to the house only component of Statistics Canada’s new house price index (chart 3). We don’t yet have the NHPI for November but what is inferred from today’s CPI report is a further strong rise. In fact, so much so that housing is now starting to eclipse its role as a driver of inflation during the 2016–18 period in lagged response to the BoC 2015 rate cuts and the Federal government’s stimulus around that time.
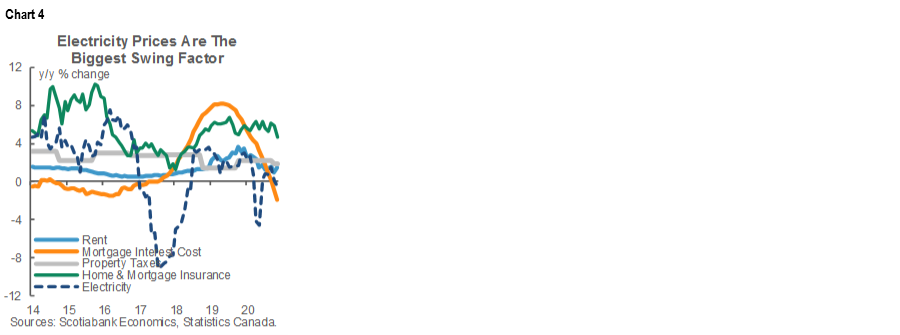
Housing impacts inflation in additional ways through things like home insurance and property taxes. Home insurance premiums continue to post strong gains in part driven by rising house prices (chart 4). Property tax increases also continue to rise at a fairly steady rate in the same chart.
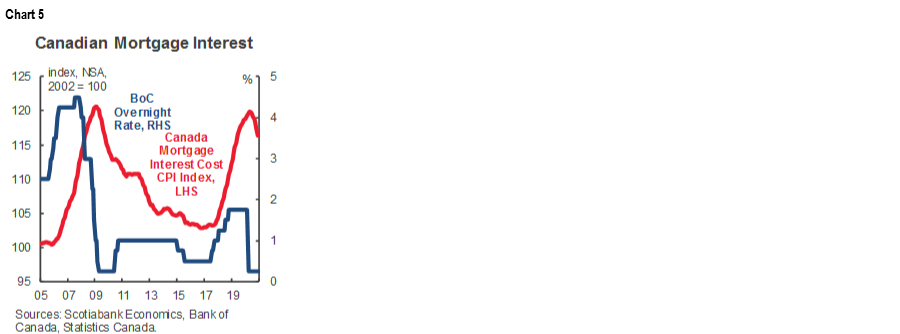
Mortgage interest costs are a waning driver of inflation (chart 5). The BoC strips that out of a decomposition of inflationary pressure anyway as it would be pretty strange to basically react to inflation that is a lagging by-product of prior policy rate changes as shown in the chart. Besides, as 2021 unfolds, mortgage interest costs will start off the year as a continued downward influence upon inflation before that neutralizes in the second half and probably begins to exert upward pressure as market rates pull fixed rate mortgages higher over time.
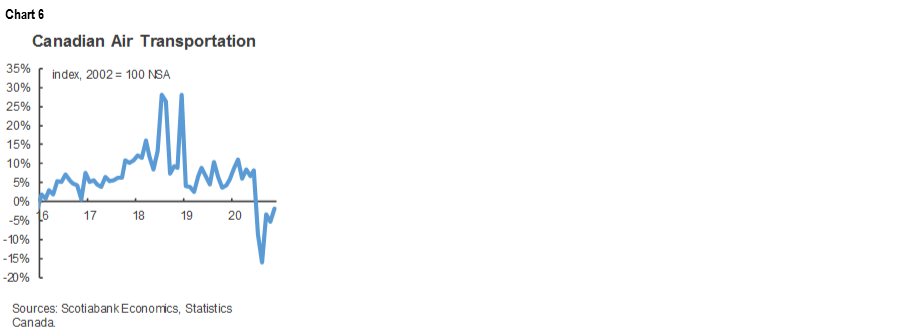
Air transportation prices are becoming less of a drag on CPI inflation (chart 6). They’re still a drag with relatively few folks flying these days, but at a diminishing rate that may very well turn flat in the near-term and possibly marginally higher again when vaccines begin to have a material impact. Longer term what happens to airfare prices depends upon how travel confidence returns, but we’re likely at a gradually more inflationary turning point on this component.
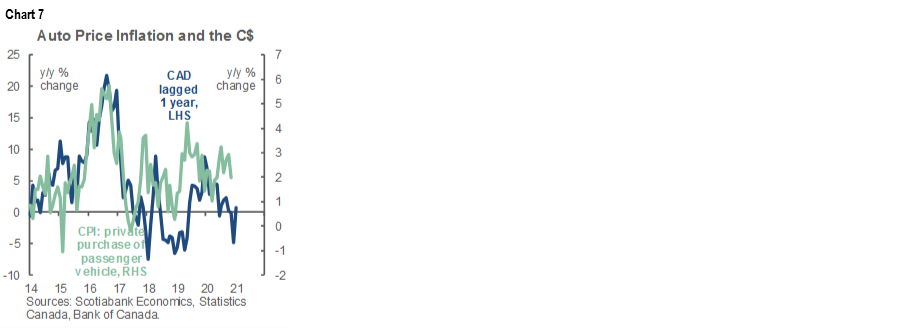
Auto price inflation remains more resilient than suggested by way of exchange rate movements (chart 7). Normally, if the C$ depreciates to the USD then with about a one year lag it results in pass-through to higher retail auto prices. By corollary, as the C$ has appreciated since March, it might be expected to put downward pressure on retail auto prices. The strong connection in prior years has weakened in more recent years. Other drivers such as strong demand and changing products with new technologies might be part of the explanation for auto price inflation. It’s also feasible that automakers and their hedging activities are looking through this year’s volatile exchanges rates in setting prices; if so, then the fact that USDCAD has changed only marginally since about a year ago might explain why there is little connection to auto prices now.
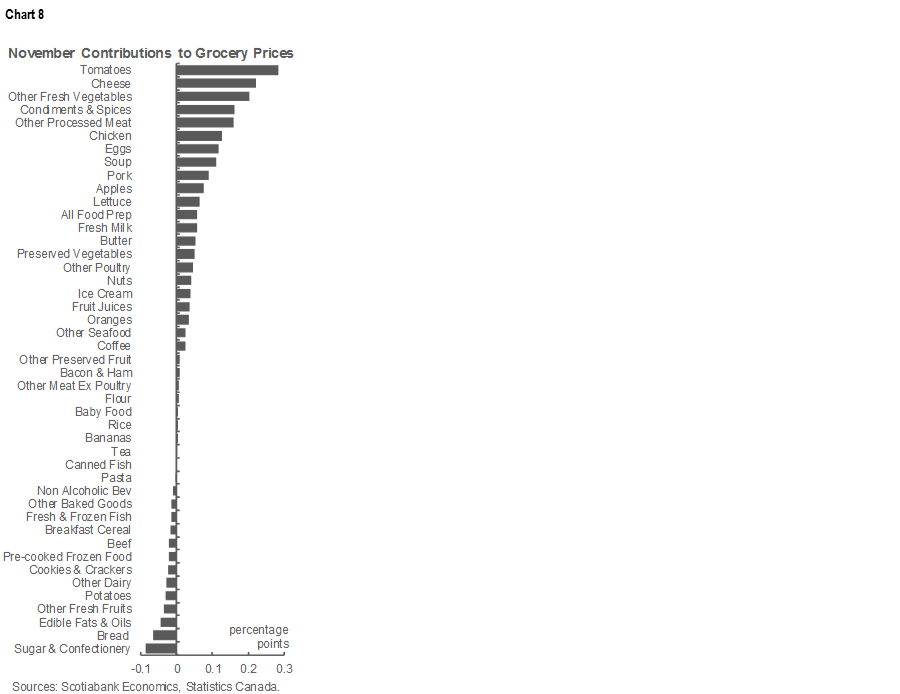
Food prices took a marginal step backward in November (-0.2% m/m SA) but that was not unexpected after a large 0.8% m/m rise the prior month. In year-ago terms, food is up 1.9%. Chart 8 breaks down the weighted contributions of different food prices to the overall food price basket. Sugar is cheap, vegetables not so much, as clearly kids are driving these decisions. I’ll check toothpaste prices and dental fees later. Anyway….ongoing supply shocks to various fruits and vegetables plus poultry and pork prices are driving overall food price inflation.
Electricity prices only carry a 2.2% weight in CPI, but the fact that earlier price cuts have shaken out and price inflation has moved back to zero has added about a tenth to headline inflation compared to earlier this year (chart 4 again). Electricity is likely to keep adding to the year-ago inflation rate in early 2021. Recall Ontario’s move to take away off- and on-peak pricing on March 24th when they shifted back to a 10.1 cents per kWh flat rate and then raised that to 12.8 cents on June 1st before bringing back on- and off-peak pricing on November 1st. Carbon taxes will carry a longer fuse given the recently announced massive hike in levies.
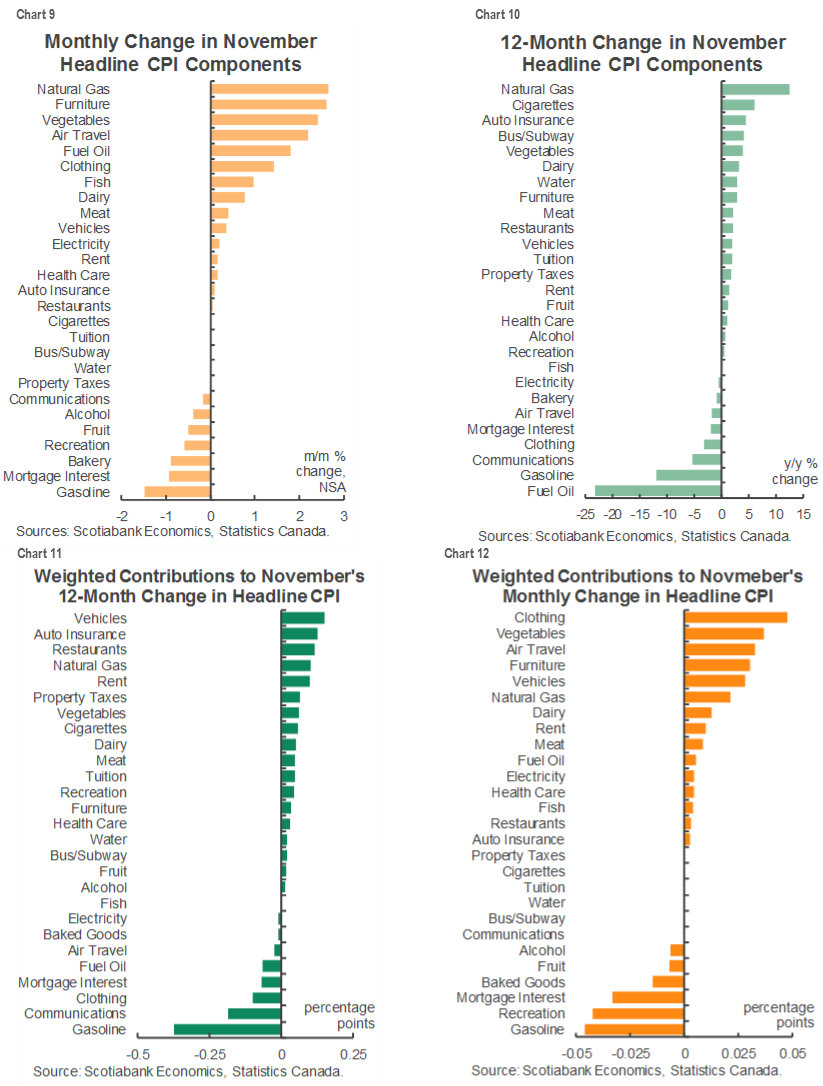
Had enough? Righto, me too with the Fed ahead, but more of this decomposition of idiosyncratic component drivers of inflation is going to be done into 2021. Pictures will be left to do the rest of the talking for today. Charts 9–10 show the unweighted break downs of the month-ago change in CPI by components and the year-ago percentage change. Charts 11–12 do the same thing for weighted contributions by component to give a sense of relative importance.
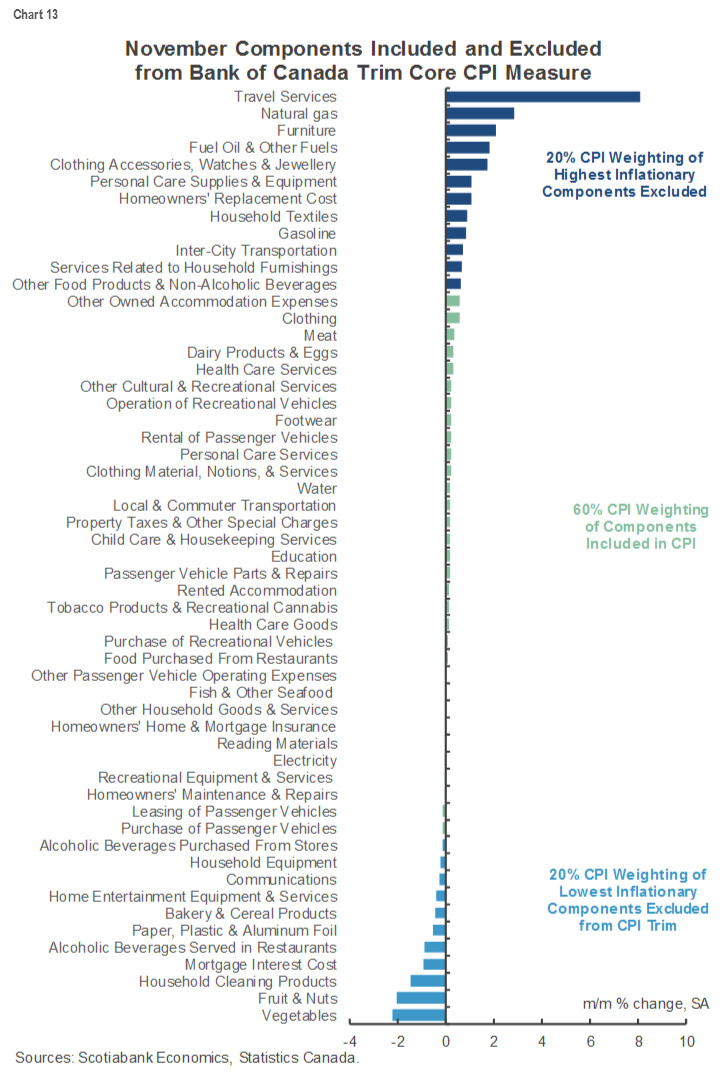
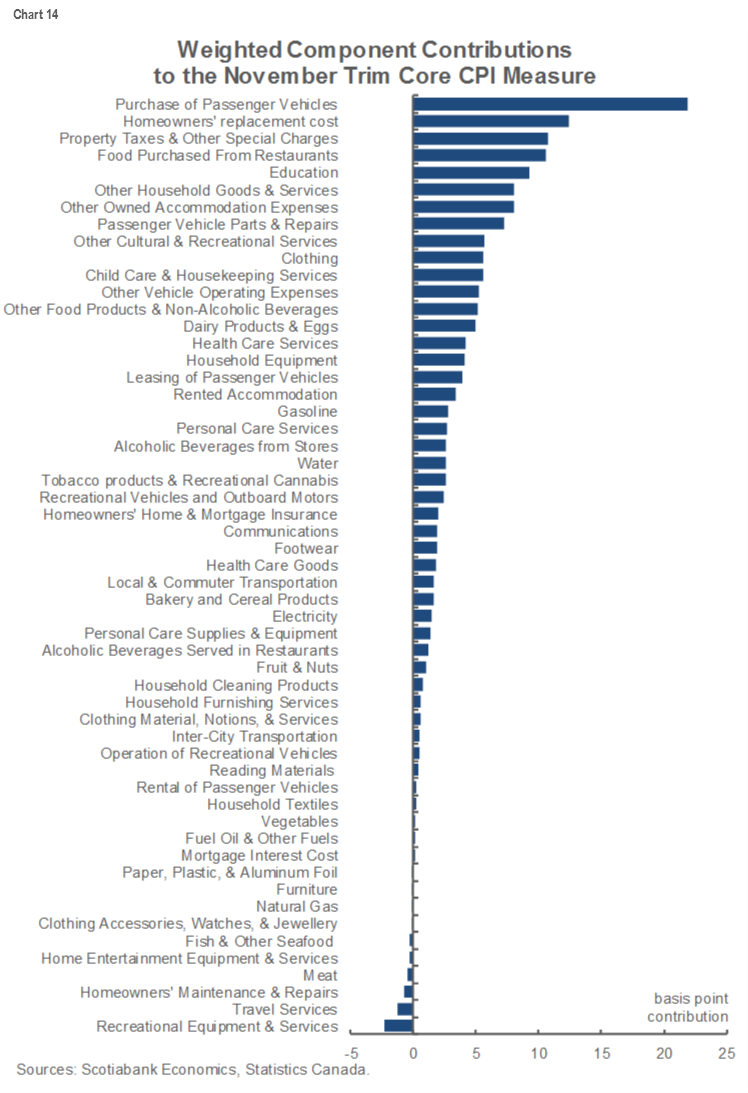
Finally, charts 13–14 break down what goes into the trimmed mean CPI first by showing what got excluded in the latest month in the upper and lower 20% tails that wipes out 40% of the basket, and then by showing weighted contributions to trimmed mean CPI in terms of what was actually included.
The punchline to all of this is that promising that the policy rate will be on hold for years to come may well be tested much sooner than recent BoC guidance indicates, though I suspect that if it’s because the economy is doing better sooner than anticipated they’d likely be quite fine with that.
DISCLAIMER
This report has been prepared by Scotiabank Economics as a resource for the clients of Scotiabank. Opinions, estimates and projections contained herein are our own as of the date hereof and are subject to change without notice. The information and opinions contained herein have been compiled or arrived at from sources believed reliable but no representation or warranty, express or implied, is made as to their accuracy or completeness. Neither Scotiabank nor any of its officers, directors, partners, employees or affiliates accepts any liability whatsoever for any direct or consequential loss arising from any use of this report or its contents.
These reports are provided to you for informational purposes only. This report is not, and is not constructed as, an offer to sell or solicitation of any offer to buy any financial instrument, nor shall this report be construed as an opinion as to whether you should enter into any swap or trading strategy involving a swap or any other transaction. The information contained in this report is not intended to be, and does not constitute, a recommendation of a swap or trading strategy involving a swap within the meaning of U.S. Commodity Futures Trading Commission Regulation 23.434 and Appendix A thereto. This material is not intended to be individually tailored to your needs or characteristics and should not be viewed as a “call to action” or suggestion that you enter into a swap or trading strategy involving a swap or any other transaction. Scotiabank may engage in transactions in a manner inconsistent with the views discussed this report and may have positions, or be in the process of acquiring or disposing of positions, referred to in this report.
Scotiabank, its affiliates and any of their respective officers, directors and employees may from time to time take positions in currencies, act as managers, co-managers or underwriters of a public offering or act as principals or agents, deal in, own or act as market makers or advisors, brokers or commercial and/or investment bankers in relation to securities or related derivatives. As a result of these actions, Scotiabank may receive remuneration. All Scotiabank products and services are subject to the terms of applicable agreements and local regulations. Officers, directors and employees of Scotiabank and its affiliates may serve as directors of corporations.
Any securities discussed in this report may not be suitable for all investors. Scotiabank recommends that investors independently evaluate any issuer and security discussed in this report, and consult with any advisors they deem necessary prior to making any investment.
This report and all information, opinions and conclusions contained in it are protected by copyright. This information may not be reproduced without the prior express written consent of Scotiabank.
™ Trademark of The Bank of Nova Scotia. Used under license, where applicable.
Scotiabank, together with “Global Banking and Markets”, is a marketing name for the global corporate and investment banking and capital markets businesses of The Bank of Nova Scotia and certain of its affiliates in the countries where they operate, including; Scotiabank Europe plc; Scotiabank (Ireland) Designated Activity Company; Scotiabank Inverlat S.A., Institución de Banca Múltiple, Grupo Financiero Scotiabank Inverlat, Scotia Inverlat Casa de Bolsa, S.A. de C.V., Grupo Financiero Scotiabank Inverlat, Scotia Inverlat Derivados S.A. de C.V. – all members of the Scotiabank group and authorized users of the Scotiabank mark. The Bank of Nova Scotia is incorporated in Canada with limited liability and is authorised and regulated by the Office of the Superintendent of Financial Institutions Canada. The Bank of Nova Scotia is authorized by the UK Prudential Regulation Authority and is subject to regulation by the UK Financial Conduct Authority and limited regulation by the UK Prudential Regulation Authority. Details about the extent of The Bank of Nova Scotia's regulation by the UK Prudential Regulation Authority are available from us on request. Scotiabank Europe plc is authorized by the UK Prudential Regulation Authority and regulated by the UK Financial Conduct Authority and the UK Prudential Regulation Authority.
Scotiabank Inverlat, S.A., Scotia Inverlat Casa de Bolsa, S.A. de C.V, Grupo Financiero Scotiabank Inverlat, and Scotia Inverlat Derivados, S.A. de C.V., are each authorized and regulated by the Mexican financial authorities.
Not all products and services are offered in all jurisdictions. Services described are available in jurisdictions where permitted by law.