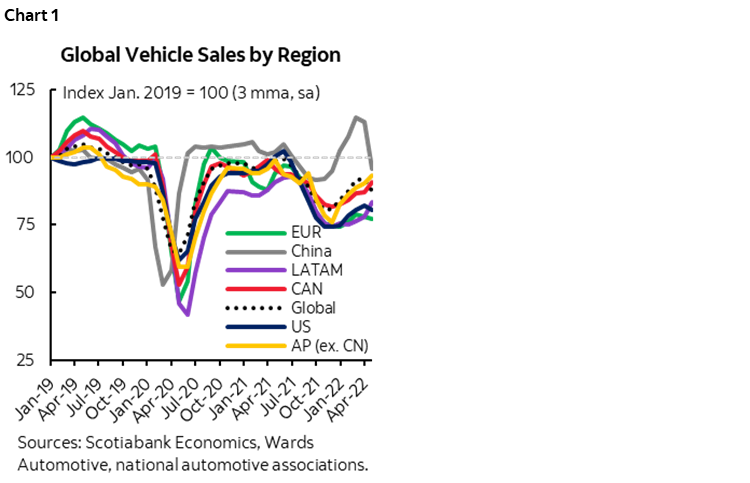
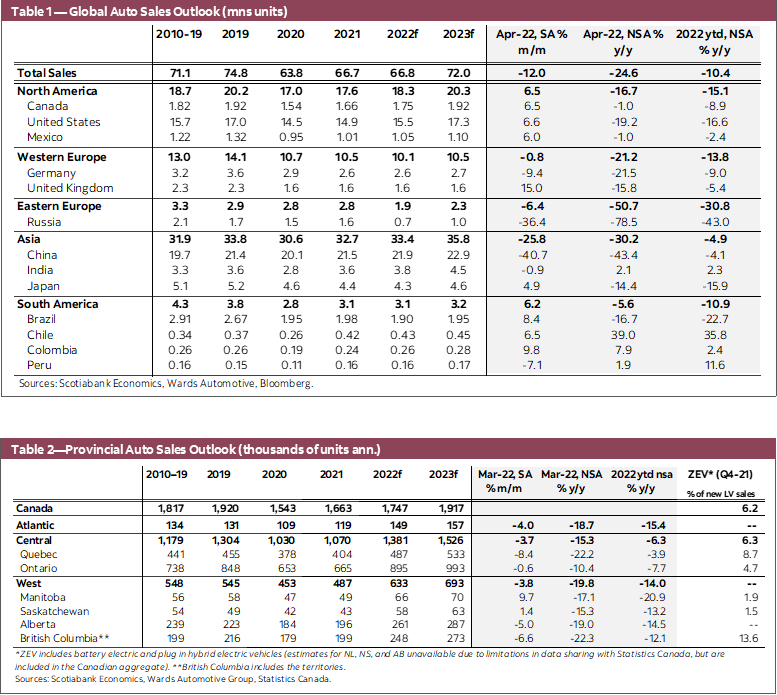
- Global auto sales posted another -12% m/m (sa) decline in April for a second consecutive loss after the six-month streak of improvements (chart 1), dampened by a sharp pullback of -40.7% m/m (sa) in Chinese auto sales—normally representing over 30% of the global light vehicle market. Continued disruptions in Europe and China could further cloud the outlook.
- Consistent with our expectations, North America continued to lead the recovery this year, with another solid 6.5% m/m (sa) rebound in April, at 17.2 mn units saar. Domestic production accelerated further in April, offering some relief to supply constraints.
- Inventory levels remained subdued, and it will take time for production to catch up with demand. Tight supply could spur further pricing pressure in an environment of pent-up demand.
- With global supply chains still under pressure, automakers will likely face high production costs for an extended period, adding to the pricing pressure for new vehicles.
- Used vehicle sales have seen welcomed signs of cooling, but very marginal as prices still stand at elevated levels. Supply is likely to remain tight relative to demand, particularly when major supply channels had dried up during the past two years.
- Financing costs have gone up in recent months, adding to rising affordability challenges in the US and Canada. Strong household balance sheets, along with substantial pent-up demand, should provide a buffer for these challenges. With supply-side factors still limiting the recovery, the impact of higher ownership costs on actual sales is likely to be felt when production catches up.
- Supply constraints likely limited consumers’ shift to more fuel-efficient options in an environment of soaring gasoline prices. With better inventory availability than smaller cars, light truck sales continued to grow as a share of new vehicle purchases.
REGIONAL SETBACKS CLOUD GLOBAL AUTO SALES OUTLOOK
Global auto sales posted another month-over-month decline in April following a similar pull-back in March, as impacts of the war in Ukraine and a new wave of lockdowns in China continued to materialize. In Europe, acute supply pressure has been felt in Germany, France and Italy—where auto production is heavily reliant on Russian energy and Ukrainian suppliers, and led to a further slide in purchases of -1.7% m/m (sa), compounding the -10.5% m/m (sa) sales loss in March. Auto sales in China plunged again by -40.7% m/m (sa) in April owing to the zero COVID-19 policies that constrain travelling and curtail consumption. Weaknesses from these major markets have derailed the bumpy recovery of global auto sales and are likely to keep weighing on the headline numbers in the near term. JD Power and LMC Automotive cut their 2022 global light vehicle sales forecast again in May to 2% below the 2021 level, pushing the recovery out even further.
The disruptions seemed relatively contained for now outside these regions with recovery still well in progress in the rest of Asia and the Americas. North America led the recovery with a solid 6.5% m/m (sa) rebound in April, at 17.2 mn units saar, narrowing the year-over-year shortfall to -16.7%. South America also saw a similar gain of 6.2% m/m (sa), driven by improvements in Brazil, Chile and Colombia (8.4% m/m, 6.5% m/m and 9.8% m/m, respectively). Excluding China, Asia Pacific posted a 2.9% m/m (sa) increase in April as sales continue to pick up in Japan (4.9% m/m sa). Overall, the recovery is likely slow and bumpy with global supply bottlenecks showing no significant sign of easing, while the persistent impact of pricing pressure and high energy prices impose more downside risks to demand across the world.
LACK OF INVENTORY STRAINS SALES IN NORTH AMERICA
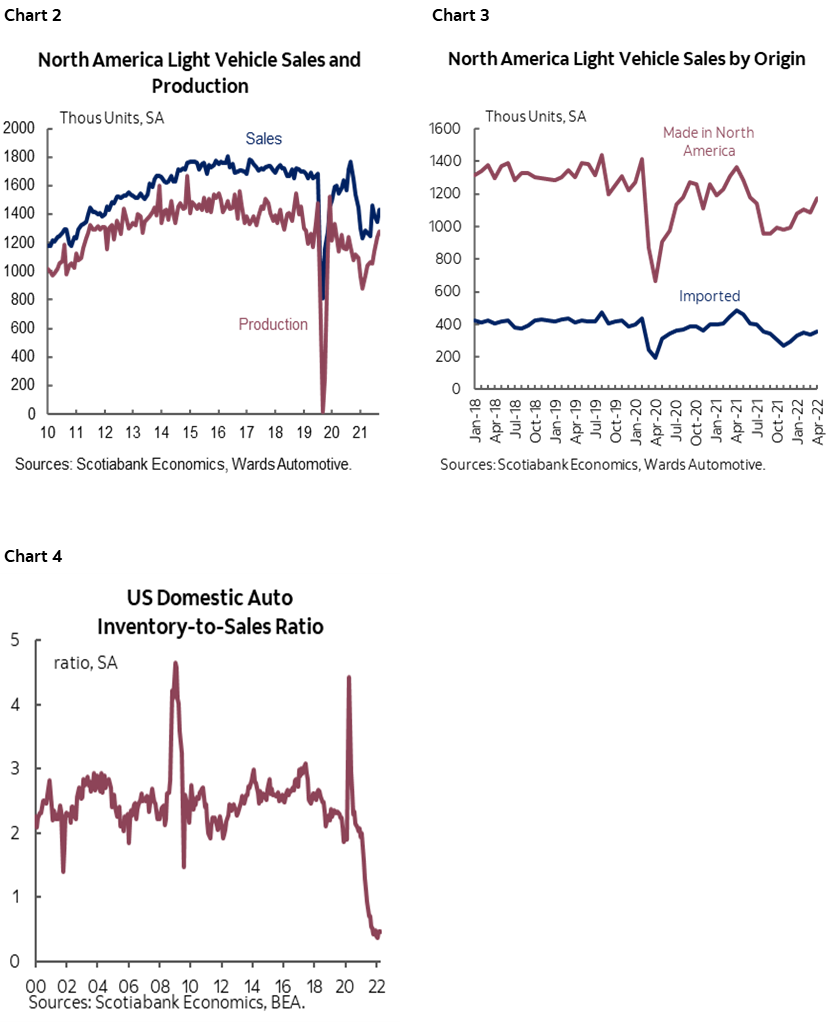
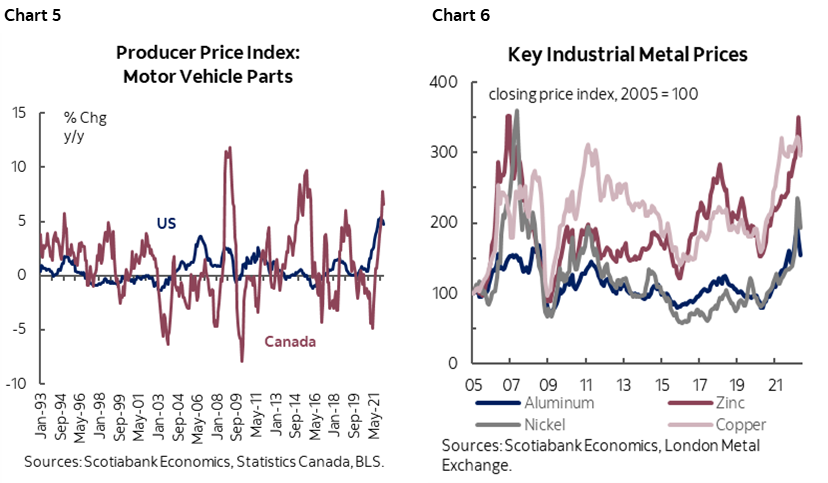
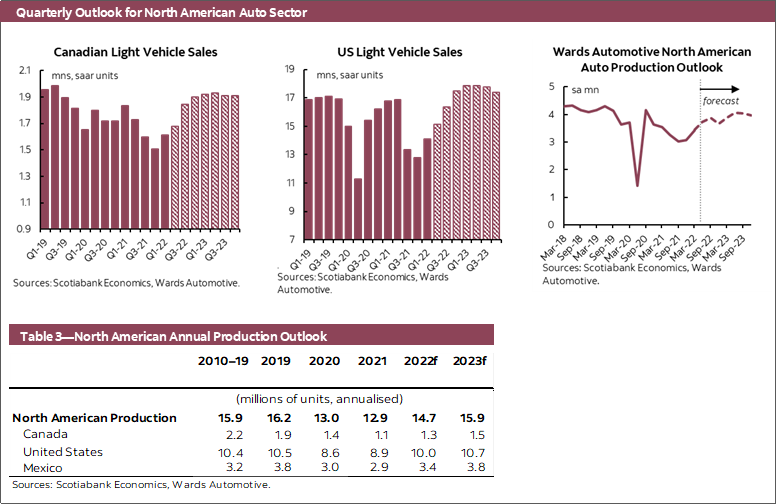
North American production is recovering rapidly from the chip shortage, but supply is slow to catch up with demand. Light vehicle production continued to pick up in April to 15.4 mn units saar—narrowing the gap with the 16.2 mn units in 2019—reflecting resilient supply chain recovery and robust economic activities (chart 2). Wards Automotive expects a slow recovery in North American production for the rest of the year but, with strong headwinds, production will only be back to pre-pandemic levels in 2023. Imported vehicle sales—which account for roughly 25% of total purchases—face even more constraints from foreign production disruptions (chart 3), adding pressure to the supply shortfall. Inventory levels remained subdued during this period of production rebound (chart 4), suggesting that the current speed of improvement is likely not enough to rebuild vehicle inventory in an environment of pent-up demand for the rest of this year.
NO SHORTAGE OF PRICING PRESSURES ON THE HORIZON
As supply remains tight, new vehicle pricing shows no significant sign of relief. April new vehicle price inflation is 7.5% y/y in Canada, and 13.2% y/y in the US. JD Power reported April transaction prices in the US were up 18.7% from the same month a year ago. Cox Automotive has reported that the average transaction price for new vehicles in the US rose 13% y/y in April (USD 5,354), a slight increase from March.
Used vehicle sales showed signs of cooling in April, removing some pricing pressures, yet still under the spell of limited supply. As measured in US inflation data, used vehicle price growth slowed down on a month-over-month basis, after the astronomical 26% y/y price surge in 2021, and still contributes to around one percentage point of y/y CPI inflation. Statistics Canada has finally introduced reporting of used vehicle prices in the Canadian CPI calculation, which would have added 0.2% to headline inflation in March if they had been incorporated. Scotiabank Economics discussed the discrepancy with the US methodology and its implication for Canadian inflation going forward in this note. Black Book retention indices have shown used vehicle valuations softened slightly in April in both Canada and the US, yet still up 33.7% and 21.7%, respectively, from a year ago. Cox Automotive estimated close to 38 mn units saar used vehicle sales in the US, down from the whopping 41 mn units sold in 2021. Sticker-shock and limited selection may have sidelined some consumers which, along with the ramp-up in new vehicle production, might have absorbed part of the demand for used cars, removing some pricing pressure in this segment. Nevertheless, despite a much-welcomed slowdown in price growth, used vehicle supply is likely to remain tight relative to demand, especially with the rebound of rental fleet sales.
Automakers face soaring production costs, which will likely be passed on to consumers. The producer price growth for motor vehicle parts has been accelerating in both the US and Canada, reflecting rising raw material prices and energy costs (chart 5). Prices of key metals (including steel, aluminum, copper, and nickel) began to soften in April with reduced demand from China (chart 6), which could potentially give manufacturers some breathing room in the near term. Although global shipping costs—tracked by the Baltic Dry Index—pulled back from last October’s highs, they could continue to hover around elevated levels for the remainder of the year. As the global supply chain experiences heightened pressure from geopolitical risks (based on the Global Supply Chain Pressure Index estimated by New York Federal Reserve Bank), production costs will likely remain high, which automakers might pass on to consumers with higher pricing and lower incentive spending.
SUPPLY CONSTRAINTS MASK DEMAND-SIDE PRESSURE
Markets have priced in the bulk of future rate hikes, pushing financing costs up and compounding affordability challenges. In Canada, average rates of new auto loans increased further since March with expectations of an aggressive rate hiking path, up around 85 bps since June last year (chart 7) and approaching levels in early 2019 when a combination of BoC monetary policy tightening and looming recession risks led to weak sales through 2018 and 2019. In the US, the transmission of policy tightening to auto loan rates tends to be smaller and with a lag. Similar to the 2017–18 tightening cycle, new auto loan rates started to take off only in March and rose by around 70 bps since then (chart 8). The impact of the 2017–18 tightening cycle was also more muted for auto sales in the US than in Canada (chart 9). Higher financing costs, declining vehicle affordability and trepidation regarding economic outlook will likely erode some demand, and could potentially weigh on purchases once supply catches up in 2023.
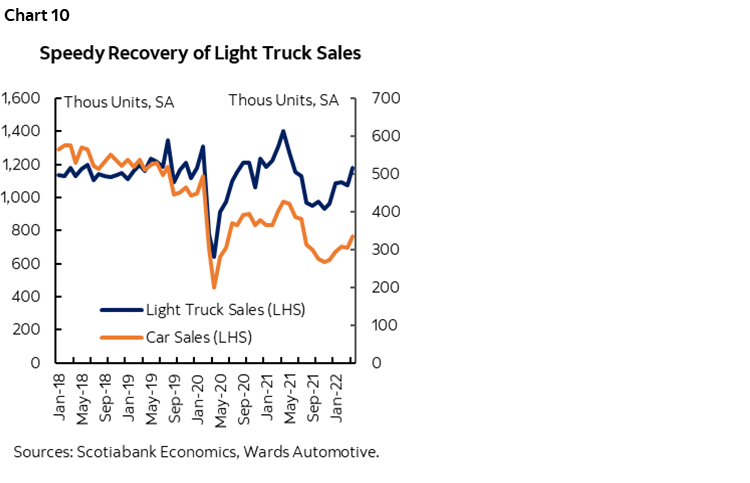
Supply constraints likely limit consumers’ preference for fuel efficiency in an environment of soaring gasoline prices. Purchases of light trucks (i.e., SUVs, vans and pick-up trucks) suffered a smaller loss from the chip shortage, and the speed of recovery continues to outstrip that of cars despite the recent gasoline price spikes (chart 10). With inventory recovering faster for light trucks than smaller cars —the latter tend to be more fuel-efficient—elevated gasoline prices in recent months have not led to a pullback in relative truck sales. Expectations of continued high fuel prices could drive consumers to switch to EV (as supported by several recent surveys such as here, here and here), though a large-scale shift is unlikely this year given the scarcity of supply, not least the affordable models.
DISCLAIMER
This report has been prepared by Scotiabank Economics as a resource for the clients of Scotiabank. Opinions, estimates and projections contained herein are our own as of the date hereof and are subject to change without notice. The information and opinions contained herein have been compiled or arrived at from sources believed reliable but no representation or warranty, express or implied, is made as to their accuracy or completeness. Neither Scotiabank nor any of its officers, directors, partners, employees or affiliates accepts any liability whatsoever for any direct or consequential loss arising from any use of this report or its contents.
These reports are provided to you for informational purposes only. This report is not, and is not constructed as, an offer to sell or solicitation of any offer to buy any financial instrument, nor shall this report be construed as an opinion as to whether you should enter into any swap or trading strategy involving a swap or any other transaction. The information contained in this report is not intended to be, and does not constitute, a recommendation of a swap or trading strategy involving a swap within the meaning of U.S. Commodity Futures Trading Commission Regulation 23.434 and Appendix A thereto. This material is not intended to be individually tailored to your needs or characteristics and should not be viewed as a “call to action” or suggestion that you enter into a swap or trading strategy involving a swap or any other transaction. Scotiabank may engage in transactions in a manner inconsistent with the views discussed this report and may have positions, or be in the process of acquiring or disposing of positions, referred to in this report.
Scotiabank, its affiliates and any of their respective officers, directors and employees may from time to time take positions in currencies, act as managers, co-managers or underwriters of a public offering or act as principals or agents, deal in, own or act as market makers or advisors, brokers or commercial and/or investment bankers in relation to securities or related derivatives. As a result of these actions, Scotiabank may receive remuneration. All Scotiabank products and services are subject to the terms of applicable agreements and local regulations. Officers, directors and employees of Scotiabank and its affiliates may serve as directors of corporations.
Any securities discussed in this report may not be suitable for all investors. Scotiabank recommends that investors independently evaluate any issuer and security discussed in this report, and consult with any advisors they deem necessary prior to making any investment.
This report and all information, opinions and conclusions contained in it are protected by copyright. This information may not be reproduced without the prior express written consent of Scotiabank.
™ Trademark of The Bank of Nova Scotia. Used under license, where applicable.
Scotiabank, together with “Global Banking and Markets”, is a marketing name for the global corporate and investment banking and capital markets businesses of The Bank of Nova Scotia and certain of its affiliates in the countries where they operate, including; Scotiabank Europe plc; Scotiabank (Ireland) Designated Activity Company; Scotiabank Inverlat S.A., Institución de Banca Múltiple, Grupo Financiero Scotiabank Inverlat, Scotia Inverlat Casa de Bolsa, S.A. de C.V., Grupo Financiero Scotiabank Inverlat, Scotia Inverlat Derivados S.A. de C.V. – all members of the Scotiabank group and authorized users of the Scotiabank mark. The Bank of Nova Scotia is incorporated in Canada with limited liability and is authorised and regulated by the Office of the Superintendent of Financial Institutions Canada. The Bank of Nova Scotia is authorized by the UK Prudential Regulation Authority and is subject to regulation by the UK Financial Conduct Authority and limited regulation by the UK Prudential Regulation Authority. Details about the extent of The Bank of Nova Scotia's regulation by the UK Prudential Regulation Authority are available from us on request. Scotiabank Europe plc is authorized by the UK Prudential Regulation Authority and regulated by the UK Financial Conduct Authority and the UK Prudential Regulation Authority.
Scotiabank Inverlat, S.A., Scotia Inverlat Casa de Bolsa, S.A. de C.V, Grupo Financiero Scotiabank Inverlat, and Scotia Inverlat Derivados, S.A. de C.V., are each authorized and regulated by the Mexican financial authorities.
Not all products and services are offered in all jurisdictions. Services described are available in jurisdictions where permitted by law.