CANADA: VOLATILE RECOVERY CARIES THROUGH Q1
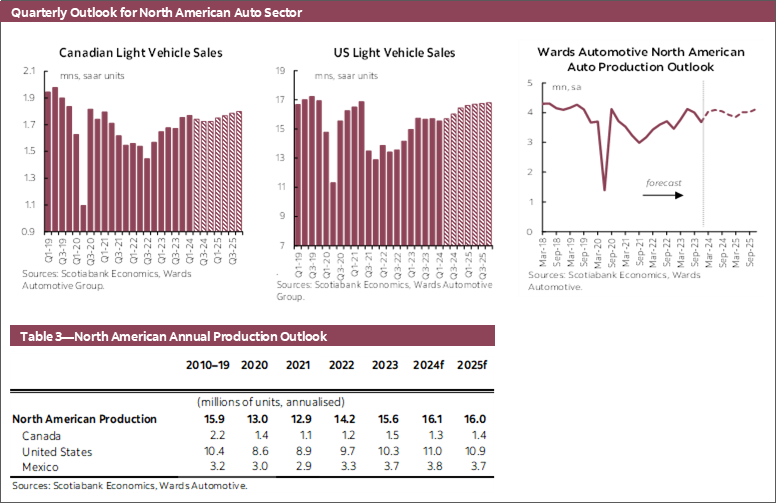
Canadian auto sales slowed to 1.76 mn units (-4.4% m/m) at a seasonally adjusted annualized rate in March according to Wards Automotive (chart 1). While volatile at a monthly frequency, demand for new vehicles continues to persist into 2024 and the pace remains above the 1.68 mn units sold in 2023. Non-seasonally adjusted sales figures for January and February were revised upward by 2.7 and 2.5 percent respectively which explained some of the seasonally adjusted decline, as automotive sales increased by less than a typical month of March based on recent history. Auto sales averaged 1.78 mn (SAAR) units in Q1, up 1.0% q/q from Q4 of 2023, to the highest level in a quarter since Q1 of 2021. Nevertheless, non-seasonally adjusted sales remain -5.7% year-to-date compared to 2019 levels. The average auto loan rate was 8.2% at the end of January, as the Bank of Canada continues to hold the policy rate at 5%. While recent annual headline and core inflation were both less than 3% as of February, the BoC will likely need to see further evidence that inflation is durably returning to the 2% target before beginning to cut the policy rate, which we expect to occur in Q3 of this year. Our outlook for Canadian auto sales is 1.74 mn units in 2024, increasing to 1.78 mn units in 2025 as interest rate headwinds ease.

UNITED STATES: SUPPLY IMPROVING AMID STALLED SALES GROWTH
US new light vehicle sales slowed to 15.5 mn (SAAR) units (-1.3% m/m) in March (chart 2). Auto sales in the US averaged 15.4 mn (SAAR) in the first quarter, contracting by -2.3% q/q. While US light vehicle sales continue to slow from their recent peak of 15.8 mn (SAAR) units in Q2 of 2023, non-seasonally adjusted sales are up 5.1% year-to-date relative to last year. This period of flat-to-slowing sales is allowing supply to improve. North American light vehicle production has increased to an average 15.6 mn (SAAR) units for the three months ending February 2024. Meanwhile US light vehicle inventory has increased in 23 of the past 24 months (in seasonally adjusted terms) however, inventories for Q1-2024 remain slightly more than 60% of Q1-2019 levels. Shipping via the Port of Baltimore has been halted by the bridge collapse that occurred on March 26th. Based on data from the Maryland Port Administration, there were 282 k units imported to the port during 2023. Last year’s vehicle imports via the Port of Baltimore represented less than 2% of last year’s 15.5 mn sales suggesting rerouting may add incrementally to cost pressures for some in a sector that has been buffeted by persistent supply chain shocks over the past four years, but the overall impact should not materially change the outlook. Our outlook for US auto sales is 15.9 mn units in 2024 amid headwinds from elevated interest rates and still recovering inventories, increasing to 16.7 mn units in 2025 as these headwinds ease.

GLOBAL AUTO SALES: BROAD SUPPORT IN FEBRUARY
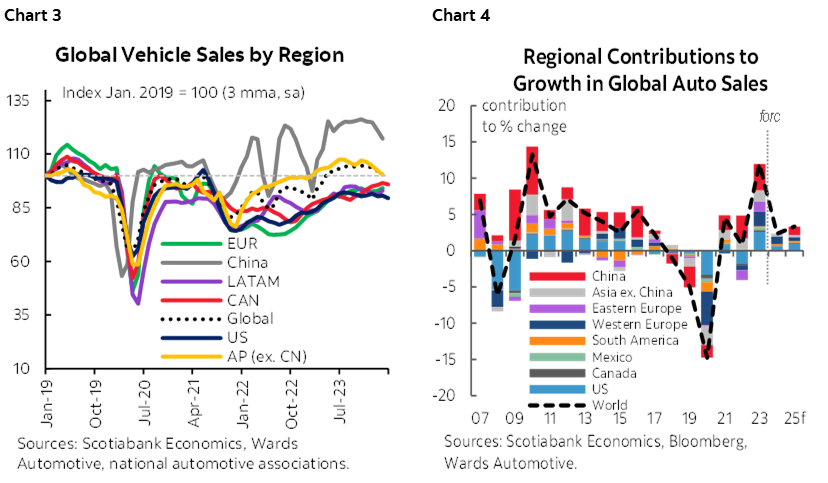
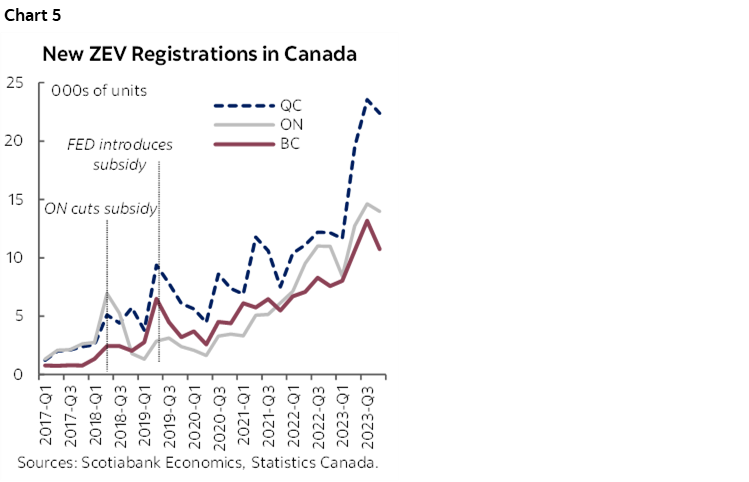
Global auto sales increased 2.5% m/m (SA) in February following three consecutive monthly declines, with growth across most of the regions covered (chart 3). Auto sales in Western Europe increased 3.7% m/m (SA), up for the second consecutive month to start the year. Growth in auto sales for the month was supported by increases in 10 of the 15 countries covered, higher in France (4.5% m/m, SA), Italy (1.1%), and the UK (10.5%), while declining in Germany (-0.7%) and Spain (-1.6%). Auto sales in Eastern Europe fell -3.4% m/m (SA), declining in three of the four countries covered, and slowed further by the continued decline of auto sales in Russia (-6.4%). Latin American auto sales also increased for the second consecutive month to start the year, up by 5.8% m/m (SA). Small declines in Mexico (-0.7% m/m, SA) and Chile (-0.9%) were entirely offset by increases in Brazil (1.8%), Colombia (13.1%) and Peru (14.7%), while Argentina’s seasonally adjusted increase of 72.6% is largely owing to distortions as non-seasonally adjusted sales increased 10% m/m. Asia Pacific auto sales increased by 0.8% m/m (SA), as increases in Australia (7.6%), China (2.1%), Indonesia (6.5%) and South Korea (2.3%) were largely offset by declines in India (-3.0%) and Japan (-5.8%). Our outlook for global auto sales expects an increase of 2.3% in 2024 and 3.3% in 2025 as elevated interest rates weigh on consumer spending and activity (chart 4).
ELECTRIC VEHICLE SALES: BC MEETS FIRST INTERIM ANNUAL ZEV SALES TARGET
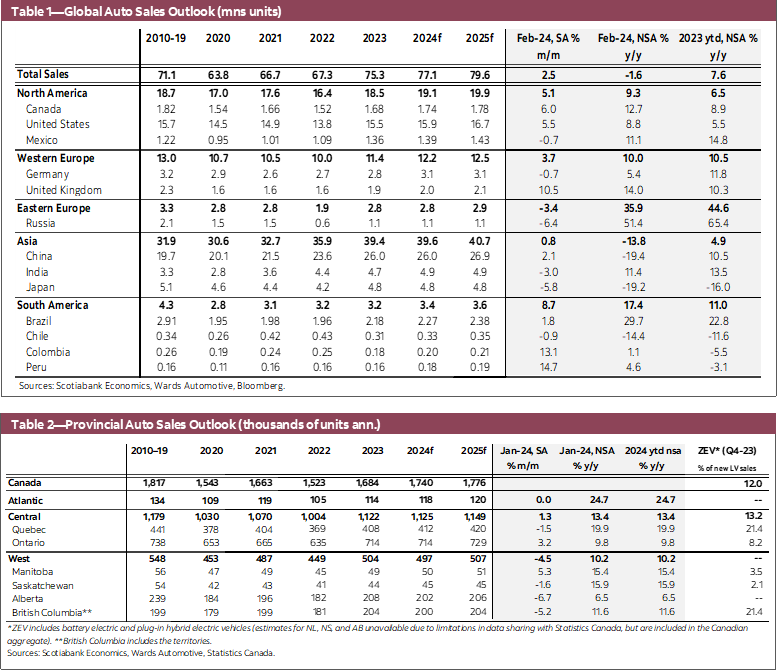
Zero-emission vehicles’ (ZEVs) share of Canadian new motor vehicle registrations decreased slightly to 12.0% in Q4, down from 12.3% in Q3 of 2023 according to Statistics Canada. Annual new ZEV registrations increased 49.4% year-over-year to 184.6 k in 2023, of which 139.5 k were battery electric and 45.1 k were plug-in hybrid vehicles. The growth in market share for both battery electric and plug-in hybrid vehicles has helped ZEVs account for slightly more than one-in-ten (10.8%) of the 1.71 mn new motor vehicle registrations throughout Canada last year. ZEV market share is half of the first interim sales target of at least 20% new light-duty vehicles in Canada being ZEVs by 2026, a milestone to track progress along the path towards Canada’s 100% ZEV sales target by 2035. In British Columbia, ZEVs’ market share declined slightly to 21.4% in Q4 from 23.2% in Q3 (chart 5). BC is the only province, for which data is reported, to already meet this first interim sales target in annual figures, with the 42.6 k ZEVs accounting for one-in-five (20.2%) of all new motor vehicle registrations in 2023. In Quebec ZEVs accounted for more than one-in-five of new motor vehicle registrations for the second consecutive quarter in Q4 (21.4%) 2023, up from 20.9% in Q3. However, the 77.1 k annual ZEV registrations accounted for 18.6% of the province’s vehicle registrations in 2023. Meanwhile in Ontario, the largest province by all fuel type vehicle registrations, ZEVs held steady at 8.2% of all new motor vehicles registered in Q3 and Q4, while the 49.8 k annual ZEV sales equate to a market share of 7.4% in 2023. PEI reported similar annual ZEV share, at 7.6% (496 units) for annual 2023 motor vehicle registrations. Meanwhile annual ZEV market share in the other provinces for which data is reported is each below 5%, with New Brunswick at 4.8% (1.7 k units), Manitoba at 3.5% (1.6 k units), and Saskatchewan at 2.3% (1.1 k units). Statistics Canada does not report new motor vehicle registrations by fuel type for Newfoundland and Labrador, Nova Scotia, or Alberta. Manitoba recently announced as part of their budget for fiscal year 2024-2025 that they will be introducing a ZEV purchase incentive, offering rebates on eligible new battery electric or plug-in hybrid vehicles of up to $4,000 to encourage demand for EVs in the province. In Quebec, as part of the budget for fiscal year 2024-2025, it was announced that they will be gradually phasing out the EV rebate by the end of 2026, reducing the rebate amount each year from the current maximum of $7,000. While it is encouraging that BC and Quebec have both reached 20% ZEV sales share in annual and quarterly figures respectively in 2023, further progress across the remaining provinces will be needed for Canada to meet the first interim ZEV sales target by 2026, as stalled activity poses headwinds in the both the near term and further out.
DISCLAIMER
This report has been prepared by Scotiabank Economics as a resource for the clients of Scotiabank. Opinions, estimates and projections contained herein are our own as of the date hereof and are subject to change without notice. The information and opinions contained herein have been compiled or arrived at from sources believed reliable but no representation or warranty, express or implied, is made as to their accuracy or completeness. Neither Scotiabank nor any of its officers, directors, partners, employees or affiliates accepts any liability whatsoever for any direct or consequential loss arising from any use of this report or its contents.
These reports are provided to you for informational purposes only. This report is not, and is not constructed as, an offer to sell or solicitation of any offer to buy any financial instrument, nor shall this report be construed as an opinion as to whether you should enter into any swap or trading strategy involving a swap or any other transaction. The information contained in this report is not intended to be, and does not constitute, a recommendation of a swap or trading strategy involving a swap within the meaning of U.S. Commodity Futures Trading Commission Regulation 23.434 and Appendix A thereto. This material is not intended to be individually tailored to your needs or characteristics and should not be viewed as a “call to action” or suggestion that you enter into a swap or trading strategy involving a swap or any other transaction. Scotiabank may engage in transactions in a manner inconsistent with the views discussed this report and may have positions, or be in the process of acquiring or disposing of positions, referred to in this report.
Scotiabank, its affiliates and any of their respective officers, directors and employees may from time to time take positions in currencies, act as managers, co-managers or underwriters of a public offering or act as principals or agents, deal in, own or act as market makers or advisors, brokers or commercial and/or investment bankers in relation to securities or related derivatives. As a result of these actions, Scotiabank may receive remuneration. All Scotiabank products and services are subject to the terms of applicable agreements and local regulations. Officers, directors and employees of Scotiabank and its affiliates may serve as directors of corporations.
Any securities discussed in this report may not be suitable for all investors. Scotiabank recommends that investors independently evaluate any issuer and security discussed in this report, and consult with any advisors they deem necessary prior to making any investment.
This report and all information, opinions and conclusions contained in it are protected by copyright. This information may not be reproduced without the prior express written consent of Scotiabank.
™ Trademark of The Bank of Nova Scotia. Used under license, where applicable.
Scotiabank, together with “Global Banking and Markets”, is a marketing name for the global corporate and investment banking and capital markets businesses of The Bank of Nova Scotia and certain of its affiliates in the countries where they operate, including; Scotiabank Europe plc; Scotiabank (Ireland) Designated Activity Company; Scotiabank Inverlat S.A., Institución de Banca Múltiple, Grupo Financiero Scotiabank Inverlat, Scotia Inverlat Casa de Bolsa, S.A. de C.V., Grupo Financiero Scotiabank Inverlat, Scotia Inverlat Derivados S.A. de C.V. – all members of the Scotiabank group and authorized users of the Scotiabank mark. The Bank of Nova Scotia is incorporated in Canada with limited liability and is authorised and regulated by the Office of the Superintendent of Financial Institutions Canada. The Bank of Nova Scotia is authorized by the UK Prudential Regulation Authority and is subject to regulation by the UK Financial Conduct Authority and limited regulation by the UK Prudential Regulation Authority. Details about the extent of The Bank of Nova Scotia's regulation by the UK Prudential Regulation Authority are available from us on request. Scotiabank Europe plc is authorized by the UK Prudential Regulation Authority and regulated by the UK Financial Conduct Authority and the UK Prudential Regulation Authority.
Scotiabank Inverlat, S.A., Scotia Inverlat Casa de Bolsa, S.A. de C.V, Grupo Financiero Scotiabank Inverlat, and Scotia Inverlat Derivados, S.A. de C.V., are each authorized and regulated by the Mexican financial authorities.
Not all products and services are offered in all jurisdictions. Services described are available in jurisdictions where permitted by law.