

CANADA: SALES EXTEND RECENT GAINS IN Q2
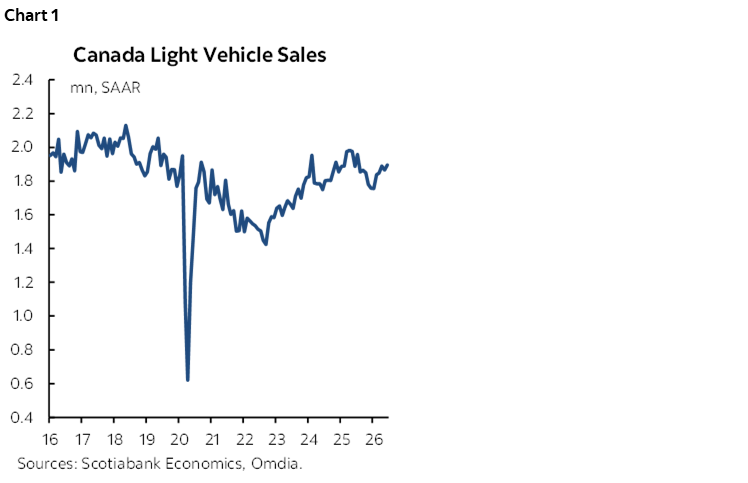
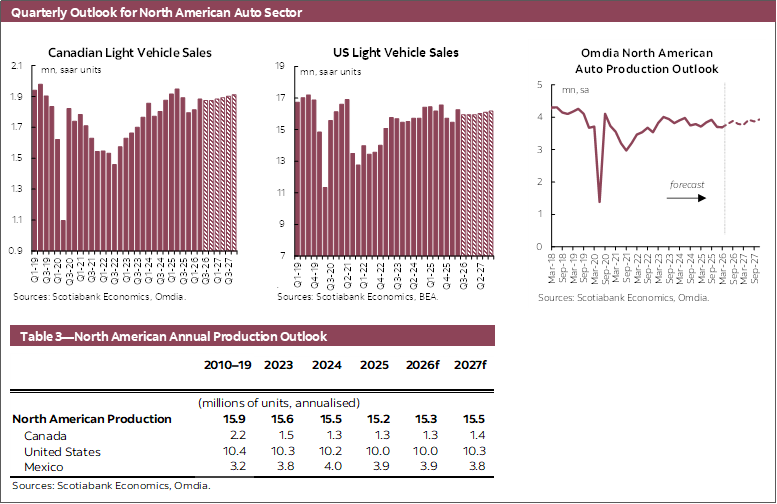
Canadian auto sales increased 1.6% month-over-month to 1.9 mn units at a seasonally adjusted annualized rate (SAAR) in June based on data from Omdia (chart 1). Last month marked the fourth increase over the previous five months, as demand continues to rebound from softer sales in late-2025. Vehicle sales increased 3.8% q/q in Q2, averaging 1.88 mn (SAAR) units, after accounting for small downward revisions to data for April and May. In non-seasonally adjusted terms as reported by the same source, vehicle sales were 175.4 k for May, with Q2 sales down 3.4% y/y when compared to a partially distorted Spring 2025 but up 6.4% compared to the same period in 2024. When looking at vehicle sales by segment, car sales which account for slightly less than 15% of the overall market increased 20.7% q/q, as sales recovered to approximately the same volume a year ago (0.2% y/y, Q2). Whereas sales of the light truck segment, that account for more than 85% of the new sales market, increased 1.9% q/q in Q2 but remain down 4% y/y.
Broader economic factors that provide some support to vehicle demand have shown some recent improvement. Monthly real GDP grew 0.5% in April, as economic activity showed signs of rebounding from previous softness, which is further supported by the 88 k jobs added in May that helped push the unemployment rate down to 6.6% (SA). While headline inflation rose to 3.2% y/y in May, core inflation (excluding food & energy) rose 1.6% y/y, providing the Bank of Canada some room to hold the policy rate at 2.25% while assessing whether the higher and volatile oil prices are passing through to more broad inflationary pressures. Meanwhile, uncertainty around trade policy is likely to persist, weighing on business investment, as Canada, the US, and Mexico did not renew CUSMA by the July 1st deadline, with the trade agreement staying in place with annual reviews until it expires in 2036 or is renewed at a later date.
Our outlook for Canadian light vehicle sales is 1.86 mn in 2026 as we expect sales to trend sideways through the middle of the year, but could remain volatile from month to month. New vehicle sales are expected to improve next year, rising to 1.9 mn in 2027. However, this outlook faces large uncertainty owing to ongoing volatility in global oil prices and risks to potential future trade developments.
UNITED STATES: DEMAND HOLDS UP AS HEADWINDS BUILD
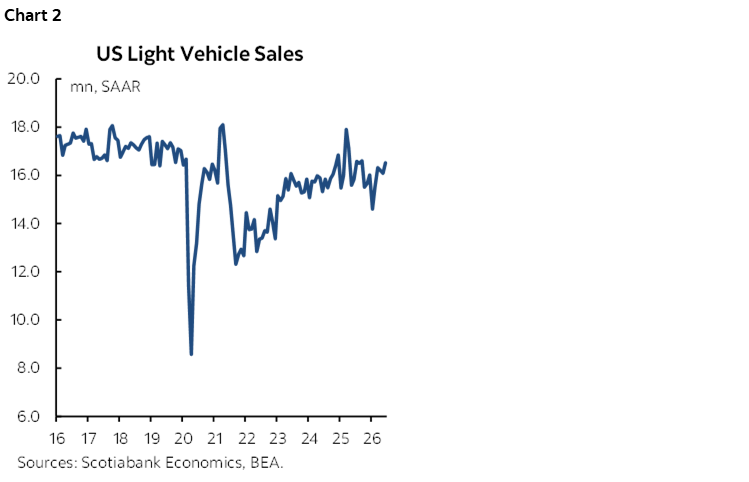
US auto sales increased 2.7% m/m to 16.5 mn (SAAR) units in June, according to the BEA (chart 2). Vehicle sales maintained their strength through the middle of the year, averaging 16.3 mn (SAAR) units in Q2, thanks in part to a strong end to the quarter, and increasing 5.2% q/q relative to Q1-2026. Non-seasonally adjusted sales as reported by the same source were 1.36 mn for the month, up 7.2% y/y, while non-seasonally adjusted sales for Q2 were up 0.5% vs 2025 and up 3.8% compared to the same quarter in 2024.
The US labour market may have shown signs of slowing momentum after a solid rebound in the Spring and early Summer. Despite the US unemployment rate falling to 4.2% in June, non-farm employment only grew by 57 k after averaging 164 k over the three months to May. Meanwhile, headline and core measures of inflation rose more than 4% and 3% respectively year-over-year in May. The softer labour market along with still elevated inflation are pulling in opposite directions of the Federal Reserve’s dual mandate to achieve maximum sustainable employment and price stability. Absent a deterioration in the outlook, there is unlikely to be immediate interest rate relief in the near term, while softer labour market data is likely to keep the FOMC wary of returning to rate hikes.
Our outlook for US auto sales is 15.9 mn units in 2026 with the sales rate slightly pulling back from the recent level in the second half of this year, and marginally improving to 16.1 mn in 2027 as expected interest rate relief and improving labour market dynamics support consumer demand.
GLOBAL AUTO SALES: MOMENTUM STALLS AFTER RECENT GAINS
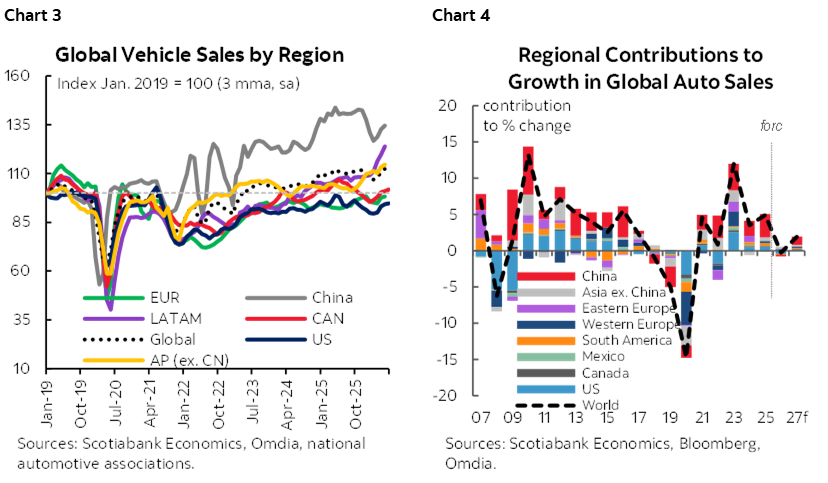
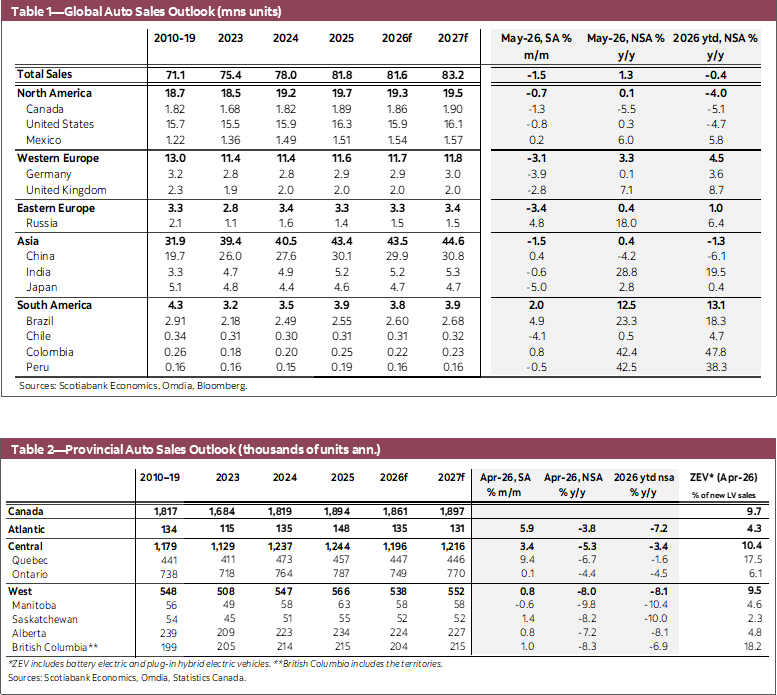
Global auto sales decreased 1.5% m/m (SA) in May, halting the three-month trend of growing volumes on a seasonally adjusted basis (chart 3). The softness was broad based as Latin America was the sole region tracked for which sales did not decline in the month of May. Latam sales increased 1.5% m/m (SA), driven higher by continued growth in Brazil’s seasonally adjusted sales that increased 4.9%, while sales in the five other countries were flat or lower month-over-month. Momentum in auto demand through Q2 is supporting the region’s sales which are up 11% year-to-date (ytd). In western Europe, vehicle sales were down 3.1% m/m (SA) in May, continuing to pull back from the recent high in March as the surge in oil prices likely impact consumer demand, with vehicle sales slowing in 11 of the 15 countries tracked. As such, regional sales are now only up 4% ytd. Meanwhile, auto sales in eastern Europe fell 3.4% m/m (SA) and have been trending sideways through the first five months of the year, with sales marginally higher (0.9%) year-to-date. Likewise in the Asia Pacific region, auto sales have been holding relatively steady in the face of the oil price surge, where sales fell 1.5% m/m (SA) as the 0.4% increase in Chinese vehicle sales was more than offset by declines in the rest of the region that averaged 5%. Auto sales for the region are down 2.1% through May (ytd), weighed by the 6.7% (ytd) decline in Chinese sales. Our outlook for global vehicle sales is a decline of 0.2% in 2026 before increasing 1.9% in 2027 (chart 4) but faces large uncertainty, notably owing to ongoing volatility in global trade and energy prices.
DISCLAIMER
This report has been prepared by Scotiabank Economics as a resource for the clients of Scotiabank. Opinions, estimates and projections contained herein are our own as of the date hereof and are subject to change without notice. The information and opinions contained herein have been compiled or arrived at from sources believed reliable but no representation or warranty, express or implied, is made as to their accuracy or completeness. Neither Scotiabank nor any of its officers, directors, partners, employees or affiliates accepts any liability whatsoever for any direct or consequential loss arising from any use of this report or its contents.
These reports are provided to you for informational purposes only. This report is not, and is not constructed as, an offer to sell or solicitation of any offer to buy any financial instrument, nor shall this report be construed as an opinion as to whether you should enter into any swap or trading strategy involving a swap or any other transaction. The information contained in this report is not intended to be, and does not constitute, a recommendation of a swap or trading strategy involving a swap within the meaning of U.S. Commodity Futures Trading Commission Regulation 23.434 and Appendix A thereto. This material is not intended to be individually tailored to your needs or characteristics and should not be viewed as a “call to action” or suggestion that you enter into a swap or trading strategy involving a swap or any other transaction. Scotiabank may engage in transactions in a manner inconsistent with the views discussed this report and may have positions, or be in the process of acquiring or disposing of positions, referred to in this report.
Scotiabank, its affiliates and any of their respective officers, directors and employees may from time to time take positions in currencies, act as managers, co-managers or underwriters of a public offering or act as principals or agents, deal in, own or act as market makers or advisors, brokers or commercial and/or investment bankers in relation to securities or related derivatives. As a result of these actions, Scotiabank may receive remuneration. All Scotiabank products and services are subject to the terms of applicable agreements and local regulations. Officers, directors and employees of Scotiabank and its affiliates may serve as directors of corporations.
Any securities discussed in this report may not be suitable for all investors. Scotiabank recommends that investors independently evaluate any issuer and security discussed in this report, and consult with any advisors they deem necessary prior to making any investment.
This report and all information, opinions and conclusions contained in it are protected by copyright. This information may not be reproduced without the prior express written consent of Scotiabank.
™ Trademark of The Bank of Nova Scotia. Used under license, where applicable.
Scotiabank, together with “Global Banking and Markets”, is a marketing name for the global corporate and investment banking and capital markets businesses of The Bank of Nova Scotia and certain of its affiliates in the countries where they operate, including; Scotiabank Europe plc; Scotiabank (Ireland) Designated Activity Company; Scotiabank Inverlat S.A., Institución de Banca Múltiple, Grupo Financiero Scotiabank Inverlat, Scotia Inverlat Casa de Bolsa, S.A. de C.V., Grupo Financiero Scotiabank Inverlat, Scotia Inverlat Derivados S.A. de C.V. – all members of the Scotiabank group and authorized users of the Scotiabank mark. The Bank of Nova Scotia is incorporated in Canada with limited liability and is authorised and regulated by the Office of the Superintendent of Financial Institutions Canada. The Bank of Nova Scotia is authorized by the UK Prudential Regulation Authority and is subject to regulation by the UK Financial Conduct Authority and limited regulation by the UK Prudential Regulation Authority. Details about the extent of The Bank of Nova Scotia's regulation by the UK Prudential Regulation Authority are available from us on request. Scotiabank Europe plc is authorized by the UK Prudential Regulation Authority and regulated by the UK Financial Conduct Authority and the UK Prudential Regulation Authority.
Scotiabank Inverlat, S.A., Scotia Inverlat Casa de Bolsa, S.A. de C.V, Grupo Financiero Scotiabank Inverlat, and Scotia Inverlat Derivados, S.A. de C.V., are each authorized and regulated by the Mexican financial authorities.
Not all products and services are offered in all jurisdictions. Services described are available in jurisdictions where permitted by law.