Global auto sales continued to strengthen for a second consecutive month in June, following April’s all-time low that saw a -46% y/y* decline. Purchases picked up by 22% m/m (sa)—a similar pace of acceleration observed in May—but still -18% below last June’s sales activity.
Auto sales are benefiting from rebound effects as major economies around the world continue to re-open gradually. Concerns that low vehicle use during lockdowns, greater remote work prospects, and financially strapped households could curb vehicle sales are not playing out so far in this nascent phase of the economic recovery.
In fact, the strength of the rebound in demand is outstripping supply in some markets and vehicle segments. This is creating inventory challenges for some dealers while potentially adding price pressures for consumers.
China continues to lead the global recovery in auto purchases with a second consecutive month of positive sales at +2% y/y in June, albeit the pace of sales decelerated on a month-over-month basis by -4%.
The next three largest auto markets also experienced boosts to sales activity: US growth moderated by +6% m/m, while Japan and Germany saw increases of 31% and 24% m/m, respectively, though all three still sit well-below year-prior sales levels.
France was the only other major market, apart from China, to enjoy positive year-over-year sales activity with a modest 1% boost (91% m/m) in June, while Canada is closing the gap at -16% y/y (46% m/m).
Despite mounting outbreaks across most of Latin America, all major markets saw an increase in sales activity on a month-over-month basis, though regional sales as a whole were still down by 45% y/y in June.
Half-way through 2020, global auto sales sit at -29% ytd. On the bright side, auto sales for the most part have been part of—not an impediment to—the rebound. While the multi-year recovery is fraught with risks, we cautiously forecast global auto sales will end the year down by 20%.
AN UNEVEN REBOUND
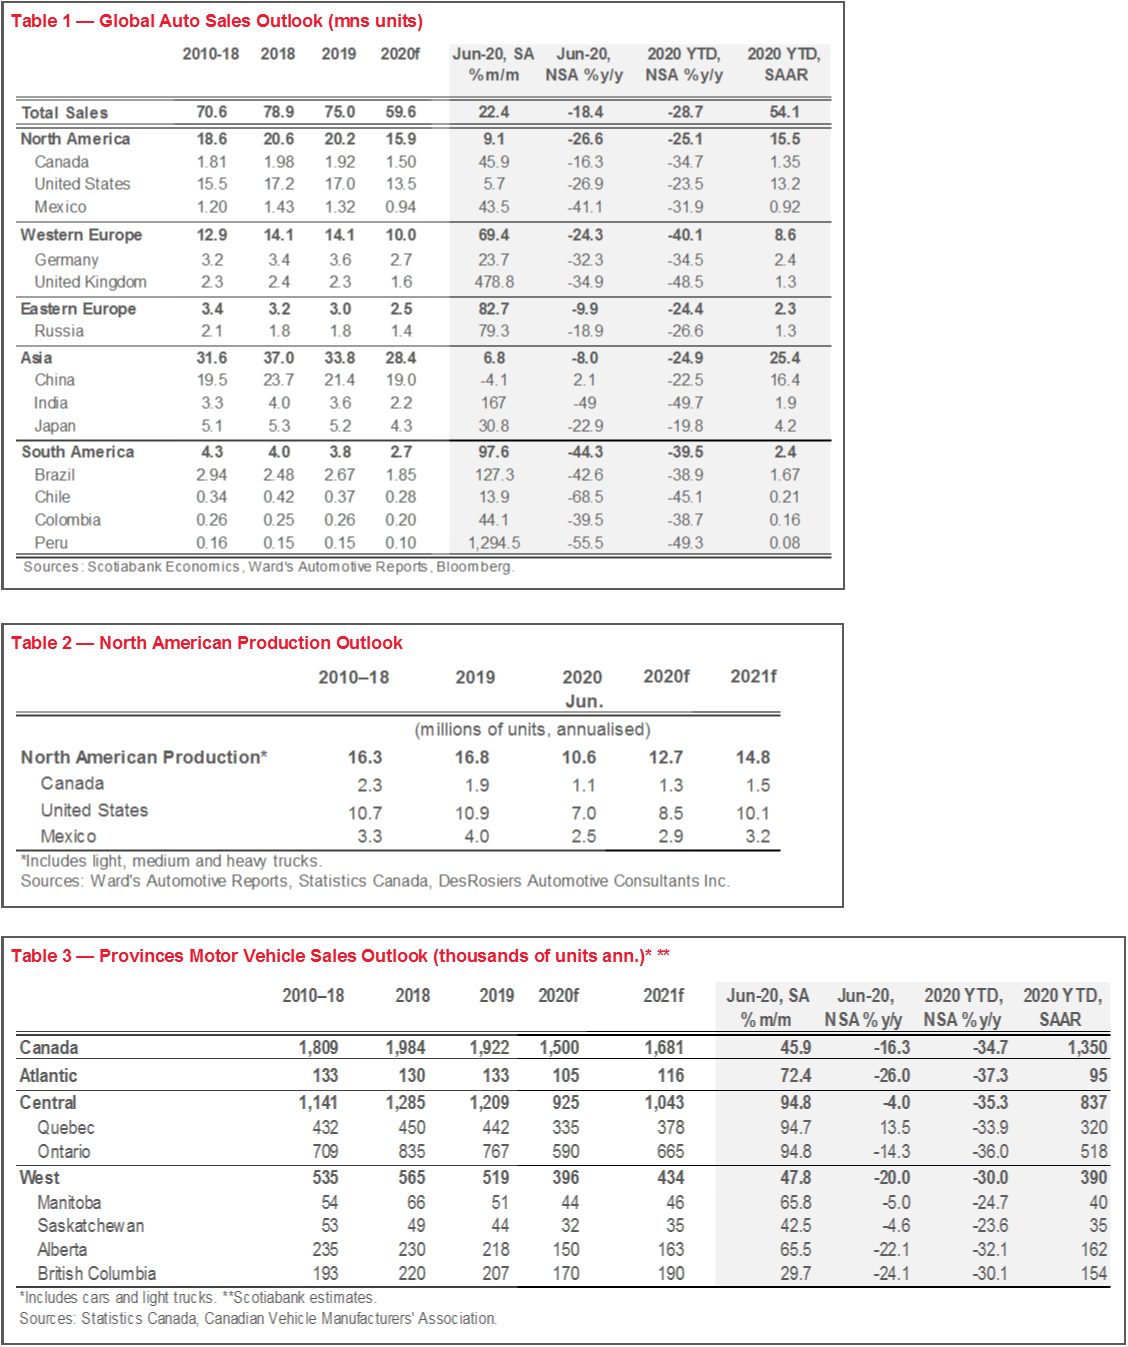
Global auto sales experienced a pick-up in activity for a second consecutive month in June. Global annualised sales were 51 mn units in June. This still represents a decline of -18% y/y, but a +22% pick-up on a month-over-month basis. At the mid-point of the year, sales sit at -29%. We expect sales activity to continue to trend positively over the second half of the year with forecasted sales activity of 59 mn units for 2020, reflecting an estimated -20% y/y decline (chart 1).

Headline global numbers mask an uneven recovery across countries and regions (chart 2). China continues to drive the recovery with temporal factors at play (with earlier re-openings), as well as structural factors such as low vehicle ownership that should continue to support a stronger rebound. At mid-year, China’s sales stood at -22% ytd, whereas we expect activity to continue to pick up to close the year at 19 mn units (-11% y/y). There is some policy upside potential should the government introduce targeted purchase incentives.

Auto sales activity in other Asia Pacific countries has also pivoted. Japan saw its first acceleration in sales activity since the pandemic hit with a 31% m/m increase in activity in June (-23% y/y), albeit an anemic rebound considering lockdown measures were lifted at the end of May. With new outbreaks in Tokyo, the rebound may be fragile in the near-term. Frontier markets including India and Indonesia also experienced turn-arounds with activity booming by 167% m/m and 315% m/m, respectively, though both countries still sit significantly in negative territory on a year-over-year basis (-49% for India and -80% for Indonesia).
European markets are showing signs of rebound. Year-to-date sales sit -40% y/y but this is dominated by hardest-hit countries including the UK, Italy, Spain, and Portugal where mid-year sales are down closer to -50% y/y (in contrast to Germany and France where sales stand at -35% and -39%, respectively). But clear signs of rebound are evident on a month-over-month basis with the UK, for example, posting a 487% m/m increase in activity while the others fall in a still-healthy range of 50 ̶120% m/m. Moving eastward, Russia continues to defy expectations despite escalating COVID-19 cases with a pick-up in sales of 79% m/m (-19% y/y). New EU stimulus measures should reinforce optimism around the economic rebound, but emissions regulations will likely continue to act as a dampening force this year.
North American auto sales also continue to trend upward but at variable speeds. Mid-year sales stand at -25% ytd, on par with Asia Pacific in terms of the ‘least-affected’ regions. Canada, on the one end, is experiencing a strong rebound following a relatively steep April contraction as a result of more stringent lockdown measures. Sales are down -35% ytd but should continue to improve in the second half of the year. Less-rigorous shutdowns in the US minimized sales losses at the peak of shutdowns in April, but the acceleration of activity in the rebound is also relatively weaker. It remains positive nonetheless with year-to-date sales sitting at -24% despite mounting COVID-19 cases across large parts of the country. Meanwhile, Mexico suffered a steep retrenchment at the onset of the pandemic and faces an anemic recovery against mounting cases, though June sales activity picked up speed (43% m/m versus 15% m/m in May) with sales down by -32% mid-year.
Many other Latin American countries—like Mexico—continue to face ongoing challenges related to the pandemic. Regional sales are down by -40% ytd placing it among the hardest-hit regions around the world. But a rebound is underway, led by Peru’s reopening that fueled an astronomical +1,300% m/m increase in sales (but still -56% y/y). Brazil posted a 127% m/m improvement (-38% y/y), followed by Colombia (44% m/m, -39% y/y). Chile also showed more modest signs of recovery (14% m/m, -68% y/y).
DOES MACRO MATTER?
Pandemic-related factors are arguably driving economic outcomes in the near term. The stringency and duration of the lockdowns have influenced the pace and depth of the decline in auto sales around the world, while the rebound is largely a mathematical function of climbing out of that abyss. While idiosyncratic domestic vulnerabilities come into play for some countries, for the most part traditional macro economic drivers are dwarfed by the impacts of these pandemic-related drivers of activity.
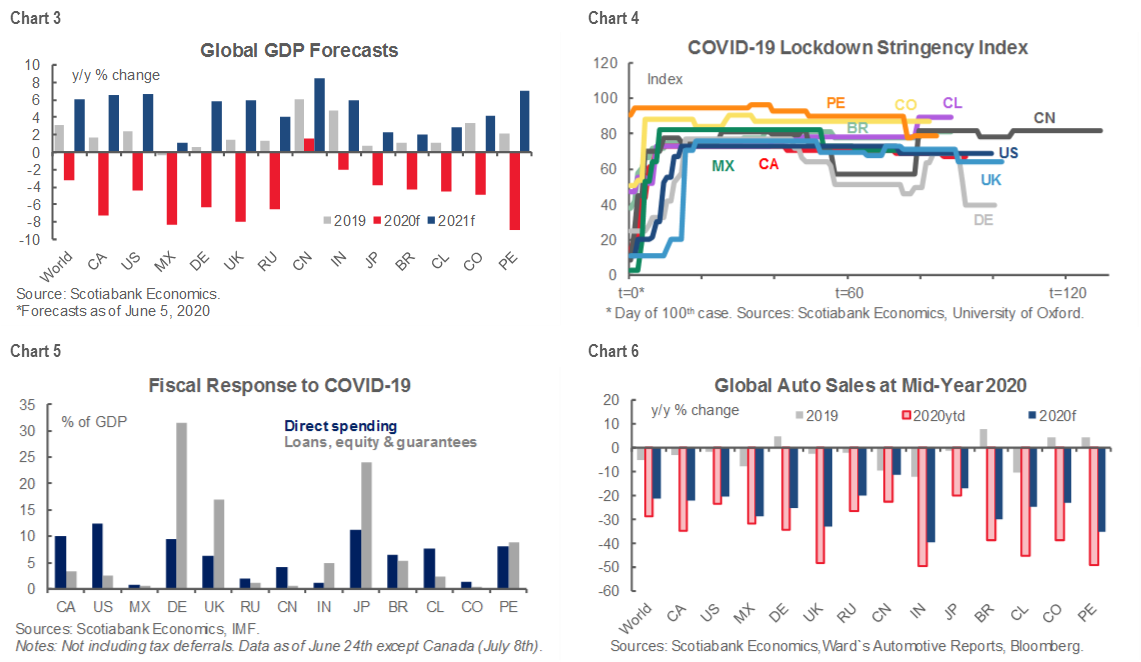
The size and effectiveness of government support influences the slope of the recovery. Governments around the world have injected unprecedented amounts of support into local economies, with fiscal support amounting to an estimated USD11 tn and central bank liquidity another USD6 tn (and counting), according to the IMF. An NBER paper estimates that unemployment support in the US exceeded prior earnings for over two-thirds of workers while doubling them for the lowest-paid workers. Similarly, Canada’s recent fiscal update suggests its income replacement program has exceeded aggregate earnings shortfalls by about 20%. Not surprisingly, retail sales in Canada and the US have benefited from stronger-than-anticipated rebounds so far, including automotive purchases.
Charts 3–6 illustrate relative differences across countries with respect to their economic outlook, the size of policy support in response to the pandemic, the stringency of lock-down measures, as well as auto sales performance and outlooks.
A REBOUND IS A REBOUND
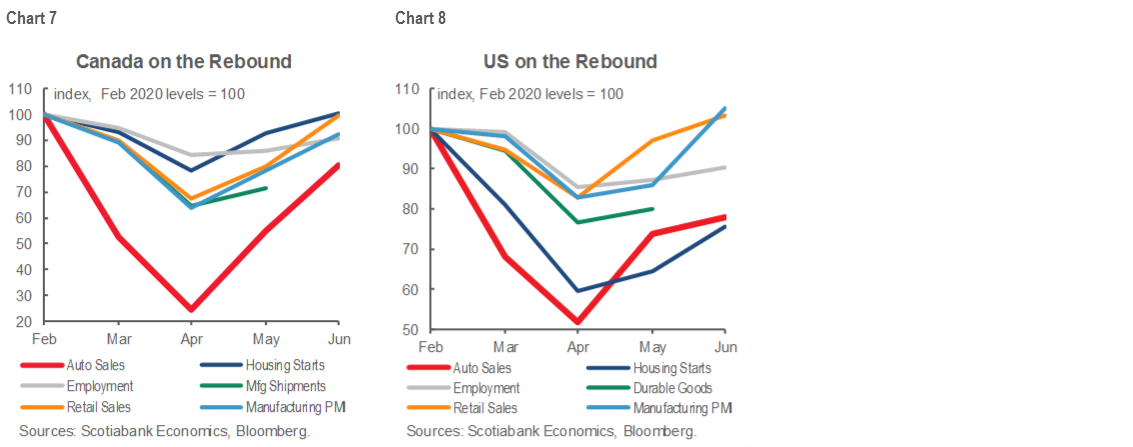
The strength of the economic rebound in markets such as Canada and the US continues to surprise on the upside. This holds across most indicators ranging from housing starts to job growth to durable goods shipments among other indicators of re-ignited activity. June sales activity is discussed here. In Canada, the strength of auto sales surpasses other traditional signs of activity including broader retail sales, job growth, manufacturing activity and sentiment (chart 7). It is even stronger when fleet sales are netted out of total vehicle sales for June in Canada. Retail sales stood in positive territory for June, as the recovery in fleet sales continues to trail retail (preliminary estimates indicate fleet is down around -50% ytd). Preliminary data suggests July sales will continue this trend. The US auto sales rebound is broadly in line with other indicators through June (chart 8) .
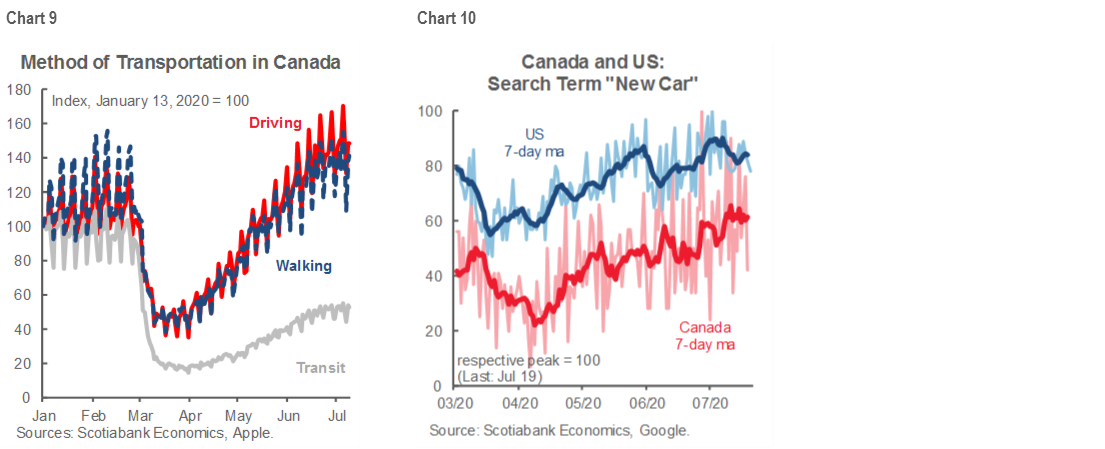
As the pandemic unfolded, there were some concerns that the nature of the crisis could dampen new vehicle demand beyond traditional economic drivers. For example, vehicle use dropped sharply which should extend the vehicle’s lifetime (chart 9). Some hypothesized that greater remote-work could encourage downsizing in vehicle ownership. These trends are not yet playing out in data but could transpire over the medium term.
The pandemic may have created new demand that is bolstering the rebound. The Conference Board continues to report upticks in new vehicle purchase intentions among American consumers with a 0.4 ppt increase in June. CarGurus has recently updated its Canadian consumer intentions survey in June, reporting that 21% of current and prospective buyers in 2020 had not planned to buy a car before the pandemic (up from 16% in April). It also indicates that 32% of respondents intend to use their vehicle more going forward than before the pandemic which is starting to play out in data with driving exceeding pre-pandemic levels (also Chart 9, not seasonally adjusted). High-frequency data corroborates these intentions with Google Trends showing renewed interest in auto purchase queries since ebbing at the onset of the pandemic (chart 10).
This rebound could reasonably continue over the summer months. Income supports in Canada have already been extended through to the end of summer (and could very well continue beyond in some form). US household stimulus measures have largely been exhausted but could potentially be renewed in the lead-up to the Presidential elections. In both countries, a drawdown in savings rates could further support the rebound in the coming months. US household savings rates quadrupled at the peak of shutdowns in April relative to pre-pandemic levels, while Canada’s near-doubled by the end of March (latest available) relative to end-December. Arguably, these were ‘forced’ savings given the inability to spend during lockdowns versus precautionary savings, though the unwinding of these balances will depend more so on the latter in terms of consumer sentiment.
NOT WITHOUT HEADWINDS
There is a risk however that the rebound in US auto sales could stall temporarily. There are some high-frequency reports such as FourEyes that suggest a pull-back in July sales could be anticipated. Employment benefits will expire at the end of July and are not high on the list of consensus items for renewal across parties in the US. Meanwhile, consumer sentiment soured in the first half of July according to the University of Michigan with a resurgence of COVID-19 outbreaks that accelerated towards the end of June.
Price pressures may also dampen demand as supply is still lagging the rebound in demand. This is at least evident for popular market segments—most notably some SUVs—despite reports of some production facilities operating three daily shifts. Production still sits below pre-pandemic levels (chart 11) with Wards Automotive reporting that US inventory showed little improvement at the end of June at -33% y/y (similar to end-May levels). This may reduce the need for incentive spending as long as supply is trailing demand. Meanwhile, production ramp-ups face the threat of further disruptions owing to possible outbreaks, while physical distancing measures impose an efficiency tax on production.

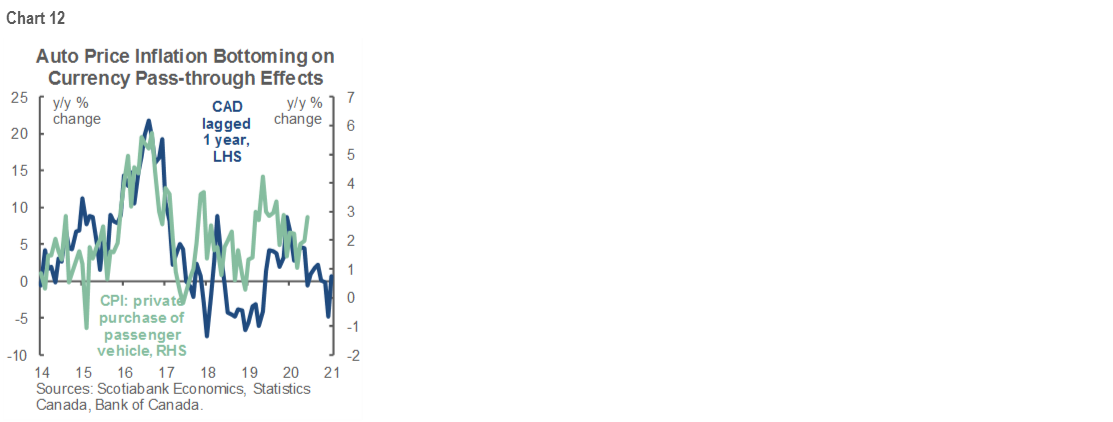
In Canada, lagging effects in pricing from last year’s CAD appreciation could soften prices if historic patterns hold (chart 12). But June’s inflation print reported an uptick in auto CPI suggesting aforementioned effects may be dominating, while the pandemic has once again weakened the CAD. Meanwhile, almost half of respondents in the CarGurus survey felt less confident about their ability to afford a vehicle as a result of the pandemic. Similarly, a recent Angus Reid survey in June showed that over half of Canadians felt it was a bad time to make major purchases such as homes or autos, though the same survey found 80% of Canadians felt their financial situation is “good” or “great” (up 7 ppts from April). Interest rate pass-through should continue to offset some of these pressures over the course of the economic recovery with rates expected to stay low.
MACRO MATTERS
Traditional economic factors will likely increasingly weigh on sales activity towards the end of the year and into 2021. This includes still-elevated unemployment levels and a broad-based dampening of demand with global GDP set to decline by -3.2% in 2020. Auto sales in both the US and Canada had already peaked cyclically with sales-highs in 2016 through 2018. Pre-pandemic auto sales for 2020 were expected to be largely flat. It is too early to suggest that a structural shift in vehicle ownership is underway so we remain conservative in our auto sales outlook in line with the longer term economic recovery.
*All numbers reported are not seasonally adjusted (nsa), unless otherwise indicated (sa).
DISCLAIMER
This report has been prepared by Scotiabank Economics as a resource for the clients of Scotiabank. Opinions, estimates and projections contained herein are our own as of the date hereof and are subject to change without notice. The information and opinions contained herein have been compiled or arrived at from sources believed reliable but no representation or warranty, express or implied, is made as to their accuracy or completeness. Neither Scotiabank nor any of its officers, directors, partners, employees or affiliates accepts any liability whatsoever for any direct or consequential loss arising from any use of this report or its contents.
These reports are provided to you for informational purposes only. This report is not, and is not constructed as, an offer to sell or solicitation of any offer to buy any financial instrument, nor shall this report be construed as an opinion as to whether you should enter into any swap or trading strategy involving a swap or any other transaction. The information contained in this report is not intended to be, and does not constitute, a recommendation of a swap or trading strategy involving a swap within the meaning of U.S. Commodity Futures Trading Commission Regulation 23.434 and Appendix A thereto. This material is not intended to be individually tailored to your needs or characteristics and should not be viewed as a “call to action” or suggestion that you enter into a swap or trading strategy involving a swap or any other transaction. Scotiabank may engage in transactions in a manner inconsistent with the views discussed this report and may have positions, or be in the process of acquiring or disposing of positions, referred to in this report.
Scotiabank, its affiliates and any of their respective officers, directors and employees may from time to time take positions in currencies, act as managers, co-managers or underwriters of a public offering or act as principals or agents, deal in, own or act as market makers or advisors, brokers or commercial and/or investment bankers in relation to securities or related derivatives. As a result of these actions, Scotiabank may receive remuneration. All Scotiabank products and services are subject to the terms of applicable agreements and local regulations. Officers, directors and employees of Scotiabank and its affiliates may serve as directors of corporations.
Any securities discussed in this report may not be suitable for all investors. Scotiabank recommends that investors independently evaluate any issuer and security discussed in this report, and consult with any advisors they deem necessary prior to making any investment.
This report and all information, opinions and conclusions contained in it are protected by copyright. This information may not be reproduced without the prior express written consent of Scotiabank.
™ Trademark of The Bank of Nova Scotia. Used under license, where applicable.
Scotiabank, together with “Global Banking and Markets”, is a marketing name for the global corporate and investment banking and capital markets businesses of The Bank of Nova Scotia and certain of its affiliates in the countries where they operate, including, Scotiabanc Inc.; Citadel Hill Advisors L.L.C.; The Bank of Nova Scotia Trust Company of New York; Scotiabank Europe plc; Scotiabank (Ireland) Limited; Scotiabank Inverlat S.A., Institución de Banca Múltiple, Scotia Inverlat Casa de Bolsa S.A. de C.V., Scotia Inverlat Derivados S.A. de C.V. – all members of the Scotiabank group and authorized users of the Scotiabank mark. The Bank of Nova Scotia is incorporated in Canada with limited liability and is authorised and regulated by the Office of the Superintendent of Financial Institutions Canada. The Bank of Nova Scotia is authorised by the UK Prudential Regulation Authority and is subject to regulation by the UK Financial Conduct Authority and limited regulation by the UK Prudential Regulation Authority. Details about the extent of The Bank of Nova Scotia's regulation by the UK Prudential Regulation Authority are available from us on request. Scotiabank Europe plc is authorised by the UK Prudential Regulation Authority and regulated by the UK Financial Conduct Authority and the UK Prudential Regulation Authority.
Scotiabank Inverlat, S.A., Scotia Inverlat Casa de Bolsa, S.A. de C.V., and Scotia Derivados, S.A. de C.V., are each authorized and regulated by the Mexican financial authorities.
Not all products and services are offered in all jurisdictions. Services described are available in jurisdictions where permitted by law.