CANADA: AUTO SALES SOFTEN FURTHER FROM STRONG FIRST HALF OF 2025
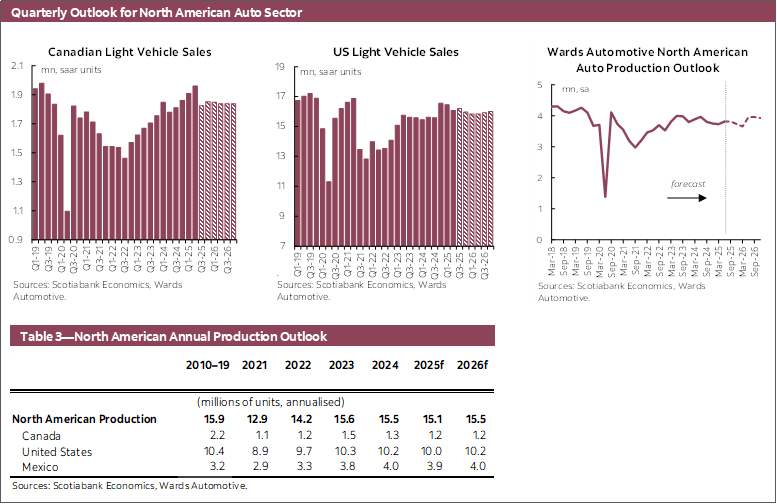
Canadian auto sales slowed in August to 1.76 mn units (-7.3% month-over-month) at a seasonally adjusted annualized rate (SAAR) according to Wards Automotive (chart 1). Auto sales continue to pull back from their tariff front-running spring surge, having declined in three of the past four months in seasonally adjusted terms, as headwinds build from tariffs, uncertainty, and slower job growth. While auto sales had a strong start to the year, seasonally adjusted sales have slowed to the lowest level since June 2024, as August’s non-seasonally adjusted sales were down by -3.9% year-over-year.

Recent economic data has shown tariffs are dragging on the Canadian economy earlier than we previously anticipated, leading us to now expect the Bank of Canada to cut the policy rate to 2.25% by the end of 2025 as insurance against further weakening of the outlook. Real GDP contracted in Q2-2025 (-1.6% q/q, SAAR) and the Canadian labour market shed more than 100 k jobs combined across July and August. While annual headline inflation holds below 2% owing to the removal of the consumer carbon tax, measures of core inflation have continued to trend around 2.5% to 3% year-over-year. We expect inflation pressures to persist, leading the BoC to reverse the two 25 basis point cuts in the second half of 2026.
Our outlook for Canadian light vehicle sales is 1.89 mn in 2025 and 1.84 mn in 2026. The automotive sales rate is expected to remain soft through the end of 2025, compared to the spring, as softer labour markets pose headwinds to consumer spending growth.
UNITED STATES: VOLATILE MONTHLY SALES AS TARIFF HEADWINDS BUILD
US auto sales in August fell by -2.9% month-over-month in seasonally adjusted terms to 16.1 mn units at an annualized rate (chart 2). Monthly auto sales in the US have been volatile for much of the year, ranging from a low of 15.3 mn (SAAR) in June to a high of 17.8 mn in April, amid distortions from tariffs and uncertainty. And while recent auto sales are down from the temporary surge across March and April, the 16.5 mn and 16.1 mn sales rate in July and August respectively remain above last year’s annual sales of 15.86 mn, showing more resilience through the summer than previously expected.

Inventory levels have been gradually declining from their recent high in mid-2024 amid persistent auto sales despite the production rate that has improved from the lower level at the turn of the year. In August, US light vehicle inventories are down -8% relative to the Q3-2024 average based on data from Ward’s Automotive.
The impact of broad-based tariffs are also dragging on the US labour market that has added only 107 k jobs from May through August, albeit with the unemployment rate only rising to 4.3% as the labour force growth has also slowed amid stricter immigration policies. US Federal Reserve Chair Powell announced in August that slower US job growth is leading the Fed to focus more on the jobs portion of its dual mandate. We now expect the Fed to resume lowering the policy rate down to 3% by Q2-2026 through a series of 25 bps cuts. However, inflation remains near 3% y/y with risks of persistent inflation pressures from tariffs and supply-chain distortions.
Given the soft labour market, our outlook for US auto sales expects the quarterly sales rate to remain soft through the second half of the year, resulting in 16.2 mn sales in 2025 and 15.9 mn in 2026.
GLOBAL AUTO SALES: JULY SALES IMPROVE AFTER SLOWING TREND
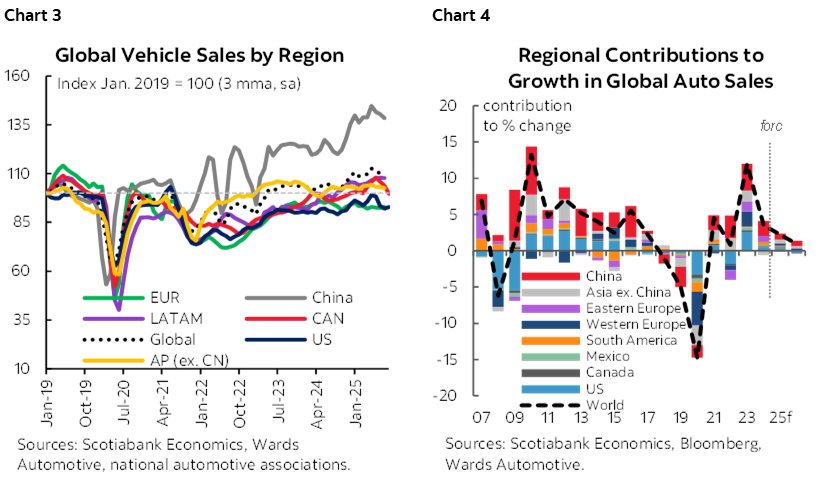
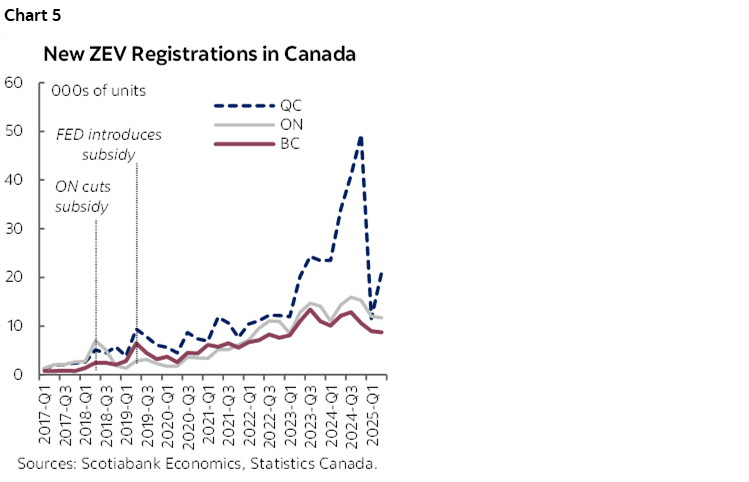
Global auto sales rebounded by 2.8% m/m (SA) in July, supported by strong growth amongst nearly all regions tracked, after having declined in three of the four months prior (chart 3). In western Europe, auto sales increased 5.4% m/m (SA), rising to the highest monthly sales rate since April earlier this year. In eastern Europe, auto sales rose by 12.6% m/m as sales remain soft this year, having only increased twice in the past seven months. In the Asia Pacific region, auto sales marginally declined (-0.5% m/m, SA) as softer sales in China (-1.6%) and Japan (-2.5%) were partially offset by strength in other parts of the region, Seasonally adjusted vehicle sales have slowed to their lowest level since January. In the Latin American region, vehicle sales rebounded by 4.2% m/m in July after having declined by -5.6% in June as sales remain volatile on a monthly basis. Our outlook for global vehicle sales growth is 2.2% in 2025 and 0.9% in 2026, as tariffs and uncertainty pose headwinds towards the global outlook (chart 4).
ELECTRIC VEHICLE SALES: UNCERTAINTY FROM TARIFFS, TARGETS, AND SUPPORTS
New zero emission vehicle (ZEV) sales as a share of new vehicle sales remain soft in July according to data from Statistics Canada. National ZEV sales in 2025 through July are 93.4 k, down by -30.5% year-to-date (ytd), compared to a 5.2% ytd increase for all vehicle registrations according to the same source. ZEV sales as a share of total vehicle sales eased to 7.7% in July, in line with the 7.8% share in Q2-2025 but down from 12.3% the same quarter last year and the recent quarterly peak of 16.6% in Q4-2024.
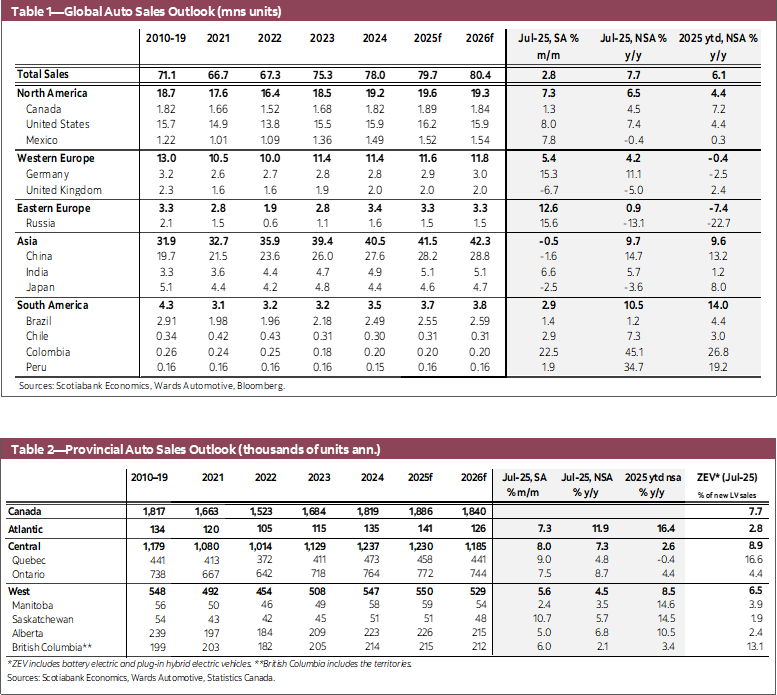
In Quebec, the largest ZEV market by volume, the share of ZEV sales has increased to 16.6% in July, up from 15% in Q2, aided by the return of the provincial Roulez-Vert program, albeit at a lower dollar amount compared to last year. Nevertheless, the 38.7 k ZEV registrations through July are down by -43.7% ytd compared to mostly flat (-0.4% ytd) overall new sales (chart 5).
In Ontario, the second largest ZEV market by volume, ZEV sales through the first seven months have slowed to 25.6 k (-14.7% ytd) compared to a 4.4% ytd increase for all new vehicles, with July’s ZEV share at 4.9%, down from 8.4% in Q4 and 6.8% in Q2 last year. In B.C. and the territories, the third largest ZEV market by volume, this year’s 18.9 k ZEV sales (-24.4% ytd) through July has slowed compared to growth in total new vehicle sales (3.4% ytd), with the ZEV share at 13.1% in July, down from 20.7% in annual 2024.
In the Atlantic region, Newfoundland and Labrador, Prince Edward Island, Nova Scotia, and New Brunswick, ZEV sales through July have slowed to 3.7 k (-4.2% ytd), with the 2.8% share down from 6.2% peak in Q4. This year’s ZEV sales in Alberta, Manitoba, and Saskatchewan have combined for 6.5 k (-4.2% ytd) while the provinces’ total vehicle sales are up 11.8% (ytd), with the ZEV share declining to 2.9% in July, down from 4.8% in Q4 and 3.7% in Q2-2024.
In addition to volatile developments from tariffs, Canada’s automotive sector also faces uncertainty around the ZEV sales target and whether or not the federal iZEV consumer subsidy will return. On September 5th, Prime Minister Carney announced that the federal government would be removing the 2026 target from the Electric Vehicle Availability Standard (EVAS). This target for ZEVs to account for at least 20% of total new motor vehicle sales in 2026 was the first interim target on the path towards 100% ZEV sales by 2035. PM Carney also announced a 60-day review of the EVAS regulation, leaving the door open to potential changes around the annual sales targets, and plans to “explore options to bring more affordable electric vehicles to Canada.” Furthermore, there remains large uncertainty around whether or not the federal iZEV program will return and, if so, when it will return. The federal government is expected to announce an “austerity” and “investment” fiscal budget November 4th which could show a larger deficit than last year’s fall budget, leaving questions around whether there will be any changes to the iZEV program, if it comes back.
In today’s environment of tariffs, evolving international and trade relationships, and fluctuating policy measures, the federal government can support the automotive sector by clearly laying out a blueprint for what further changes in local regulations and fiscal measures, if any, they plan to make thereby reducing at least some of the elevated uncertainty that has been rampant this year for businesses and consumers.
DISCLAIMER
This report has been prepared by Scotiabank Economics as a resource for the clients of Scotiabank. Opinions, estimates and projections contained herein are our own as of the date hereof and are subject to change without notice. The information and opinions contained herein have been compiled or arrived at from sources believed reliable but no representation or warranty, express or implied, is made as to their accuracy or completeness. Neither Scotiabank nor any of its officers, directors, partners, employees or affiliates accepts any liability whatsoever for any direct or consequential loss arising from any use of this report or its contents.
These reports are provided to you for informational purposes only. This report is not, and is not constructed as, an offer to sell or solicitation of any offer to buy any financial instrument, nor shall this report be construed as an opinion as to whether you should enter into any swap or trading strategy involving a swap or any other transaction. The information contained in this report is not intended to be, and does not constitute, a recommendation of a swap or trading strategy involving a swap within the meaning of U.S. Commodity Futures Trading Commission Regulation 23.434 and Appendix A thereto. This material is not intended to be individually tailored to your needs or characteristics and should not be viewed as a “call to action” or suggestion that you enter into a swap or trading strategy involving a swap or any other transaction. Scotiabank may engage in transactions in a manner inconsistent with the views discussed this report and may have positions, or be in the process of acquiring or disposing of positions, referred to in this report.
Scotiabank, its affiliates and any of their respective officers, directors and employees may from time to time take positions in currencies, act as managers, co-managers or underwriters of a public offering or act as principals or agents, deal in, own or act as market makers or advisors, brokers or commercial and/or investment bankers in relation to securities or related derivatives. As a result of these actions, Scotiabank may receive remuneration. All Scotiabank products and services are subject to the terms of applicable agreements and local regulations. Officers, directors and employees of Scotiabank and its affiliates may serve as directors of corporations.
Any securities discussed in this report may not be suitable for all investors. Scotiabank recommends that investors independently evaluate any issuer and security discussed in this report, and consult with any advisors they deem necessary prior to making any investment.
This report and all information, opinions and conclusions contained in it are protected by copyright. This information may not be reproduced without the prior express written consent of Scotiabank.
™ Trademark of The Bank of Nova Scotia. Used under license, where applicable.
Scotiabank, together with “Global Banking and Markets”, is a marketing name for the global corporate and investment banking and capital markets businesses of The Bank of Nova Scotia and certain of its affiliates in the countries where they operate, including; Scotiabank Europe plc; Scotiabank (Ireland) Designated Activity Company; Scotiabank Inverlat S.A., Institución de Banca Múltiple, Grupo Financiero Scotiabank Inverlat, Scotia Inverlat Casa de Bolsa, S.A. de C.V., Grupo Financiero Scotiabank Inverlat, Scotia Inverlat Derivados S.A. de C.V. – all members of the Scotiabank group and authorized users of the Scotiabank mark. The Bank of Nova Scotia is incorporated in Canada with limited liability and is authorised and regulated by the Office of the Superintendent of Financial Institutions Canada. The Bank of Nova Scotia is authorized by the UK Prudential Regulation Authority and is subject to regulation by the UK Financial Conduct Authority and limited regulation by the UK Prudential Regulation Authority. Details about the extent of The Bank of Nova Scotia's regulation by the UK Prudential Regulation Authority are available from us on request. Scotiabank Europe plc is authorized by the UK Prudential Regulation Authority and regulated by the UK Financial Conduct Authority and the UK Prudential Regulation Authority.
Scotiabank Inverlat, S.A., Scotia Inverlat Casa de Bolsa, S.A. de C.V, Grupo Financiero Scotiabank Inverlat, and Scotia Inverlat Derivados, S.A. de C.V., are each authorized and regulated by the Mexican financial authorities.
Not all products and services are offered in all jurisdictions. Services described are available in jurisdictions where permitted by law.