- Chile: September CPI at 0.4% m/m (4.4% y/y)—no surprise for the market
- Colombia: September inflation at 5.18% exceeds expectations
CHILE: SEPTEMBER CPI AT 0.4% M/M (4.4% Y/Y)—NO SURPRISE FOR THE MARKET
- Concerns arise from the broad-based increase in goods prices (historical high) and the consecutive price adjustability. The exchange rate is not helping (yet).
On Wednesday, October 8th, the INE released September’s CPI, which rose 0.4% m/m, in line with our forecast and market forwards, but representing a favourable surprise in core inflation relative to the scenario outlined in the BCCh’s September Monetary Policy Report (IPoM). Core CPI (excluding volatiles) also posted 0.4% m/m (3.9% y/y), with goods up 0.6% m/m (3.2% y/y) and services rising 0.2% m/m (4.5% y/y). Volatile items increased 0.5% m/m (5.1% y/y), also matching our point estimate.
The rise in goods prices pushed CPI inflationary diffusion to 63.6%, near historical highs for the month, a level not seen since 2022 (chart 1). While we anticipated a rebound in diffusion indicators due to pre-Cyber Day price adjustments seen in previous years, price increases were more widespread, consistent with a depreciated exchange rate in recent weeks and rising labour costs amid a recovery in consumption.
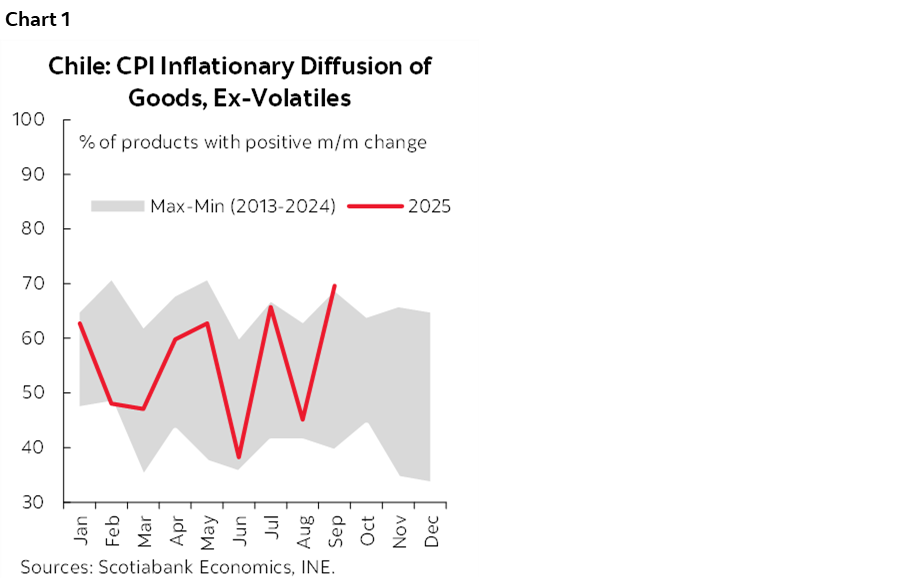
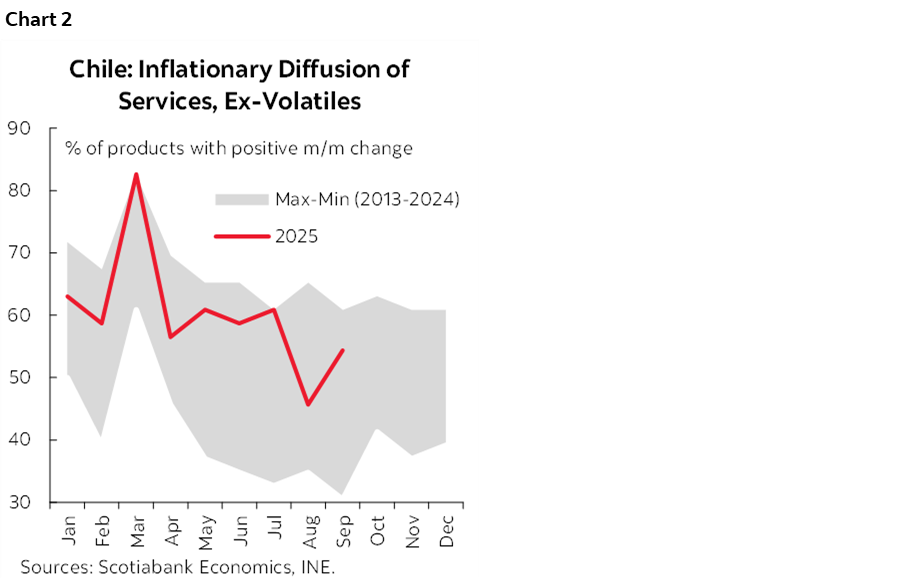
More concerning is the diffusion of non-volatile goods prices, which reached a historical high for the month, posing a risk in a context where labour costs continue to rise and the currency does not reflect Chile’s improved cyclical and political outlook. Services also showed a renewed uptick, returning to the upper end of their historical range (chart 2). Reinforcing our concern over goods, the share of items in the basket that have undergone consecutive price adjustments over the past three months has increased. Most relevant is the uptrend in non-volatile items showing persistent adjustability. This dynamic offsets the favourable surprise in inflation relative to the September IPoM.
A December rate cut remains on the table, but concerns persist over the rising price adjustability, especially among non-volatile items (and, within them, goods). As noted, September’s CPI surprised positively relative to the IPoM scenario, both headline and core. The central bank projected average inflation for Q3 at 4.3% y/y (actual: 4.2%), assuming a September CPI of 4.5% y/y (actual: 4.4%). It also anticipated core CPI at 4.0% y/y for Q3 (actual: 3.9%), assuming a September core CPI of 4.2% y/y (actual: 3.9%). The significant core surprise keeps alive the possibility of a December rate cut, which we at Scotiabank continue to assign a 50% probability, pending upcoming CPI prints. The rising adjustability in the price basket over recent months suggests an attempt to recover margins amid higher labour costs and peso depreciation, in a context of stronger private consumption led by lower-income segments.
October’s Cyber event could bring reversals in goods prices, partially offset by increases in some food items. For October CPI, we project declines in goods and services linked to Cyber Monday, such as electronics, airfares, intercity transport, and travel packages. On the other hand, we expect increases in gasoline prices, seasonal rises in meat and some vegetables, and a notable increase in common expenses due to September holidays and subscription fee hikes announced by some digital content providers.
—Aníbal Alarcón
COLOMBIA: SEPTEMBER INFLATION AT 5.18% EXCEEDS EXPECTATIONS
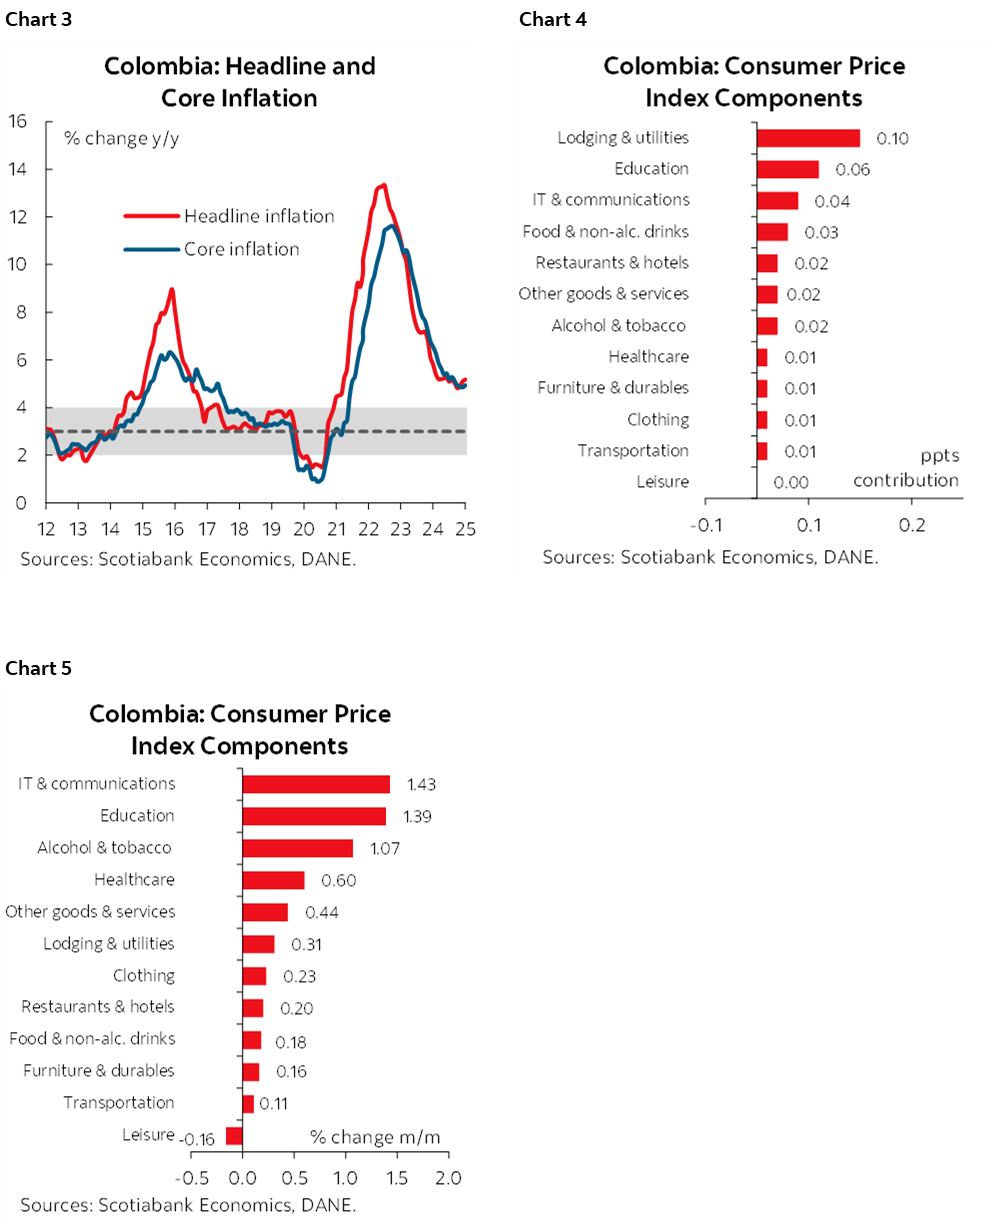
Colombia’s monthly CPI inflation stood at 0.32% m/m in September, according to data published by DANE on Tuesday, October 7th, 2025 (chart 3).This result was above analysts’ expectations in the BanRep survey (0.25% m/m avg) and Scotiabank Colpatria’s forecast (0.28% m/m). During the month, 11 of the 12 consumption groups registered positive monthly variations, with lodging and utilities, education, and IT & communication services contributing the most to total inflation, accounting for 63% (charts 4 and 5).
Annual inflation accelerated from 5.10% to 5.18% in September, continuing the uptrend observed in the previous month. This increase was mainly driven by lodging and utilities which increased by 0.31% m/m, especially due to increases in rent fees that are indexed to last year’s inflation, followed by education services such as primary and secondary tuition (Calendar B) which increased by 1.39% m/m; and, surprisingly, IT & communications services that had not grown since the pandemic and in September had an increase of 1.43% m/m.
Regarding core measures, ex-food inflation increased from 4.85% y/y to 4.94% y/y, while core inflation (excluding food and regulated prices) showed a moderate increase from 4.83% y/y to 4.84% y/y. Services inflation (excluding food and regulated prices) decreased from 5.93% y/y to 5.82% y/y, with rental prices increasing by 5.46% y/y (0.36% m/m). Meanwhile, goods inflation rose from 1.93% to 2.24% y/y, within the target range (2%–4%). Regulated prices increased to 5.29% y/y, mainly due to rebound in utilities’ inflation (3.02% y/y).
These results support our expectation that inflation will likely close well above 5% in 2025. Statistical base effects remain low in areas such as food and regulated prices, particularly in October, posing significant challenges to reducing inflation during the rest of the year. We project year-end inflation at around 5.20% for December 2025, and slightly below 4% for December 2026, however with an upside skew. This trajectory will largely depend on the increase in the minimum wage, as according to public announcements the government supports a double-digit increase, and usually this upside adjustment will impact services prices. If the wage adjustment exceeds the traditional rule of inflation plus productivity, it could skew our inflation forecast to the upside.
Given this context, we discard any interest rate cuts by the central bank for the rest of 2025. We only see the possibility of resuming the easing cycle in 2026, once it is confirmed that indexation effects will not prevent inflation from continuing to decline. In fact we now tend to think that the easing cycle will not resume until the third quarter of 2026.
Other highlights:
- Two groups accounted for 50% of total inflation. Lodging and utilities were the largest contributor with a monthly increase of 0.32% and a contribution of 10 bps. Rental prices increased by 5.46% y/y (0.36% m/m) and contributed the most to total inflation, followed by electricity which grew by 0.52% m/m but continue with a negative trend in annual terms (-2.17% y/y) and reflecting the fact that in 2025 the electricity generation is using hydroelectric sources that are usually cheaper than thermos sources. Education services were the second largest contributors to inflation and registered an increase of 1.39% m/m, contributing 6 bps to the total. Primary (1.98% m/m) and secondary tuition (2.36% m/m) contributed the most to inflation because there are seasonal enrollments in Calendar B schools.
- Other items contributed to inflation. Surprisingly, IT & communication services grew by 1.43% m/m (0.55% y/y) and contributed by 4 bps. This item had not grown since the pandemic in which fixed and mobile communication services increased by 1.6% m/m (2.17% y/y) and was the second one who contributed the most to total inflation. Food and non-alcoholic drinks increased by 0.18% m/m (6.21% y/y) and contributed by 3 bps, in which fruits and meat contributed the most to the item. However, food supply continued with positive numbers and grew by 1.68% m/m (10.63% y/y) in September, that’s the reason why despite landslides on main roads food prices were not significantly affected. In October, food inflation faces a low statistical base as one year ago, monthly inflation was negative by 0.7%, we think this year this phenomenon is difficult to repeat.
- Services inflation slowed down at a moderate pace standing at 5.82%. The reduction was associated to the moderation in some services such as education and leisure. In contrast, goods-related prices increased again to 2.24% y/y, a curious dynamic since in 2025 the FX appreciation could promote more stable prices of tradable goods. Both the stickiness in services and increasing goods inflation are probably reflecting the effect of robust household demand.
—Jackeline Piraján & Valentina Guio
DISCLAIMER
This report has been prepared by Scotiabank Economics as a resource for the clients of Scotiabank. Opinions, estimates and projections contained herein are our own as of the date hereof and are subject to change without notice. The information and opinions contained herein have been compiled or arrived at from sources believed reliable but no representation or warranty, express or implied, is made as to their accuracy or completeness. Neither Scotiabank nor any of its officers, directors, partners, employees or affiliates accepts any liability whatsoever for any direct or consequential loss arising from any use of this report or its contents.
These reports are provided to you for informational purposes only. This report is not, and is not constructed as, an offer to sell or solicitation of any offer to buy any financial instrument, nor shall this report be construed as an opinion as to whether you should enter into any swap or trading strategy involving a swap or any other transaction. The information contained in this report is not intended to be, and does not constitute, a recommendation of a swap or trading strategy involving a swap within the meaning of U.S. Commodity Futures Trading Commission Regulation 23.434 and Appendix A thereto. This material is not intended to be individually tailored to your needs or characteristics and should not be viewed as a “call to action” or suggestion that you enter into a swap or trading strategy involving a swap or any other transaction. Scotiabank may engage in transactions in a manner inconsistent with the views discussed this report and may have positions, or be in the process of acquiring or disposing of positions, referred to in this report.
Scotiabank, its affiliates and any of their respective officers, directors and employees may from time to time take positions in currencies, act as managers, co-managers or underwriters of a public offering or act as principals or agents, deal in, own or act as market makers or advisors, brokers or commercial and/or investment bankers in relation to securities or related derivatives. As a result of these actions, Scotiabank may receive remuneration. All Scotiabank products and services are subject to the terms of applicable agreements and local regulations. Officers, directors and employees of Scotiabank and its affiliates may serve as directors of corporations.
Any securities discussed in this report may not be suitable for all investors. Scotiabank recommends that investors independently evaluate any issuer and security discussed in this report, and consult with any advisors they deem necessary prior to making any investment.
This report and all information, opinions and conclusions contained in it are protected by copyright. This information may not be reproduced without the prior express written consent of Scotiabank.
™ Trademark of The Bank of Nova Scotia. Used under license, where applicable.
Scotiabank, together with “Global Banking and Markets”, is a marketing name for the global corporate and investment banking and capital markets businesses of The Bank of Nova Scotia and certain of its affiliates in the countries where they operate, including; Scotiabank Europe plc; Scotiabank (Ireland) Designated Activity Company; Scotiabank Inverlat S.A., Institución de Banca Múltiple, Grupo Financiero Scotiabank Inverlat, Scotia Inverlat Casa de Bolsa, S.A. de C.V., Grupo Financiero Scotiabank Inverlat, Scotia Inverlat Derivados S.A. de C.V. – all members of the Scotiabank group and authorized users of the Scotiabank mark. The Bank of Nova Scotia is incorporated in Canada with limited liability and is authorised and regulated by the Office of the Superintendent of Financial Institutions Canada. The Bank of Nova Scotia is authorized by the UK Prudential Regulation Authority and is subject to regulation by the UK Financial Conduct Authority and limited regulation by the UK Prudential Regulation Authority. Details about the extent of The Bank of Nova Scotia's regulation by the UK Prudential Regulation Authority are available from us on request. Scotiabank Europe plc is authorized by the UK Prudential Regulation Authority and regulated by the UK Financial Conduct Authority and the UK Prudential Regulation Authority.
Scotiabank Inverlat, S.A., Scotia Inverlat Casa de Bolsa, S.A. de C.V, Grupo Financiero Scotiabank Inverlat, and Scotia Inverlat Derivados, S.A. de C.V., are each authorized and regulated by the Mexican financial authorities.
Not all products and services are offered in all jurisdictions. Services described are available in jurisdictions where permitted by law.