- Chile: Non-mining activity regains momentum in commerce and services, but falls short of the BCCh’s baseline scenario for Q3-25
- Colombia: September unemployment shows signs of recovery, formalization, and gender inclusion
- Peru: October inflation remained unchanged
CHILE: NON-MINING ACTIVITY REGAINS MOMENTUM IN COMMERCE AND SERVICES, BUT FALLS SHORT OF THE CENTRAL BANK’S BASELINE SCENARIO FOR Q3-25
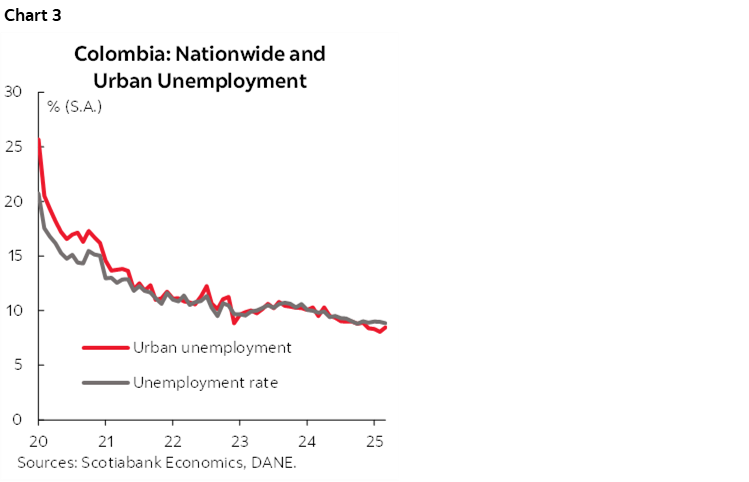
GDP grew 3.2% y/y in September, in line with market consensus expectations but below our point forecast, mainly due to weaker-than-expected performance in services and commerce (chart 1 and 2). Despite this, these sectors contributed the most to the growth in the seasonally adjusted GDP, which expanded 0.2% m/m. On the mining side (+3.2% m/m SA), the sector recovered part of the momentum lost in previous months due to temporary factors, with no surprises relative to our expectations. With these figures, GDP would have grown 1.8% y/y in the third quarter, below the 2.5% projected by the Central Bank in the September Monetary Policy Report (MPR).
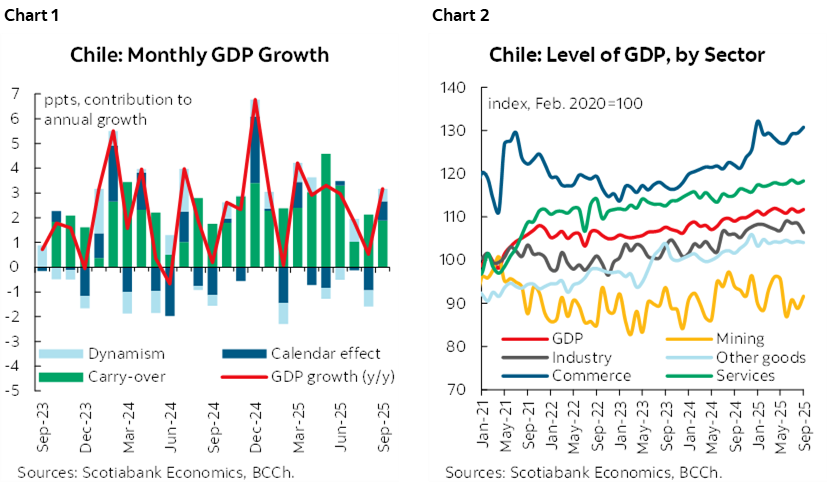
The 2025 carry-over stood at 2.2 ppts as of September. This means that if activity shows no further momentum in the coming months, GDP growth in 2025 would reach 2.2%. At Scotia, we continue to observe a marginal recovery in investment, especially in imports, wholesale trade (machinery and equipment), investment-related services, and construction indicators. In this context, we estimate that activity will show positive momentum in Q4-25, which would allow for 2.5% growth this year. For now, growth scenarios above 2.5% would require a stronger acceleration in activity, which we consider unlikely.
Positive seasonal effect, in line with expectations. The contribution to the year-on-year variation of total GDP was 0.8 percentage points, largely due to two additional business days in September compared to the previous year—an effect we anticipated at Scotia and which came as no surprise to our forecast. Along the same lines, it is worth noting that the fourth quarter will have the same number of business days as last year, so the calendar effect on the year-on-year variation of GDP should be limited.
—Aníbal Alarcón
COLOMBIA: SEPTEMBER UNEMPLOYMENT SHOWS SIGNS OF RECOVERY, FORMALIZATION, AND GENDER INCLUSION
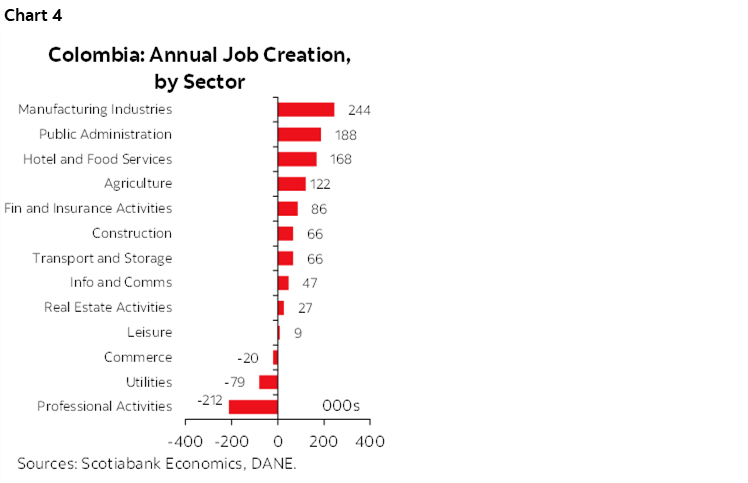
On October 31st, DANE published labour market data for September 2025. The national unemployment rate stood at 8.2%, down 1.0 percentage points (ppts) from the 9.2% recorded in September 2024 (chart 3). Urban unemployment showed the most significant improvement falling from 9.2% in September 2024 to 8.1% in the latest data. Moreover, in rural areas, the unemployment rate decreased by 0.4 ppts, reaching 5.5%. In its seasonally adjusted series, national unemployment continued its downtrend, decreasing by 0.1 ppts to 8.8%.
The labour force participation rate showed an increase of 0.4 ppts, reaching 63.9%. This rise was driven by the entry of over 500 thousand individuals into the labour market, primarily women, whose participation rate increased by 0.8 ppts to 52.7%. However, the overall participation rate remains below pre-pandemic levels, indicating that there is still potential for further labour market entry. The impact on unemployment will depend on the absorption capacity of new job positions.
During the period, there was an acceleration in job creation, with 714 thousand new jobs generated (+3.1% y/y). This marked an increase compared to the 393 thousand jobs created in August, with urban areas contributing 42% of the total employment generated. Additionally, women accounted for 74% (+529 thousand) of the new jobs, which led to a year-over-year reduction of 2.1 ppts in the unemployment gap between men and women. Unemployment stood at 7.1% for men and 9.6% for women, this one returning to single-digit levels for the first time since 2017.
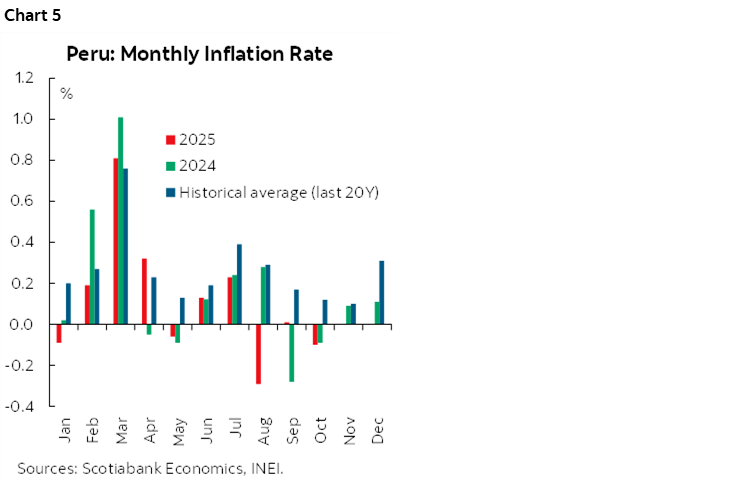
By sector (chart 4), manufacturing (+244 thousand), public administration (+188 thousand), hotel and food services (+167 thousand), and agriculture (+122 thousand) were the main contributors to job creation. These sectors saw higher hiring rates among women, particularly in public administration, followed by accommodation and food services. Meanwhile, agriculture—a sector closely tied to rural areas—experienced an expansion of 122 thousand jobs. In contrast, structurally formal sectors such as professional activities saw a loss of 212 thousand jobs, followed by utilities (-79 thousand) and commerce (-20 thousand).
Labour informality decreased to 54.5% at the national level. Between September 2024 and 2025, approximately 77% of the jobs created were formal, mainly in urban areas of the country. Even in rural areas—which recorded an informality rate of 84.3% (-0.4 ppts year-over-year)—there was progress in formal employment, contrasting with the decline in informal jobs. This trend aligns with the 2.1 ppts drop in labour informality within the agricultural sector, reaching 86.6%. The sectors with informality rates below the national average include financial activities (9.3%), public administration (11.2%), and real estate activities (15.7%).
The average unemployment rate is expected to decline from 10.2% in 2024 to 9.4% in 2025, supported by stronger labour force participation and a faster pace of job creation. However, a lower unemployment rate cannot be ruled out, depending on how effectively the economy absorbs new labour market entrants. The implementation of certain aspects of the labour reform will also be a key factor to monitor in the coming months, along with future minimum wage decisions, which could increase the share of informal employment in the economy.
For now, employment data is not a major concern for BanRep. However, the improvement in employment, combined with the historic inflow of workers’ remittances, is reflected in the growth of domestic demand—particularly household consumption—which could signal inflationary pressures in the medium and long term. Such robust figures support our call for rate stability at 9.25% for the remainder of 2025.
—Jackeline Piraján & Valentina Guio
PERU: OCTOBER INFLATION REMAINED UNCHANGED
Inflation report for Peru was released last Saturday. Headline inflation declined by 0.10% m/m in October (chart 5), contrary to the slight increase anticipated by the Bloomberg analysts’ consensus. However, we had already anticipated a negative reading. This monthly figure deviates from the 20-year historical average (+0.12%) but was similar to the rate recorded in October 2024 (-0.09%). Consequently, annual inflation remained unchanged at 1.4%.
At a disaggregated level, the main downward contributions during the month came from three categories:
- Food and non-alcoholic beverages (-0.42%), mainly due to a significant drop in chicken egg prices (-8.7%) and the continued correction in fish prices (-20.2%).
- Electricity (-0.9%) reflecting lower tariffs in a context of a stronger PEN.
- Communications (-1.1%), driven by a reduction in telephone tariff.
Core inflation—which excludes food and energy—rose slightly by 0.04% m/m in October. This figure was below the 20-year historical average (+0.15%) and the rate recorded in October 2024 (+0.08%). On an annual basis, core inflation remained unchanged in 1.8%, marking seven consecutive months below the midpoint of the target range.
Preliminarily, we estimate that annual headline inflation will continue to remain around 1.4%. In November, the base effect observed in the previous two months will no longer be present. Moreover, the pressures for a significant increase in prices remain very weak. Accordingly, we are now viewing our year-end forecast of 1.9% with a downward bias.
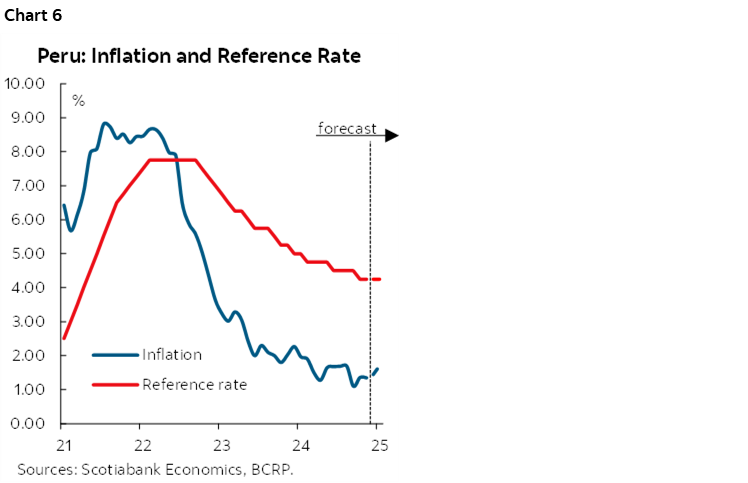
Regarding the BCRP’s interest rate, we expect no adjustments to be made during the upcoming meeting on November 13th, with the rate remaining at its current level (4.25%) through next year under our baseline scenario. We see a certain probability of an additional 25 basis point cut in 2026 (chart 6), but this will depend on whether the BCRP decides to lower its neutral rate (currently at 2.0%) in a context of weak inflationary pressures, or if inflation expectations fall to 2.0%—a level that has historically shown strong resistance to decline.
—Ricardo Avila
DISCLAIMER
This report has been prepared by Scotiabank Economics as a resource for the clients of Scotiabank. Opinions, estimates and projections contained herein are our own as of the date hereof and are subject to change without notice. The information and opinions contained herein have been compiled or arrived at from sources believed reliable but no representation or warranty, express or implied, is made as to their accuracy or completeness. Neither Scotiabank nor any of its officers, directors, partners, employees or affiliates accepts any liability whatsoever for any direct or consequential loss arising from any use of this report or its contents.
These reports are provided to you for informational purposes only. This report is not, and is not constructed as, an offer to sell or solicitation of any offer to buy any financial instrument, nor shall this report be construed as an opinion as to whether you should enter into any swap or trading strategy involving a swap or any other transaction. The information contained in this report is not intended to be, and does not constitute, a recommendation of a swap or trading strategy involving a swap within the meaning of U.S. Commodity Futures Trading Commission Regulation 23.434 and Appendix A thereto. This material is not intended to be individually tailored to your needs or characteristics and should not be viewed as a “call to action” or suggestion that you enter into a swap or trading strategy involving a swap or any other transaction. Scotiabank may engage in transactions in a manner inconsistent with the views discussed this report and may have positions, or be in the process of acquiring or disposing of positions, referred to in this report.
Scotiabank, its affiliates and any of their respective officers, directors and employees may from time to time take positions in currencies, act as managers, co-managers or underwriters of a public offering or act as principals or agents, deal in, own or act as market makers or advisors, brokers or commercial and/or investment bankers in relation to securities or related derivatives. As a result of these actions, Scotiabank may receive remuneration. All Scotiabank products and services are subject to the terms of applicable agreements and local regulations. Officers, directors and employees of Scotiabank and its affiliates may serve as directors of corporations.
Any securities discussed in this report may not be suitable for all investors. Scotiabank recommends that investors independently evaluate any issuer and security discussed in this report, and consult with any advisors they deem necessary prior to making any investment.
This report and all information, opinions and conclusions contained in it are protected by copyright. This information may not be reproduced without the prior express written consent of Scotiabank.
™ Trademark of The Bank of Nova Scotia. Used under license, where applicable.
Scotiabank, together with “Global Banking and Markets”, is a marketing name for the global corporate and investment banking and capital markets businesses of The Bank of Nova Scotia and certain of its affiliates in the countries where they operate, including; Scotiabank Europe plc; Scotiabank (Ireland) Designated Activity Company; Scotiabank Inverlat S.A., Institución de Banca Múltiple, Grupo Financiero Scotiabank Inverlat, Scotia Inverlat Casa de Bolsa, S.A. de C.V., Grupo Financiero Scotiabank Inverlat, Scotia Inverlat Derivados S.A. de C.V. – all members of the Scotiabank group and authorized users of the Scotiabank mark. The Bank of Nova Scotia is incorporated in Canada with limited liability and is authorised and regulated by the Office of the Superintendent of Financial Institutions Canada. The Bank of Nova Scotia is authorized by the UK Prudential Regulation Authority and is subject to regulation by the UK Financial Conduct Authority and limited regulation by the UK Prudential Regulation Authority. Details about the extent of The Bank of Nova Scotia's regulation by the UK Prudential Regulation Authority are available from us on request. Scotiabank Europe plc is authorized by the UK Prudential Regulation Authority and regulated by the UK Financial Conduct Authority and the UK Prudential Regulation Authority.
Scotiabank Inverlat, S.A., Scotia Inverlat Casa de Bolsa, S.A. de C.V, Grupo Financiero Scotiabank Inverlat, and Scotia Inverlat Derivados, S.A. de C.V., are each authorized and regulated by the Mexican financial authorities.
Not all products and services are offered in all jurisdictions. Services described are available in jurisdictions where permitted by law.