- Colombia: Economic activity in May driven by finance and commerce
- Peru’s fiscal situation is likely to remain resilient into 2026
COLOMBIA: ECONOMIC ACTIVITY IN MAY DRIVEN BY FINANCE AND COMMERCE
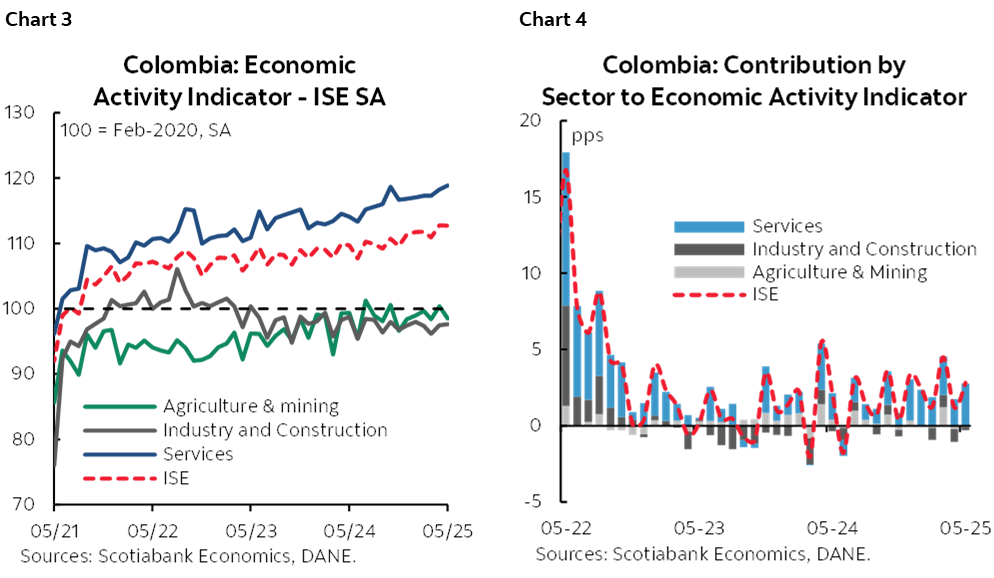
On Friday, July 18th, DANE released May’s Economic Activity Indicator (ISE) data. The indicator registered a 2.8% y/y increase (chart 1), below market expectations of 2.9% y/y and showing positive variations in seven of the nine activities included in the indicator. The seasonally adjusted data showed a 2.7% y/y expansion in economic activity. In period-on-period terms, economic activity decreased by -0.1% m/m S.A., below the monthly variation in April (1.6% m/m) (chart 2).
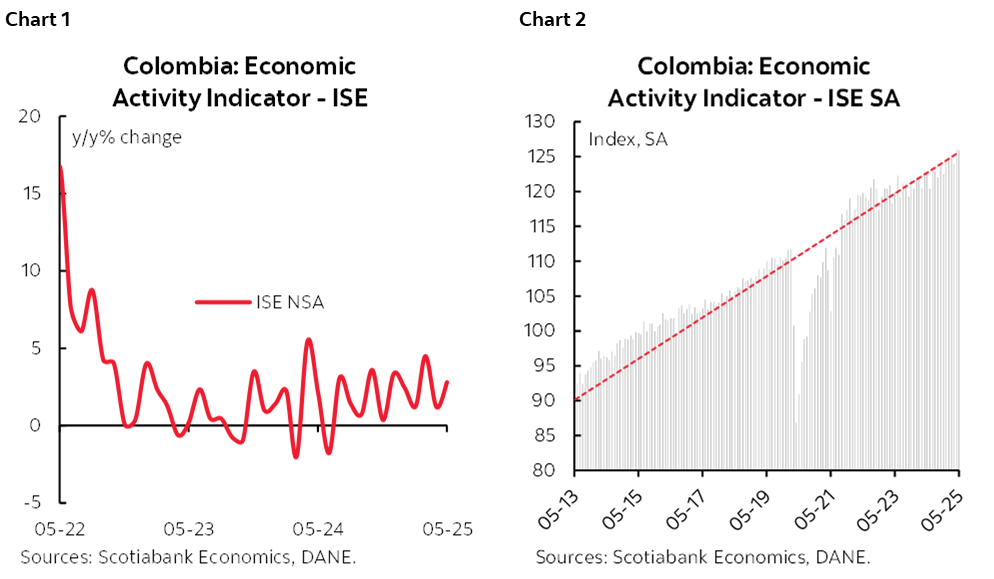
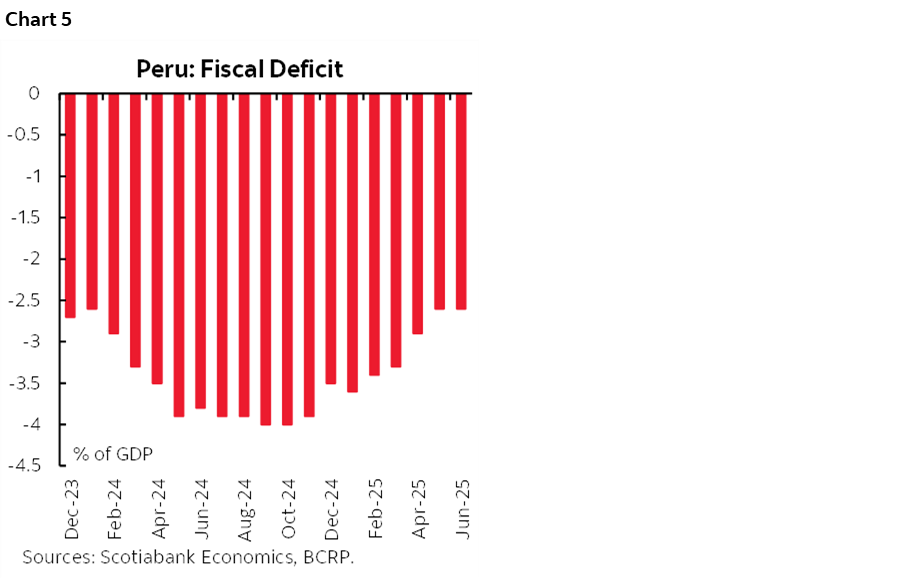
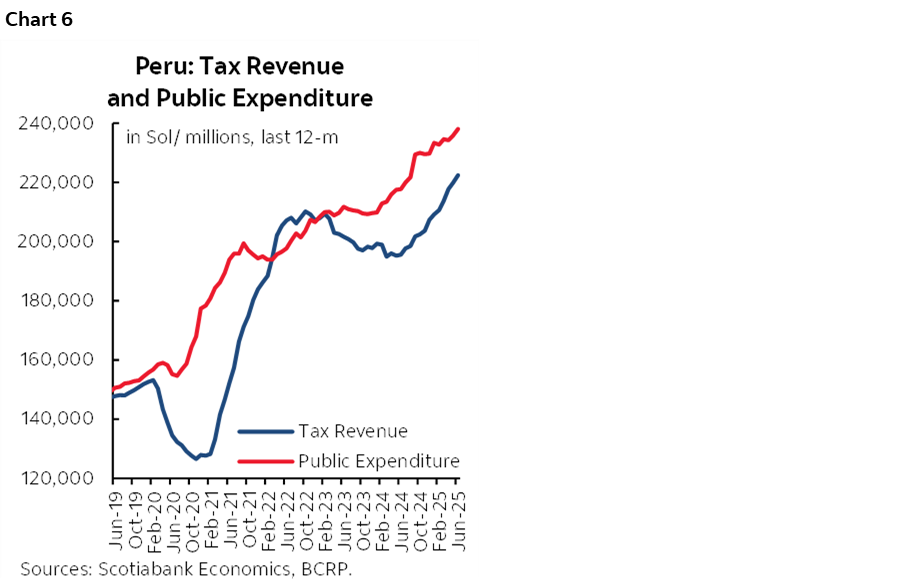
Economic activity was driven primarily by the services sector (charts 3 and 4). Services began 2025 in positive territory in which financial and insurance activities, and commerce were the best performers, followed by public administration, professional activities, communication services, real estate, and utilities. In contrast, the primary sector continued to slow, showing a slight contraction. Similarly, the secondary sector (manufacturing and construction) showed signs of slowing, mainly due to growth in the construction sector, while the manufacturing sector registered expansion during the month (see here).
Friday’s results are compatible with our GDP projection of 2.6% expansion in 2025. The mixed results of the indicator indicate that household consumption is leveraging economic growth, with consumption of durable and semi-durable goods standing out amid the relative stability of the FX. While this result gives BanRep some room to remain cautious, the output gap remains negative but will close soon. While the economy is improving, the sustainability of the economic recovery requires less restrictive monetary policy in the future, given the negative trend in inflation indicators. Thus, we affirm our expectation of a 25bps rate cut at the July meeting, to 9.00%.
Highlights:
- The primary sector showed a significant contraction. In May, both agricultural and mining activities dropped by -0.8% y/y. In the agricultural sector, coffee exports grew by 61% y/y and overall agriculture exports grew by 23% y/y. On the domestic front, the supply of agricultural products registered an increase of 7.8% y/y which shows an acceleration compared to 2024 when agriculture supply increased by 0.5% y/y on average. Mining, coal, and extractive industries showed signs of contraction reflected in a 14.7% y/y decline in mining exports.
- Secondary activities dropped by 1.1% y/y. Construction registered a negative trend while manufacturing increased in line with the manufacturing output indicator which grew by 3.0% y/y during the same period. Therefore, from the May manufacturing output indicator, food (+19.5% y/y), chemical products (+13.2% y/y), apparel (+12.7% y/y), and mineral products (+7.1% y/y) contributed to the result. In contrast, the iron and steel industry (-16.6% y/y), the oil and fuel industry (-7.4% y/y) and metal products (-8.9% y/y), were the main sectors offsetting the boost in the period. On the other hand, in the housing sector, home sales have increased +24% y/y in May, but construction licenses registered a significant decline in the period.
- The services sector continued expanding. On an annual basis, the seven service sectors registered positive variations. In general, services such as financial and insurance activities (+10.0% y/y), commerce, transportation, and housing (+6.9 y/y) and public administration and leisure (+3.1% y/y) contributed the most to the general positive performance. Besides, professional activities (+1.9% y/y), communication services (+1.8% y/y), real estate (+1.8% y/y) and utilities (+1.5% y/y) continued with positive numbers.
—Valentina Guio
PERU’S FISCAL SITUATION IS LIKELY TO REMAIN RESILIENT INTO 2026
Peru’s fiscal deficit has stabilized at 2.6% of GDP in the twelve months to June for the second consecutive month (chart 5). This was a figure sufficiently satisfying for the Minister of Finance, Raúl Perez Reyes, to state that the government would no longer raise the fiscal rule ceiling for 2025 to -2.8% of GDP (later revised to -2.5%), but leave it at the current deficit ceiling of 2.2% of GDP. Perez Reyes stressed with particular emphasis the performance of fiscal revenue. This is not without reason. Fiscal revenue for May was up 14.3%, YoY, outperforming expenditure, which rose an also hefty 12.9%. Minister Perez Reyes added that fiscal revenue continued to perform well in July, which is likely to be true.
Reading between the lines, by leaving the fiscal rule at a 2.2% deficit, Perez Reyes seems to be suggesting that government expenditure will not rise in the same measure as revenue going forward. This is possible. Even so, although revenue is, perhaps, not growing quite sufficiently to reach the 2.2% of GDP rule for the deficit. No matter, if the fiscal deficit ends the year at 2.4%–2.5%, that is fine.
The bottom line is that fiscal revenue is growing strongly, and, given the way metal prices have held up so far in 2025, this solid growth should continue into 2026. Revenue growth is giving the government a wide comfort zone for spending, and will be a sound starting place for the next government that starts in August 2026 (chart 6).
—Guillermo Arbe
DISCLAIMER
This report has been prepared by Scotiabank Economics as a resource for the clients of Scotiabank. Opinions, estimates and projections contained herein are our own as of the date hereof and are subject to change without notice. The information and opinions contained herein have been compiled or arrived at from sources believed reliable but no representation or warranty, express or implied, is made as to their accuracy or completeness. Neither Scotiabank nor any of its officers, directors, partners, employees or affiliates accepts any liability whatsoever for any direct or consequential loss arising from any use of this report or its contents.
These reports are provided to you for informational purposes only. This report is not, and is not constructed as, an offer to sell or solicitation of any offer to buy any financial instrument, nor shall this report be construed as an opinion as to whether you should enter into any swap or trading strategy involving a swap or any other transaction. The information contained in this report is not intended to be, and does not constitute, a recommendation of a swap or trading strategy involving a swap within the meaning of U.S. Commodity Futures Trading Commission Regulation 23.434 and Appendix A thereto. This material is not intended to be individually tailored to your needs or characteristics and should not be viewed as a “call to action” or suggestion that you enter into a swap or trading strategy involving a swap or any other transaction. Scotiabank may engage in transactions in a manner inconsistent with the views discussed this report and may have positions, or be in the process of acquiring or disposing of positions, referred to in this report.
Scotiabank, its affiliates and any of their respective officers, directors and employees may from time to time take positions in currencies, act as managers, co-managers or underwriters of a public offering or act as principals or agents, deal in, own or act as market makers or advisors, brokers or commercial and/or investment bankers in relation to securities or related derivatives. As a result of these actions, Scotiabank may receive remuneration. All Scotiabank products and services are subject to the terms of applicable agreements and local regulations. Officers, directors and employees of Scotiabank and its affiliates may serve as directors of corporations.
Any securities discussed in this report may not be suitable for all investors. Scotiabank recommends that investors independently evaluate any issuer and security discussed in this report, and consult with any advisors they deem necessary prior to making any investment.
This report and all information, opinions and conclusions contained in it are protected by copyright. This information may not be reproduced without the prior express written consent of Scotiabank.
™ Trademark of The Bank of Nova Scotia. Used under license, where applicable.
Scotiabank, together with “Global Banking and Markets”, is a marketing name for the global corporate and investment banking and capital markets businesses of The Bank of Nova Scotia and certain of its affiliates in the countries where they operate, including; Scotiabank Europe plc; Scotiabank (Ireland) Designated Activity Company; Scotiabank Inverlat S.A., Institución de Banca Múltiple, Grupo Financiero Scotiabank Inverlat, Scotia Inverlat Casa de Bolsa, S.A. de C.V., Grupo Financiero Scotiabank Inverlat, Scotia Inverlat Derivados S.A. de C.V. – all members of the Scotiabank group and authorized users of the Scotiabank mark. The Bank of Nova Scotia is incorporated in Canada with limited liability and is authorised and regulated by the Office of the Superintendent of Financial Institutions Canada. The Bank of Nova Scotia is authorized by the UK Prudential Regulation Authority and is subject to regulation by the UK Financial Conduct Authority and limited regulation by the UK Prudential Regulation Authority. Details about the extent of The Bank of Nova Scotia's regulation by the UK Prudential Regulation Authority are available from us on request. Scotiabank Europe plc is authorized by the UK Prudential Regulation Authority and regulated by the UK Financial Conduct Authority and the UK Prudential Regulation Authority.
Scotiabank Inverlat, S.A., Scotia Inverlat Casa de Bolsa, S.A. de C.V, Grupo Financiero Scotiabank Inverlat, and Scotia Inverlat Derivados, S.A. de C.V., are each authorized and regulated by the Mexican financial authorities.
Not all products and services are offered in all jurisdictions. Services described are available in jurisdictions where permitted by law.