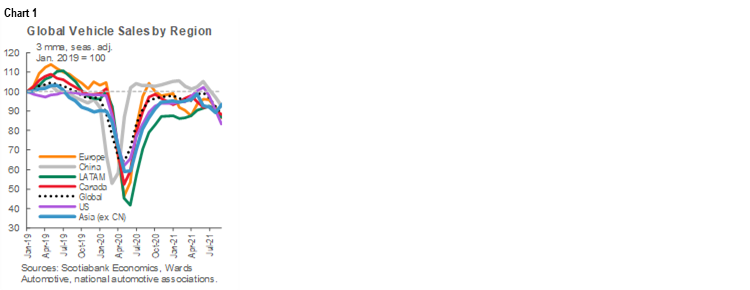
- Global auto sales slid for a fourth consecutive month in August with a -7.6% m/m (sa) contraction as limited inventory around the world impacted sales (chart 1).
- A sharp -10.7% m/m deterioration in US auto sales stood out as North American auto production pulled back by -12% m/m (sa), keeping already-depressed retail inventory low. But no region was immune with notable sales declines in most major markets including China (-6.6% m/m) and Germany (-10.5% m/m).
- Global vehicle production shows no sign of pivoting. As anticipated in our last month’s report, further production curtailments were announced over the course of September owing to the spread of the Delta variant. With Malaysian chip production reduced at least through end-October, it looks increasingly optimistic to expect a significant turn-around in fourth-quarter auto production.
- We run some quick numbers to illustrate that strong and growing demand for new vehicles in North America is likely to rival production capacity over the next year or so. The industry would likely be pressed to meet new demand, let alone unwind pent-up demand that has been building over the course of the year.
- And this is under an arguably optimistic baseline that auto production pivots in the fourth quarter this year such that it resumes operations close to capacity by early 2022.
- Therefore our expectation is that more balanced supply-demand conditions would only come about in 2023. By extension, this suggests new (and used) vehicle price pressures would persist over this horizon, albeit with some potentially stabilizing factors including base effects and diminishing model-pricing biases with greater selection.
- There is still considerable downside—or at least uncertainty—to this outlook that extends well-beyond the chip shortage that should leave automakers, dealers, and markets bracing for a potentially more prolonged recovery in auto sector dynamics.
GLOBAL AUTO SALES IN BRIEF
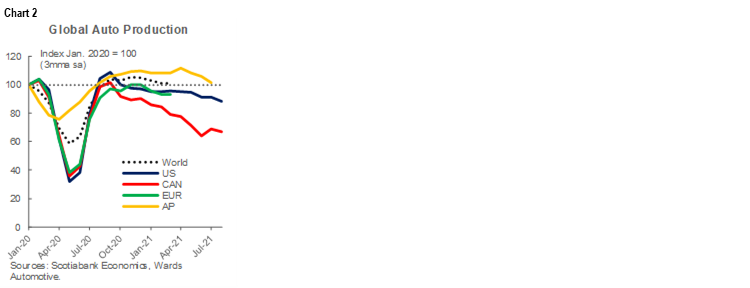
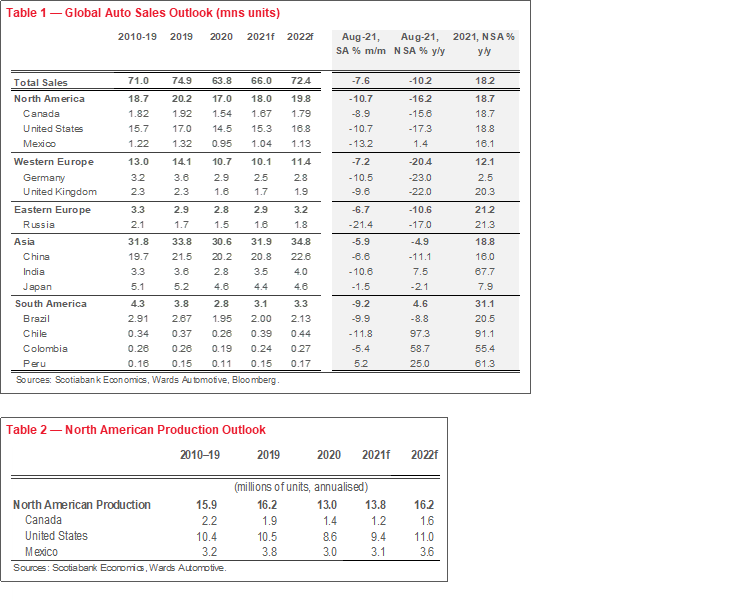
The fourth-month slide in global auto sales accelerated in August with a -7.6% m/m (sa) decline. On an annualised basis, sales sat at a very weak 62 mn units in August after trending closer to 72 mn vehicles for most of the first half of the year. On a year-over-year basis, the decline was -10% (nsa). Declines were near-universal across the globe as the semiconductor chip shortage has impacted production across all regions (chart 2). North American auto sales led the dip with a -10.5% m/m (sa) contraction on the back of weak US auto purchases as North American auto production plunged by almost -12% m/m (sa) in August. Western European sales were down by over -7% m/m with Germany driving the decline (-10.5% m/m). Asia Pacific purchases slowed by almost -6% m/m as Chinese sales contracted by almost -7% m/m. Not surprisingly, Asia Pacific auto production also decelerated into the summer with a -3.5% m/m (sa) decline in July (latest available).
See Box 1 in the Annex for a more detailed view of global auto sales in August.
INVENTORY, INVENTORY, INVENTORY
It (almost) all comes down to inventory when opining on current global auto sales. Economic fundamentals in most major economies suggest solid, if not hot, demand for vehicle purchases but sales activity remains well-below levels commensurate with this stage of the recovery.
The US market exemplifies this best. Strong demand-side factors—with a trend economic recovery underway and a highly supportive policy environment—had pushed sales up to 18.6 mn saar units this past spring, well-above 2019 auto sales of 16.9 mn. Job recoveries were (and are) trending in the right direction, multiple rounds of stimulus checks, child benefits are now lining pockets, and consumer confidence has been resilient for the most part. August retail data reinforced that the American consumer still has some steam left with a 1.5% m/m gain, netting out auto sales.
Nevertheless US auto sales came in at a paltry 13.1 mn saar units in August. To put this in context, this is roughly on par with the pace of sales in the immediate months after the April 2020 plunge when uncertainty and trepidation reigned. A year later, i.e., April 2021, sales had surged to 18.3 mn saar units, with three solid months at or above 2019 sales of 16.9 mn units. However, sales have been declining on a month-over-month basis since April’s stellar performance, with August’s slowdown the steepest yet since the chip shortage struck at -10.7% m/m (sa).
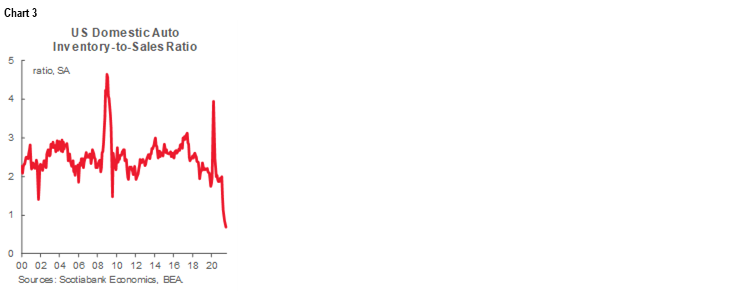
The impact of the shortage is most visible on dealer lots. Inventory levels as a share of sales in the US fell below one for the first time ever in May—averaging 2.5 in the decade prior to the pandemic—and has shown little sign of turn-around since then (chart 3). It is worth keeping in mind that this is a ratio of inventory to sales so there is a practical limit to how far it can fall—and it is likely already around this floor. The numerator in this equation (i.e., inventory) stood at only 1.1 mn vehicles, about half of inventory levels in April. This translates into about 13.7 mn saar units, which clearly puts a limit on sales potential without a material turn-around in production.
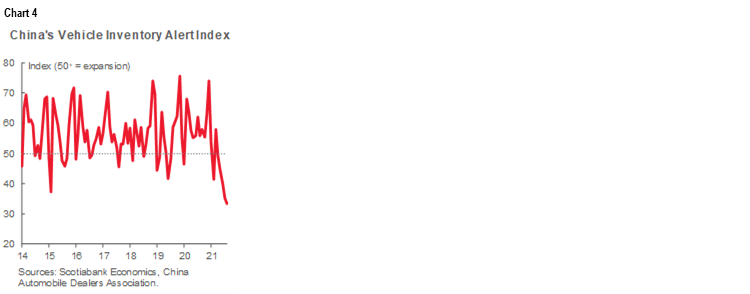
This is a near-universal constraint in major auto markets around the world. For example, China’s Vehicle Inventory Alert Index sits well into contractionary territory (chart 4) even though its government has not provided nearly the same levels of stimulatory policy response as the US.
SHORT SIGHTLINES FOR PRODUCTION
Lines of sight on auto supply are extremely opaque. Auto manufacturers for the most part are revising production plans on a weekly basis, providing—at most—outlooks on a monthly basis. And revisions then tend to be substantial: Toyota announced a 40% cut to September output; GM doubled its estimate of production losses in the second half of the year in September; and Ford, Honda and others layered on to these announcements in what would amount to hundreds of thousands of fewer vehicles for the month of September alone.
This is not to fault automakers. With limited inventory and strong reliance on supply chain intelligence, many may not have much more line of sight than markets. Bloomberg reported last week that, according to the US Commerce Secretary, President Biden is considering invoking the Defense Production Act, a Cold War-era national security law that could force semiconductor supply chains to report on inventory and sales of chips. The objective would be to both alleviate production bottlenecks and also identify possible hoarding.
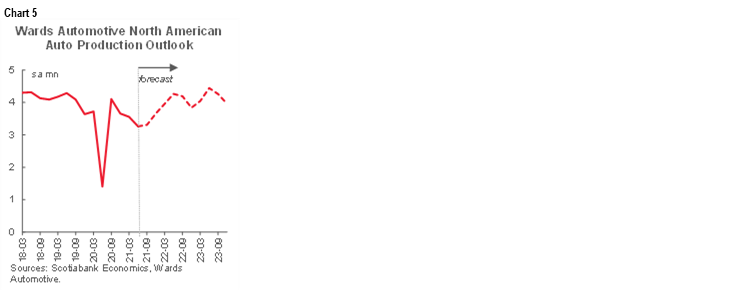
The nature of chip shortages is complex and evolving. Recall, shortages in the first half of the year were related to weak order books by automakers the year prior against stronger-than-anticipated vehicle demand, coupled with the Texas ice storm and the fire at Japan’s Renesas chip plant. North American auto production was struck particularly hard with just-in-time supply chains and a concentration of overseas chip sourcing. A deceleration in auto production was already underway by the end of 2020 (chart 5). While these earlier bottlenecks had shown a very tentative sign of recovery in the spring with North American vehicle production posting a 5% m/m (sa) improvement in June, the recovery was short-lived with the latest setbacks.
Any hopes of a near-term turn-around in auto production have been scuttled by outbreaks of the Delta-variant in South Asia. In particular, Malaysia—where an estimated 13% of global micro controller chips (MCUs) for the auto industry are produced—has curtailed production substantially owing to containment policies. Full production is not expected before the end of October based on executive guidance from various chip producers. At this point, the backlog is pegged in the order of 2–3 months. Vietnam chip production has similarly been affected. In August, auto production in North America declined at an accelerated clip in August (-12% m/m ) after July’s -1% m/m retreat.
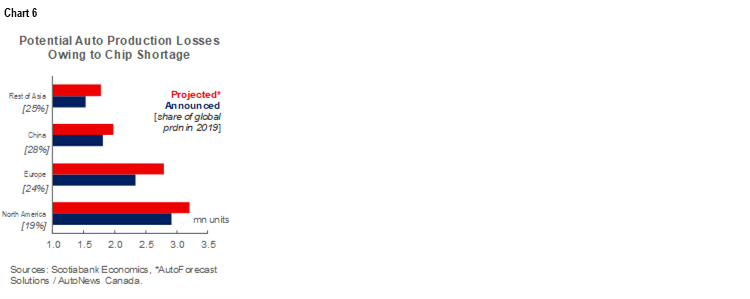
While global production data is lagged, it likely sits roughly 90% below pre-pandemic levels currently...and forecasters are busy revising down the outlook for the remainder of the year. IHS Markit has recently revised down its global production forecast by 5 mn units for 2021 (on top of earlier haircuts). Wards Automotive estimates 2 mn fewer vehicles will be produced in North America alone, relative to its early-year outlook, based on announced plans by automakers. But more curtailments can be expected in the coming weeks and months. AutoForecast Solutions, which applies judgement to publicly-stated plans, currently projects 10 mn fewer vehicles will be produced worldwide in 2021 (chart 6).
Needless to say, there is enormous conjecture on the timing and pace of global auto production. A best-guess (and admittedly likely an optimistic one) would see global auto production pivoting later in the fourth quarter, absent any further supply shocks, but in a gradual manner over months, if not quarters, before the industry is operating at capacity.
THE MULTIBILLION DOLLAR QUESTION
When will markets return to more balanced territory? It is hard to put precision on this given uncertainty on both supply and demand factors. Given limited global data, we can look to North America for some insight.
Pent-up demand for vehicles has been mounting for most of the year. We have shaved our own auto sales outlook for North America by about one million units since the chip shortage emerged earlier, when we were otherwise revising up our economic outlook based on stronger recoveries underway. In fact, we revised up real GDP by 1.8 ppts in both the US and Canada between January and August this year. (Our September downward economic revisions were a significant function of supply shortages in the auto sector.)
It would be reasonable to assume pent-up demand in North America alone could be in the order of 2 mn units by the end of the year. This would also include demand from inventory replenishment on dealer lots. This demand should be pushed forward into 2022. However, Scotiabank Economics’ modeling by René Lalonde suggests that auto demand in the US (and Canada), based on economic fundamentals, would already be pushing up against production capacity even in the absence of inventory challenges. For example, US auto demand would be in the 18–19 mn unit range next year—surging past historic records—based on fundamental economic drivers. In Canada, demand would be around pre-pandemic levels of 1.9 mn units. This would translate into additional demand in the order of 1 mn vehicles beyond historic peaks for continental auto demand.
Auto production capacity would likely be the binding constraint in how quickly this pent-up demand could be unwound. North American auto production capacity likely sits in the order of mid-to-high 17 mn range. The industry has typically operated around 80% utilization levels, according to Wards Automotive, which suggests there is some potential, theoretically at least, to increase output very modestly. For the sake of illustration, taking utilization rates up to 85% would produce an additional 1 mn vehicles domestically. This would ‘just’ cover additional domestic demand in 2022 before considering pent-up demand in the order of 2 mn units carried forward from 2021. Imports may offset shortfalls to an extent as they did in 2020 when shortages were more acute in the region, but with widespread inventory challenges globally now, there may be less displacement.
These back-of-envelope numbers suggest shortages will likely persist through 2022 and into early 2023. Absent an economic turn that could erode demand, auto production would be challenged to keep pace with current demand, keeping supply tight. This illustration is arguably a floor as it would be predicated on auto production operating at (or above) capacity by the new year. This is still a best-guess baseline assumption given Delta-related impacts, but there is still plenty of further downside that could transpire.
This makes no judgement on potential responses of automakers with respect to pent-up demand. Given the shift underway from traditional internal combustion engines (ICE) to electric vehicles (EV) that is seeing substantial new investments in EV capacity (expected to come on-line around 2023), it is not likely that there would be significant new investments in incremental ICE production capacity to meet this (mostly) transitory pent-up demand, nor would it be timely enough.
PRICING MAKERS OR TAKERS?
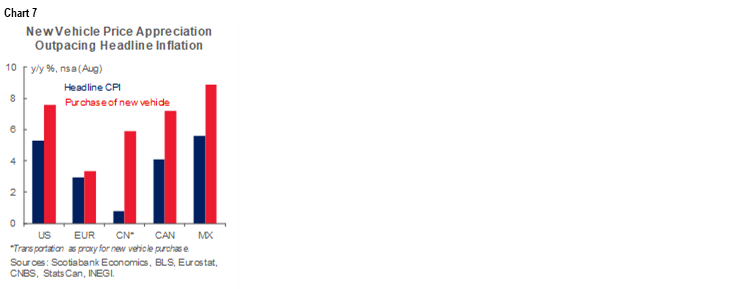
Price pressures for new vehicles could persist over this horizon. According to J.D. Power, average transaction prices for new vehicles in the US were tracking to set another all-time high in August—and over 16% higher than August 2020—though the sticker price for consumers is tracking closer to +10% y/y as stronger trade-in values and lower financing costs are offsetting some of the new vehicle price appreciation. New vehicle price inflation hit 7.6% y/y (nsa) in the US, well above headline inflation of 5.3%. Again, this is not unique to the US market with new vehicle prices putting pressure on inflation prints around the world as new vehicles typically represent 5–7% of price baskets in advanced economies (chart 7).
This trend could reasonably continue in months ahead with new vehicle supply remaining tight, though some potential moderating factors could emerge. One is base effects as shortages already plagued at least North American markets towards the latter part of 2020. Elasticities may also come into play—demand for used vehicles seems to have (somewhat) stabilized as consumers backed away from escalating prices and limited choice this summer. There could also be some counter-balancing factors as more model selection reaches dealer lots. It is unclear the extent to which the prioritization of higher-valued vehicles in light of limited inventory could have skewed costs higher despite statistical agencies’ best efforts to compare like-with-like in these unusual times.
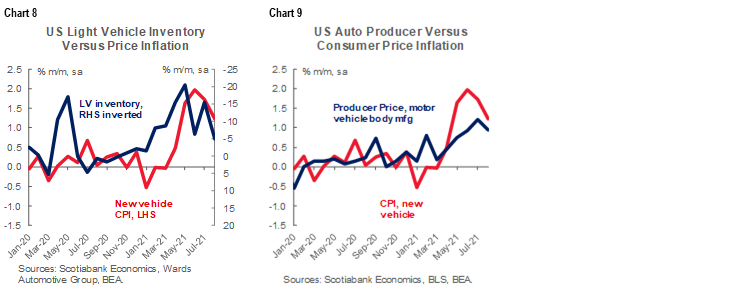
Another unknown is the extent to which prices are being driven by limited vehicle inventory versus higher production costs. This is relevant insofar as changes to supply chain practices could reflect a structural shift in producer prices versus a more transitory supply issue related to retail inventory. Consumer prices appear to be responding to limited retail inventory in the US (chart 8). While producer prices for motor vehicle manufacturing are mirroring consumer prices for new vehicles (chart 9), it is likely premature to see production increases passed along just yet so that may represent a price pressure with the roll-out of next year’s models.
At this point, a best guess would be continued price pressure over the next few months, with stabilization heading into the year-end, and only potential softening towards the end of 2022. At that point in the cycle, financing costs would likely be on the rise, potentially offsetting the impact from a cost-of-vehicle ownership perspective, but given the persistence of pent-up demand, the auto cycle could outlast the business cycle, seeing upticks in annual sales through 2023 and possibly longer.
Used vehicle supply (and prices) are closely linked to new vehicle market dynamics. Given the prolonged nature of the supply recovery for new vehicles, used car markets are similarly likely to remain supply-constrained through 2022 and into 2023. Fewer trade-ins, lower fleet returns, and rarer delinquencies would continue to impact used supply. The softening of used vehicle prices in July proved short-lived with August seeing modest appreciation once again (as we had anticipated last month here). Used vehicle prices in the US started ticking up modestly in both retail and wholesale markets in August according to Black Book, with retail prices about 25% above the start of the year. While we do not expect unchecked acceleration in used vehicle prices as witnessed in the first part of 2021 (particularly given consumers have already expressed some reservation earlier this summer), we expect a stabilization versus a sharp deceleration in the price environment.
Needless to say, there are enormous uncertainties around this outlook, but at least we have some markers to monitor.
BOX 1: TRENDS IN REGIONAL AUTO SALES
Global auto sales pulled back again in August by -7.6% m/m (sa) for a fourth consecutive month of decline. On an annualised basis, sales sat just shy of an anemic 62 mn units in August after trending closer to 72 mn vehicles over the first half of the year. On a year-over-year basis, the decline was -10% (nsa). Not surprisingly, the global semiconductor chip shortage continues to weigh on the global auto sales recovery. The outbreaks of the Delta variant around the world continue to impact supply chains. The recovery in auto production has consequently been pushed out yet again as manufacturers announce further curtailments on a rolling basis into the near future.
The impact has been particularly biting for North American markets where an exceptionally strong rebound in US demand has outstripped supply, while the hit to production has been more sustained. After surging sales earlier in the spring, US auto sales having been pulling back since April. The deceleration picked up speed with a -10.7% m/m contraction in August (versus declines averaging about -7% m/m in the three prior months). Sales were a mere 13.1 mn units on an annualized basis in August—or a full 20% below the 16.5 mn mark they had been trending in the first half of the year. (See more details for US and Canadian August sales here.) Industry guidance suggests another decline is in the cards for September sales.
Chinese auto sales—representing about 30% of the global light vehicle market—was not immune to shortfalls with sales dipping by -6.6% m/m (sa) as production and inventories declined in August, but were still depressed relative to earlier months’ activity. August auto purchases came in at 19.5 mn annualized sales, which is over 10% below first-half sales that trended around a healthy 21.8 mn units. Nevertheless, sales are roughly on par with pre-pandemic sales levels in 2019. With even more opacity around domestic supply constraints, but higher domestic chip production, Chinese production—and hence sales outlook—remains a wildcard with a potential to turn around faster than other markets.
Japanese auto sales in August were an outlier with a contraction of ‘only’ -1.5% m/m (sa). The country has generally been partially insulated from the chip shortage owing to both domestic chip production as well as higher inventory margins following lessons from the 2011 tsunami. Weaker economic fundamentals, as well as structural shifts in vehicle ownership, are likely playing out in trend vehicle sales in Japan relative to other markets. Otherwise, elsewhere in the region, India also saw a decline in sales of -10.6% m/m (sa) though the selling rate in August was still at roughly pre-pandemic levels.
European auto sales saw another contraction in August of around -7% m/m (sa). As usual, transactions in the largest market—Germany—have influenced headline numbers with its pullback of -10.5% m/m, though almost all markets saw declines (i.e., UK, -10% m/m; Spain, -16% m/m; Italy, -6% m/m; Russia, -21% m/m) with only France as an outlier (-1% m/m) after a sharp decline the month-prior. European sales continue to be affected by inventory shortages in the near term, while structural shifts following further tightening of emissions regulations are impacting traditional vehicle demand. The August annualised selling rate was a mere 75% of 2019 annual sales which had already been dented by earlier rounds of emissions regulations.
Latin American auto sales also saw sharp declines in August (-10% m/m, sa) for a second month of retrenchment. Mexico and Brazil led the regional slowdown on a volume basis with -13% m/m and -10% m/m declines, respectively. Both markets had been struggling to approach pre-pandemic levels prior to inventory challenges: year-to-date sales this year are down by about 20% relative to 2019 while August sales were down by about 30% in both markets. Chile and Colombia also experienced slowdowns in August (-12% m/m and -5% m/m, respectively) with only Peru pulling off an increase (5% m/m). Nevertheless, the annualised sales rate in all three countries in August exceeded pre-pandemic levels in 2019, and substantially so in Chile.
Inventory shortages took a toll on August auto sales in Canada. DesRosiers Automotive Consultants Inc. estimated a month-over-month retrenchment of -5.4% (sa) with annualised sales of 1.62 mn units. Wards Automotive puts the decline steeper at -8.9% m/m (sa) and 1.49 mn saar units. Given quarterly reporting by automakers, we should have a better sense of third quarter performance later this week, but industry guidance (and production and inventory figures) suggest September sales will round out a very weak quarter for auto sales in Canada. See the first-of-month Canadian sales reporting here.
DISCLAIMER
This report has been prepared by Scotiabank Economics as a resource for the clients of Scotiabank. Opinions, estimates and projections contained herein are our own as of the date hereof and are subject to change without notice. The information and opinions contained herein have been compiled or arrived at from sources believed reliable but no representation or warranty, express or implied, is made as to their accuracy or completeness. Neither Scotiabank nor any of its officers, directors, partners, employees or affiliates accepts any liability whatsoever for any direct or consequential loss arising from any use of this report or its contents.
These reports are provided to you for informational purposes only. This report is not, and is not constructed as, an offer to sell or solicitation of any offer to buy any financial instrument, nor shall this report be construed as an opinion as to whether you should enter into any swap or trading strategy involving a swap or any other transaction. The information contained in this report is not intended to be, and does not constitute, a recommendation of a swap or trading strategy involving a swap within the meaning of U.S. Commodity Futures Trading Commission Regulation 23.434 and Appendix A thereto. This material is not intended to be individually tailored to your needs or characteristics and should not be viewed as a “call to action” or suggestion that you enter into a swap or trading strategy involving a swap or any other transaction. Scotiabank may engage in transactions in a manner inconsistent with the views discussed this report and may have positions, or be in the process of acquiring or disposing of positions, referred to in this report.
Scotiabank, its affiliates and any of their respective officers, directors and employees may from time to time take positions in currencies, act as managers, co-managers or underwriters of a public offering or act as principals or agents, deal in, own or act as market makers or advisors, brokers or commercial and/or investment bankers in relation to securities or related derivatives. As a result of these actions, Scotiabank may receive remuneration. All Scotiabank products and services are subject to the terms of applicable agreements and local regulations. Officers, directors and employees of Scotiabank and its affiliates may serve as directors of corporations.
Any securities discussed in this report may not be suitable for all investors. Scotiabank recommends that investors independently evaluate any issuer and security discussed in this report, and consult with any advisors they deem necessary prior to making any investment.
This report and all information, opinions and conclusions contained in it are protected by copyright. This information may not be reproduced without the prior express written consent of Scotiabank.
™ Trademark of The Bank of Nova Scotia. Used under license, where applicable.
Scotiabank, together with “Global Banking and Markets”, is a marketing name for the global corporate and investment banking and capital markets businesses of The Bank of Nova Scotia and certain of its affiliates in the countries where they operate, including; Scotiabank Europe plc; Scotiabank (Ireland) Designated Activity Company; Scotiabank Inverlat S.A., Institución de Banca Múltiple, Grupo Financiero Scotiabank Inverlat, Scotia Inverlat Casa de Bolsa, S.A. de C.V., Grupo Financiero Scotiabank Inverlat, Scotia Inverlat Derivados S.A. de C.V. – all members of the Scotiabank group and authorized users of the Scotiabank mark. The Bank of Nova Scotia is incorporated in Canada with limited liability and is authorised and regulated by the Office of the Superintendent of Financial Institutions Canada. The Bank of Nova Scotia is authorized by the UK Prudential Regulation Authority and is subject to regulation by the UK Financial Conduct Authority and limited regulation by the UK Prudential Regulation Authority. Details about the extent of The Bank of Nova Scotia's regulation by the UK Prudential Regulation Authority are available from us on request. Scotiabank Europe plc is authorized by the UK Prudential Regulation Authority and regulated by the UK Financial Conduct Authority and the UK Prudential Regulation Authority.
Scotiabank Inverlat, S.A., Scotia Inverlat Casa de Bolsa, S.A. de C.V, Grupo Financiero Scotiabank Inverlat, and Scotia Inverlat Derivados, S.A. de C.V., are each authorized and regulated by the Mexican financial authorities.
Not all products and services are offered in all jurisdictions. Services described are available in jurisdictions where permitted by law.