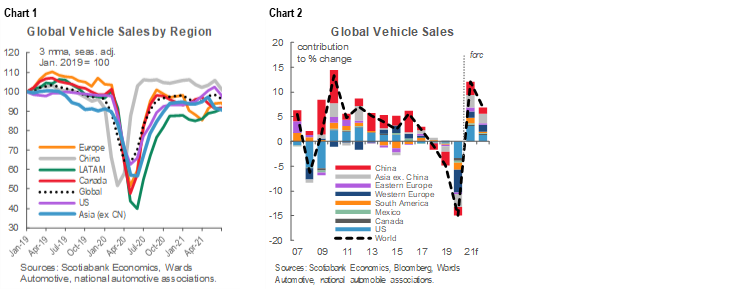
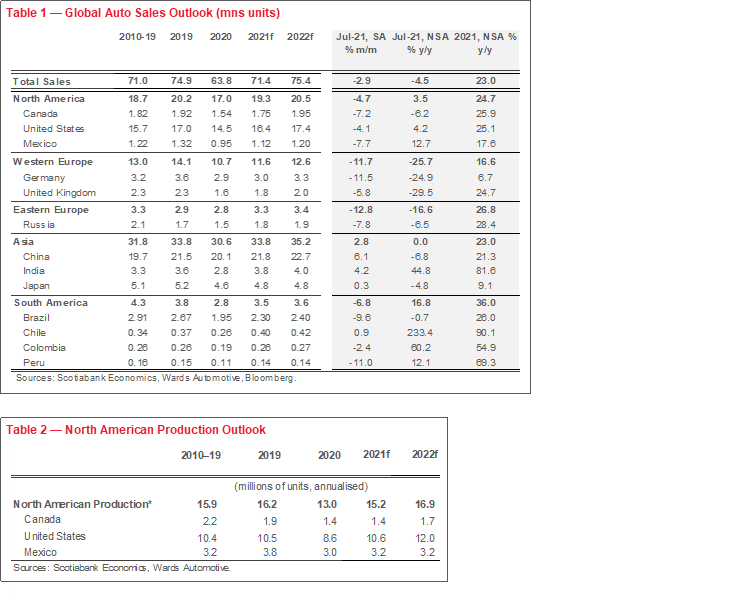
- Global auto sales edged down again in July (by 3% m/m, sa) as the chip shortage continued to provide headwinds to sales. Europe and North America drove the declines as dealer lots scrambled for limited inventory. Chinese purchases provided an offset with its 6% m/m improvement (chart 1).
- Vehicle production suffered further unanticipated cuts in July that are likely to extend through September…at least. A production rebound is still pencilled in for later in the third quarter by Wards Automotive Group, but the spread of the Delta variant will likely take much of the steam out of the rally.
- Used vehicle prices saw some reprieve in July—as buyers likely balked at costs—but they still remain elevated and are unlikely to soften materially until new vehicle inventory returns. In fact, a surge in pent-up travel ahead could re-ignite price escalation through fleet demand.
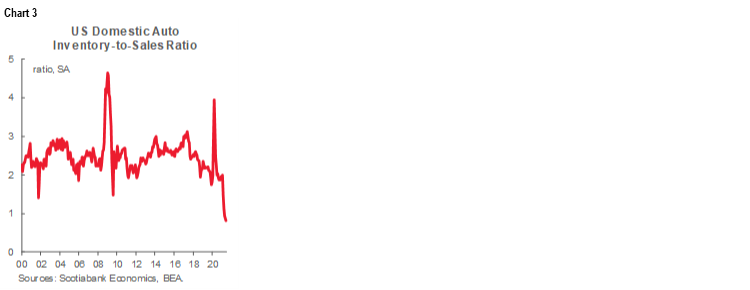
- With weak global auto sales signaled for August, we will likely take down our sales forecasts modestly for 2021 in most major markets as numbers are confirmed in the coming weeks. With the prevalence of outbreaks in key chip-producing markets where vaccination rates are low, a slower-than-anticipated unwinding of bottlenecks is highly probable.
- We still believe this will fuel pent-up demand, but increasingly a greater number of sales will be pushed into 2022 (chart 2).
GLOBAL AUTO SALES IN BRIEF
Global auto sales edged down again in July by -3% m/m (sa) for a third consecutive month of decline. On an annualised basis, sales sat at a weak 67 mn units in July after trending closer to 72 mn vehicles over the first half of the year. On a year-over-year basis, the decline was 5% (nsa). Not surprisingly, the global semiconductor chip shortage continues to weigh on the global auto sales recovery. The impact has been particularly pronounced in Europe and North America that saw declines of -12% m/m and -5% m/m, respectively, in July, whereas China buoyed Asia Pacific sales with a 6% m/m improvement. The outbreaks of the Delta variant around the world—while not expected to result in serious economic write-downs for the most part—continue to wreak havoc on supply chains and consequently auto inventory.
See Box 1 in the Annex for a more detailed view of global auto sales in July.
INVENTORY IS EVERYTHING
Inventory shortages continue to stall further progress despite solid consumer-driven recoveries underway in key markets. North American auto production in June proved to be a teaser: the +5% m/m (sa) improvement that month stalled in July with production largely flat, according to Wards Automotive Group. A further 190 k units in unanticipated cuts were made in July owing to the chip shortage. While ‘flat’ may appear positive in the context of serious shortages, July 2021 output still sat 25% shy of July 2020 production so idled capacity is still substantial.
August is unlikely to offer much reprieve. Wards has pencilled in a +5% m/m (sa) improvement for August, but this is likely to be revised downward in the current, highly fluid environment. With the rapid spread of the Delta variant further disrupting chip production in parts of Southeast Asia, Toyota is the latest OEM—and one that had until now weathered well the shortage—to cut its production outlook amidst supply constraints. Last week, it slashed its September production plans by 40%, with a quarter of the cuts (or 80 k) in North America. However, the company has maintained its annual production target (ending March 31, 2022) with an expectation that production losses will be recouped later in the fall, while noting a highly uncertain outlook.
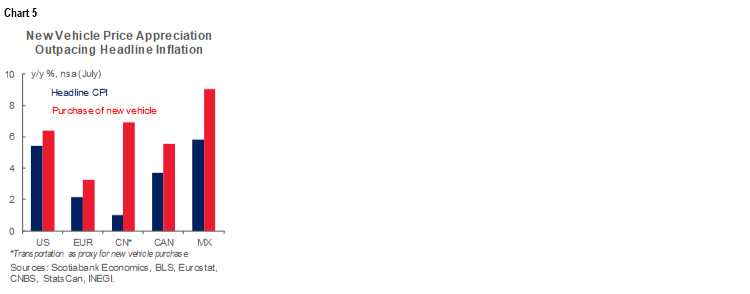
It is reasonable to expect more production cuts will be announced by other auto manufacturers in September as the Delta variant persists. This would delay the recovery in retail inventory levels, already at all-time lows. Days supply stood at 24 days heading into August in the US (with a normal range being 60–65 days), while inventory (as a share of sales) sat below 1 again in July (chart 3). Even though US vehicle sales will likely retreat further in August, a higher-than-anticipated contraction in production would put more downward pressure on inventory levels heading into September.
A recovery in production later in the fall is still in baselines, but conviction is highly tenuous. The forecasted third-quarter rebound of 15% q/q (sa) in North American auto production by Wards is more of a place-holder pending further announcements from manufacturers that would push out the recovery (chart 4). As elaborated in last month’s report, we do not expect a more balanced supply-demand market until well-into 2022 for new vehicles and even later for used vehicles.

PEAK PRICING OR PEAKING PRICES?
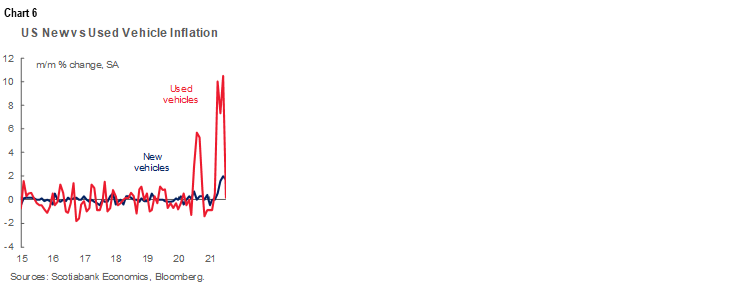
It is premature to expect softening in new vehicle prices until inventory bottlenecks are resolved. According to J.D. Power, average transaction prices for new vehicles in the US were tracking at an all time-high of over USD41K—nearly 17% higher than July 2020—and 3% m/m higher than June 2021. This translated into a +1.7% m/m increase in new vehicle price inflation as measured by the US Consumer Price Index in July. This is trending globally with similar patterns across developed and emerging markets alike; for example, new vehicle price inflation approaching 10% y/y in Mexico in July (chart 5).
Limited inventory and sky-high pricing in used vehicle markets have arguably neutralized some of the sticker shock on new car prices. While used vehicle retail prices in the US have stabilized in recent weeks according to Black Book, they still stand 24% above the start of the year. And used car price appreciation relative to new vehicle pricing is still high, at least in the US where it is measured (chart 6). This is working in favour of potential new car buyers with a trade-in as July trade-in values were tracking over 80% above July 2020 levels in the US, according to J.D. Power. This would helpfully reduce financing needs for many new vehicle buyers, along with lower interest rates. The recovery in gasoline prices may have eaten into vehicle ownership affordability but this, so far, has not been a deterrent in markets with insatiable demand for SUVs.
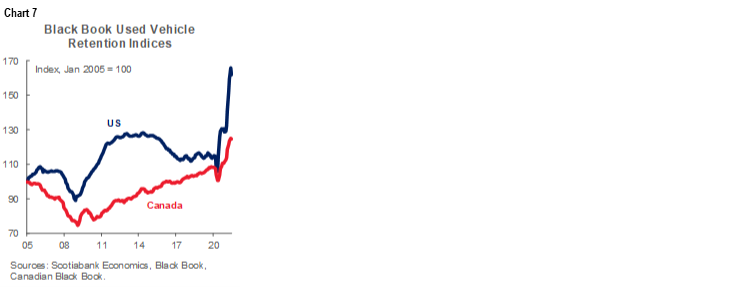
Wholesale vehicle prices have been moderating faster than retail prices. Over the course of July, Black Book reported softening weekly price appreciation in wholesale prices in the US and Canada as potential buyers backed away from high prices and limited inventory—though potentially the calibre of supply may also be deteriorating as older and/or higher wear-and-tear vehicles are entering the market. Vehicle retention indices, which aim for comparability, also finally pulled back in July, according to Black Book, after months of skyward escalation (chart 7).
There is a risk that used vehicle prices pick up again temporarily given the persistence of the chip shortage and consequent delays in new vehicle inventory replenishment. Used vehicle supply relies on retail trade-ins, as well as retiring fleets, both of which have more down- than up-side in the near term. But July data may have shown there is a limit to willingness to pay as price elasticities started kicking in for used vehicles.
BOX 1: TRENDS IN REGIONAL AUTO SALES
Global auto sales edged down again in July by -3% m/m (sa) for a third consecutive month of decline. On an annualised basis, sales sat at a weak 67 mn units in July after trending closer to 72 mn vehicles over the first half of the year. On a year-over-year basis, the decline was 5% (nsa). Not surprisingly, the global semiconductor chip shortage continues to weigh on the global auto sales recovery. The outbreaks of the Delta variant around the world—while not expected to result in serious economic write-downs—continue to impact supply chains. The recovery in auto production has consequently been pushed out yet again as manufacturers announce September production plans.
The impact has been particularly biting for North American markets where an exceptionally strong rebound in US demand has outstripped supply. After surging sales earlier in the spring, US auto sales pulled back in July by -4% m/m (sa) for a third month in a row, albeit with some deceleration relative to the -10% m/m retrenchment in June. Sales were a mere 14.7 mn units on an annualized basis in July—or a full 10% below the 16.5 mn mark they had been trending in the first half of the year. (See more details for US and Canadian July sales here.) Industry guidance suggests another decline is in the cards for August sales.
Chinese auto sales—representing about 30% of the global light vehicle market—bucked the global trend with a 6% m/m (sa) improvement in July auto sales, but were still depressed relative to earlier months’ activity. July auto purchases came in at 20.8 mn annualized sales, which is almost 5% below first-half sales that trended around a healthy 21.8 mn units. Nevertheless, sales still sit modestly above pre-pandemic levels. The more aggressive approach to virus containment muted the economic impact, and has supported a stronger recovery in auto sales, while importantly in the near term, domestic chip production is likely minimizing some of the impact on auto production. Elsewhere on the continent, India also saw sales improve on a month-over-month basis (4%), while Japanese sales were largely flat.
European auto sales suffered the sharpest regional contraction in July with a -12% m/m decline. As usual, transactions in the largest market—Germany—have influenced headline numbers with its pull back of -11.5% m/m, though almost all markets saw declines (i.e., France, -16% m/m; Italy, -14% m/m; UK, -6% m/m; Russia, -8% m/m). European sales are being affected by inventory shortages in the near term, while some re-opening effects following fourth waves in countries like the UK and Spain offset some of the impact on month-over-month basis. The region is nevertheless experiencing a structural shift following last year’s tighter emissions regulations with July sales a mere 75% of 2019 annual sales.
Latin American auto sales also saw sharp declines in July (-7% m/m, sa), ending a five-month string of monthly improvements. Brazilian sales drove headline numbers with a retrenchment of -10% m/m, followed by Mexico (-7% m/m). Both countries are still struggling to approach pre-pandemic levels with year-to-date sales around 20% below 2019 sales levels. Peru and Colombia also experienced slow-downs in July (-11% m/m and -2% m/m, respectively) with only Chile pulling off a modest increase (1% m/m). All three countries have narrowed the gap relative to pre-pandemic levels (i.e., 2019 sales levels) to within 5% of 2019 sales levels, with Chile in fact modestly above. Lower vaccination rates will continue to present headwinds to the regional recovery as the Delta variant spreads.
Canadian auto markets benefited from some re-opening activity in July as major provincial economies continued to lift restrictions over the summer, but limited inventory curbed some of the enthusiasm. DesRosiers Automotive Consultants Inc. estimates 156 k vehicles were sold—a 5.7% decline relative to last year (and by about -10% relative to July 2019). On a seasonally adjusted basis, sales eked out a 3.6% m/m (sa) improvement relative to June at 1.71 mn saar, according to the same source. Note, however, that Wards Automotive Group that reports Canadian auto sales with a lag is reporting a decline in monthly sales (of -7% m/m). With Statistics Canada guiding a decline in retail sales for July despite re-opening, it may well be that the pullback in auto sales was sharper than initially reported. With quarterly reporting by OEMs, we won’t know but a trending decline in auto sales is consistent with expectations. Industry guidance suggests August sales will see another slow-down as inventory remains shut and further production cuts were announced toward the end of August.
DISCLAIMER
This report has been prepared by Scotiabank Economics as a resource for the clients of Scotiabank. Opinions, estimates and projections contained herein are our own as of the date hereof and are subject to change without notice. The information and opinions contained herein have been compiled or arrived at from sources believed reliable but no representation or warranty, express or implied, is made as to their accuracy or completeness. Neither Scotiabank nor any of its officers, directors, partners, employees or affiliates accepts any liability whatsoever for any direct or consequential loss arising from any use of this report or its contents.
These reports are provided to you for informational purposes only. This report is not, and is not constructed as, an offer to sell or solicitation of any offer to buy any financial instrument, nor shall this report be construed as an opinion as to whether you should enter into any swap or trading strategy involving a swap or any other transaction. The information contained in this report is not intended to be, and does not constitute, a recommendation of a swap or trading strategy involving a swap within the meaning of U.S. Commodity Futures Trading Commission Regulation 23.434 and Appendix A thereto. This material is not intended to be individually tailored to your needs or characteristics and should not be viewed as a “call to action” or suggestion that you enter into a swap or trading strategy involving a swap or any other transaction. Scotiabank may engage in transactions in a manner inconsistent with the views discussed this report and may have positions, or be in the process of acquiring or disposing of positions, referred to in this report.
Scotiabank, its affiliates and any of their respective officers, directors and employees may from time to time take positions in currencies, act as managers, co-managers or underwriters of a public offering or act as principals or agents, deal in, own or act as market makers or advisors, brokers or commercial and/or investment bankers in relation to securities or related derivatives. As a result of these actions, Scotiabank may receive remuneration. All Scotiabank products and services are subject to the terms of applicable agreements and local regulations. Officers, directors and employees of Scotiabank and its affiliates may serve as directors of corporations.
Any securities discussed in this report may not be suitable for all investors. Scotiabank recommends that investors independently evaluate any issuer and security discussed in this report, and consult with any advisors they deem necessary prior to making any investment.
This report and all information, opinions and conclusions contained in it are protected by copyright. This information may not be reproduced without the prior express written consent of Scotiabank.
™ Trademark of The Bank of Nova Scotia. Used under license, where applicable.
Scotiabank, together with “Global Banking and Markets”, is a marketing name for the global corporate and investment banking and capital markets businesses of The Bank of Nova Scotia and certain of its affiliates in the countries where they operate, including; Scotiabank Europe plc; Scotiabank (Ireland) Designated Activity Company; Scotiabank Inverlat S.A., Institución de Banca Múltiple, Grupo Financiero Scotiabank Inverlat, Scotia Inverlat Casa de Bolsa, S.A. de C.V., Grupo Financiero Scotiabank Inverlat, Scotia Inverlat Derivados S.A. de C.V. – all members of the Scotiabank group and authorized users of the Scotiabank mark. The Bank of Nova Scotia is incorporated in Canada with limited liability and is authorised and regulated by the Office of the Superintendent of Financial Institutions Canada. The Bank of Nova Scotia is authorized by the UK Prudential Regulation Authority and is subject to regulation by the UK Financial Conduct Authority and limited regulation by the UK Prudential Regulation Authority. Details about the extent of The Bank of Nova Scotia's regulation by the UK Prudential Regulation Authority are available from us on request. Scotiabank Europe plc is authorized by the UK Prudential Regulation Authority and regulated by the UK Financial Conduct Authority and the UK Prudential Regulation Authority.
Scotiabank Inverlat, S.A., Scotia Inverlat Casa de Bolsa, S.A. de C.V, Grupo Financiero Scotiabank Inverlat, and Scotia Inverlat Derivados, S.A. de C.V., are each authorized and regulated by the Mexican financial authorities.
Not all products and services are offered in all jurisdictions. Services described are available in jurisdictions where permitted by law.