Latam Economic Update
Week Ahead: Light on data, no scheduled central bank developments
Argentina: July inflation comes in just below expectations
Colombia: Q2 Contraction in line with forecasts; end-2020 inflation expectations remain below 2%
Peru: BCRP maintained its policy rate at 0.25%; 2020 CY fiscal deficit to July was in line with expectations; cement sales surprised to the upside in July
WEEK AHEAD: LIGHT ON DATA, NO SCHEDULED CENTRAL BANK DEVELOPMENTS
The week is relatively light on top-tier data releases and the risk calendar doesn’t feature any scheduled central bank actions, as noted in our most recent Latam Weekly. June economic activity indices for Peru (Saturday, August 15) and Argentina (Thursday, August 20) dominate the calendar.
- Peru’s numbers, out on the weekend, were broadly in line with our expectations: growth improved from a -32.8% y/y contraction in May to -18.1% y/y in June, a bit better than our forecast of -20.0% y/y. Consensus was a moving target right up to the print and didn’t provide a useful benchmark on expectations. The re-opening of the mining sector, fishing, and manufacturing underpinned the rise in economic activity from May. June unemployment remained at 16.4%, up a touch from 16.3% in May on higher participation rates.
- We expect Argentina’s June economic activity index to show a gain of nearly 17% m/m from May, which would take total GDP nearly back to the already depressed recession levels of June 2019.
- We expect Chile’s Q2 GDP numbers, out on Tuesday, August 18, to show a -14.9% y/y contraction for the three most severe months of the pandemic-induced lockdown, in line with the monthly GDP proxy.
—Brett House
ARGENTINA: JULY INFLATION COMES IN JUST BELOW EXPECTATIONS
Recapping developments from last week, July inflation data released on Thursday, August 13, showed official price increases were a bit more muted than anticipated by both the consensus and our forecasts, but core measures moved up.
- Headline inflation came down from 2.20% m/m in June to 1.90% m/m in July, below the 2.15% m/m consensus and our 2.00% m/m projection (chart 1). Price gains were led by appliances, clothing, and leisure.
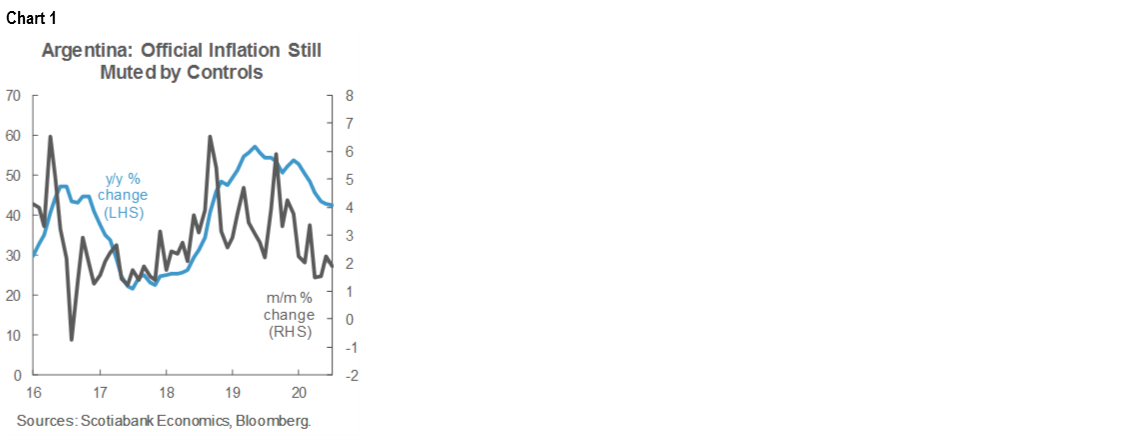
- Level effects meant that annual inflation continued to come down from 42.8% y/y in June to 42.4% y/y in July.
- Core inflation moved up from 2.3% m/m in June to 2.5% m/m in July, which pushed annual core inflation up to 46.2% y/y.
Government price controls and monitoring continue to keep official inflation below what would be implied by movements in the fiscal balance, the monetization of the fiscal deficit by the BCRA, and recent depreciation in the ARS.
—Brett House
COLOMBIA: Q2 CONTRACTION IN LINE WITH FORECASTS; END-2020 INFLATION EXPECTATIONS REMAIN BELOW 2%
I. The economy contracted by -15.7% y/y in Q2-2020, close to expectations
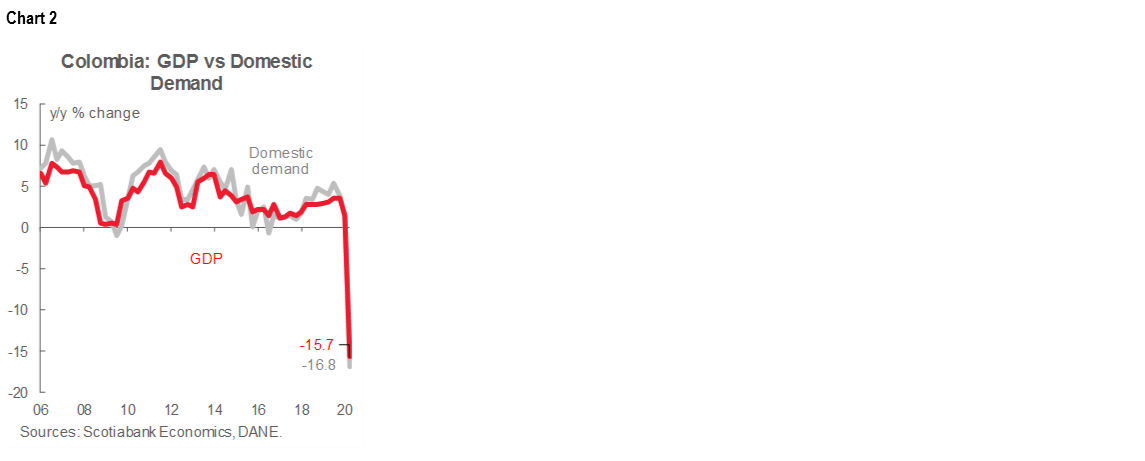
On Friday, August 14, DANE released Q2-2020 GDP growth data. Real GDP growth in Q2 came in at -15.7% y/y (chart 2), the highest contraction in recent history. GDP results were close to market consensus of -15.4% y/y (according to Bloomberg survey) and close to our expected -15.2% y/y. Construction, manufacturing, and commerce accounted for 77.6% of the total contraction. Additionally, Q1 growth was revised up to 1.4% y/y from the 1.1% y/y initially published.
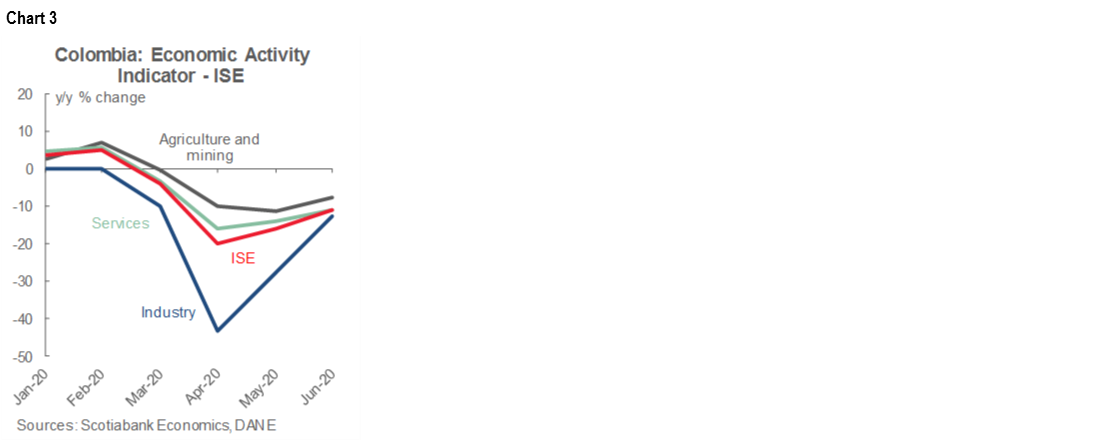
During the second quarter, the Colombian economy was under strict quarantine measures to control the pandemic outbreak, as was the case in most countries. The strongest phase of the lockdown was in April with around 36% of the economy shut down according to our estimates. Mobility restrictions weighed on economic activity, however, the economic recovery process is underway according to the ISE index (monthly GDP proxy). In fact, in April, ISE contracted -20.1% y/y, while in May -16.2% y/y and in June -11.1% y/y (chart 3), on the back of the re-opening process that began on April 27.
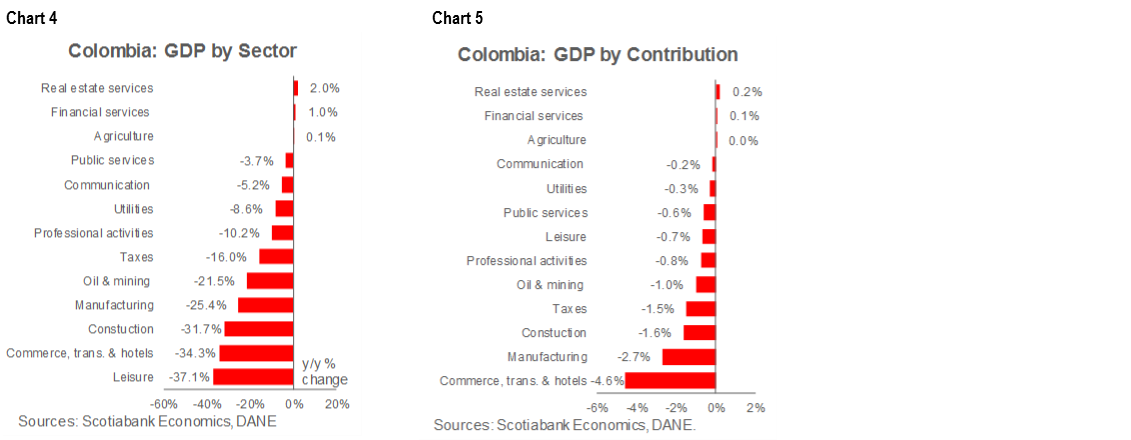
From the supply-side point of view, nine out of twelve sectors contracted in Q2-2020 (charts 4 and 5). Leisure activities contracted the most (-37.1% y/y, chart 4) since social distancing affected massive entertainment events. However, activities that accounted for the major proportion of economic contraction were commerce, transport and hotels (-34.3% y/y); manufacturing (-25.4% y/y) and construction (-31.7% y/y). On the positive side, financial services expanded by 1.0% y/y, real estate activities grew by 2.0% y/y and the agriculture sector was almost flat at 0.1% y/y; that said, all of them lost momentum compared to pre-COVID-19 growth.
Domestic demand fell by -16.8% y/y in Q2 (chart 2, again) owing to a huge contraction in investment (-32.2% y/y), especially in building investment (-36.7% y/y) and machinery (-11.6% y/y). Additionally, private consumption contracted by -15.9% y/y on the back of deteriorations in durable goods (-35.4% y/y) and services (-21.2% y/y), while perishable goods consumption growth remained positive (2.5% y/y). On the other side, government spending increased by 3.0% y/y owing to strong fiscal efforts to counter the pandemic’s economic impact. We anticipate that government consumption will continue increasing for the rest of 2020.
Net exports contributed positively to y/y growth in Q2-2020 because imports contracted by more in value terms (-28.8% y/y) than exports of (-27.4% y/y). Global demand for mining production is weighing on exports, but the huge contraction in domestic consumption and investment activities should continue to constrain imports and support Colombia’s external trade balance. Having said that, we continue to project a current account deficit of -4.1% of GDP or worse in 2020.
All in all, Q2-2020 was the worst quarter in recent history for the Colombian economy, but it was broadly in line with expectations. Some green shoots have, however, appeared as the re-opening process has continued. The ISE indicator, a coincident indicator that tracks the economic activity and serves as the country’s monthly GDP proxy, showed improvements in May and June on the back of recoveries in primary activities (agriculture and mining) and secondary activities (industry and construction). For full-2020, we expect a GDP contraction of around -7.5% y/y. The main challenges will come from the demand side due to significant employment losses.
Under existing data and our current forecasts, we continue to expect a final -25 bps rate cut from BanRep at the August 31 monetary policy meeting to end this easing cycle at 2.00%.
II. End-2020 inflation expectations remained below 2% in 2020 in August’s BanRep survey
- According to the August’s BanRep survey of macroeconomic expectations, published on Friday, August 14, analysts’ consensus now puts inflation at 1.85% y/y for December 2020, 4 bps lower than last month. Inflation expectations (IE) for longer tenors also fell: the 1Y tenor stood at 2.74% y/y (previous 2.85% y/y), and 2Y at 3.12% y/y (chart 6). For December 2021, inflation is expected below 3% y/y, on the back of weaker demand as government aid is withdrawn.
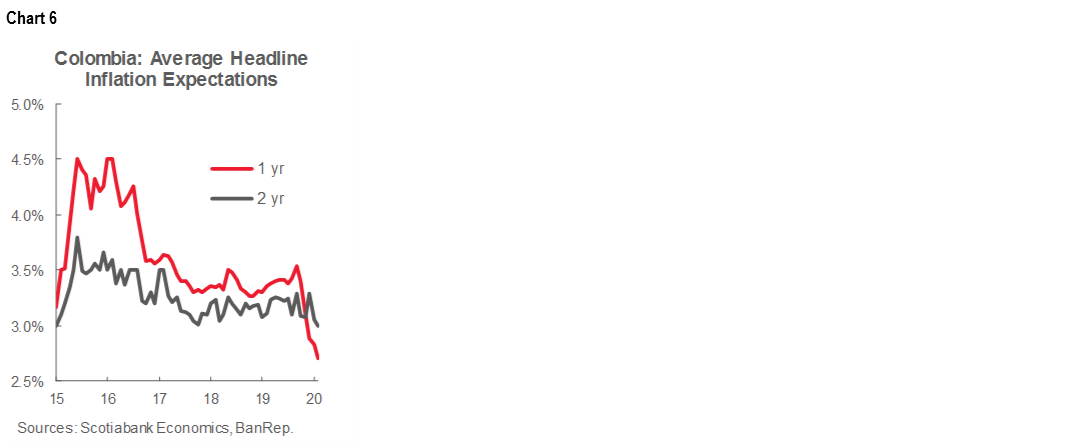
- On average, August’s monthly inflation was expected to be 0.09% m/m (we expect 0.37% m/m), which would leave annual inflation at 1.97% y/y. It is worth noting that in August some local governments are ending support on utility fees. Additionally, the VAT on cell phone plans will be in place again. For the longer term, the economic downturn will continue to exert negative pressure on core prices, especially on rents.
- USDCOP forecasts for end-2020 stood at USDCOP 3,691 (a depreciation of 13 pesos from the previous survey). For December 2021, respondents think (on average) that the USDCOP will end at 3,558. We believe that volatility will continue, although our FX models point to an equilibrium level around 3,600–3,700 by the end of the year.
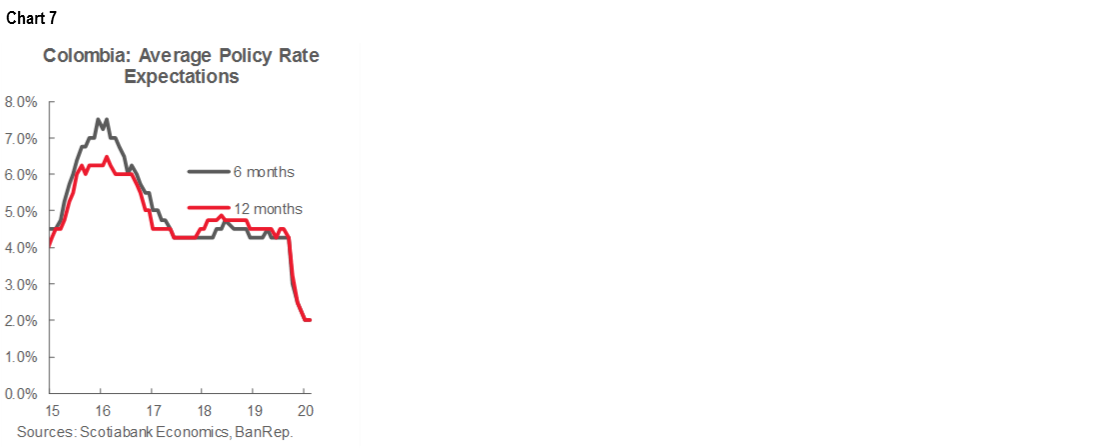
- BanRep’s repo rate is expected to close 2020 around 2.0%, according to the median of the respondents, 25 bps lower than the current level (chart 7). The first hike of -25 bps is expected by September-2021, earlier than the previous estimated survey. The monetary policy rate is expected to reach 2.50% by the end of 2021. For August’s meeting, analysts' consensus points to a rate cut of -25 bps, with no one expecting a -50 bps cut. On the other hand, the lowest expectation among analysts in the forecast window is 1.50%.
- BanRep’s survey showed that expectations point to a close of 2020 that would see inflation much lower than the 3% y/y target and outside the +/- 1 ppt tolerance range. However, expectations remained anchored near the target of 3% in the longer term. August’s CPI inflation should be positive since some regional subsidies for utility fees have expired and the application of VAT to cell phone plans has resumed. Since risks tilt toward a more moderate recovery in economic growth and upside pressures on inflation are low for now, the survey’s results do not alter our expectation of a -25 bps cut in the monetary policy rate at the August 31 meeting to 2.00%.
—Sergio Olarte & Jackeline Piraján
PERU: BCRP MAINTAINED ITS POLICY RATE AT 0.25%; 2020 CY FISCAL DEFICIT TO JULY WAS IN LINE WITH EXPECTATIONS; CEMENT SALES SURPRISED TO THE UPSIDE IN JULY
The BCRP kept the reference rate at 0.25%, as widely expected, at its meeting late on Thursday, August 13. The BCRP reiterated its intention to keep monetary policy strongly expansionary over a prolonged period of time, in line with our forecast of no change in the reference rate until late 2021, at the earliest. The BCRP did, however, mention that it saw signs of economic recovery in July over June. In the accompanying press conference, the BCRP stated that it maintained its forecast of 0% inflation in 2020 and 0.5% in 2021. Thus, neither the increase in yearly inflation to 1.9% in July, which the BCRP characterized as “temporary”, nor the signs of recovery in the economy that they mentioned, have swayed the BCRP to revise their forecasts for inflation. This may be just a question of timing. We maintain our forecasts of 1.1% inflation in 2020 and 1.5% in 2021.
The BCRP released fiscal deficit information for July on August 14. The fiscal deficit for the year-to-July amounted to PEN 16.8 bn, or between 4% and 5% of GDP. This is in line with our expectations of an 8.6% of GDP fiscal deficit for full-year 2020. In comparison, in the same period in 2019, Peru had a PEN 7 bn fiscal surplus. The major driver behind the turnaround has been a PEN 19.4 bn or -21.4% y/y contraction in fiscal revenue for the first seven months of the year. Meanwhile, growth in government expenditure was nil compared to the same period last year. Going forward, the trends are likely to shift, with government spending increasing and the decline in fiscal revenue softening.
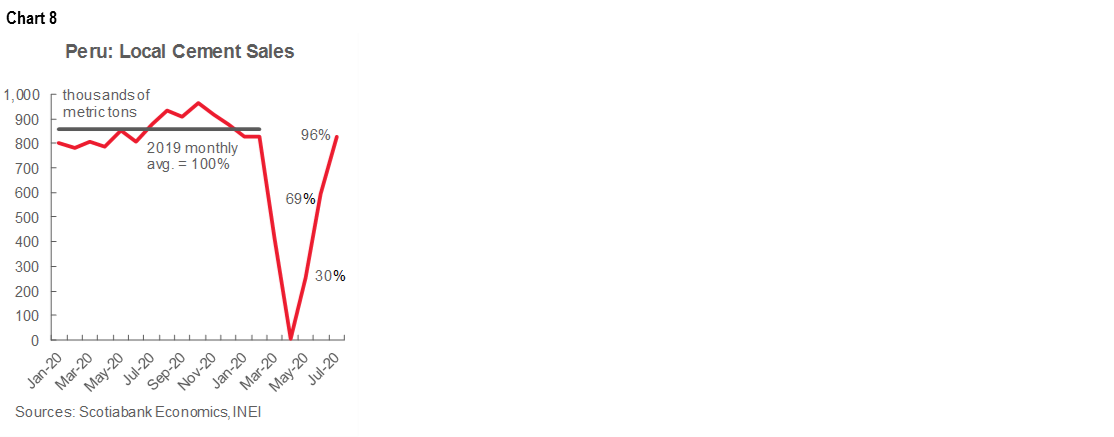
Cement sales in Peru surged in July, up 39% m/m with respect to June (chart 8). Perhaps more importantly, cement sales in July represented 96% of average monthly cement sales in 2019, up from 69% in June. Thus, using the monthly average for 2019 as a benchmark, cement consumption in July was just 4% off its pre-COVID-19 levels. We had expected cement consumption to rise in July, but the magnitude of the rebound surprised us.
—Guillermo Arbe
DISCLAIMER
This report has been prepared by Scotiabank Economics as a resource for the clients of Scotiabank. Opinions, estimates and projections contained herein are our own as of the date hereof and are subject to change without notice. The information and opinions contained herein have been compiled or arrived at from sources believed reliable but no representation or warranty, express or implied, is made as to their accuracy or completeness. Neither Scotiabank nor any of its officers, directors, partners, employees or affiliates accepts any liability whatsoever for any direct or consequential loss arising from any use of this report or its contents.
These reports are provided to you for informational purposes only. This report is not, and is not constructed as, an offer to sell or solicitation of any offer to buy any financial instrument, nor shall this report be construed as an opinion as to whether you should enter into any swap or trading strategy involving a swap or any other transaction. The information contained in this report is not intended to be, and does not constitute, a recommendation of a swap or trading strategy involving a swap within the meaning of U.S. Commodity Futures Trading Commission Regulation 23.434 and Appendix A thereto. This material is not intended to be individually tailored to your needs or characteristics and should not be viewed as a “call to action” or suggestion that you enter into a swap or trading strategy involving a swap or any other transaction. Scotiabank may engage in transactions in a manner inconsistent with the views discussed this report and may have positions, or be in the process of acquiring or disposing of positions, referred to in this report.
Scotiabank, its affiliates and any of their respective officers, directors and employees may from time to time take positions in currencies, act as managers, co-managers or underwriters of a public offering or act as principals or agents, deal in, own or act as market makers or advisors, brokers or commercial and/or investment bankers in relation to securities or related derivatives. As a result of these actions, Scotiabank may receive remuneration. All Scotiabank products and services are subject to the terms of applicable agreements and local regulations. Officers, directors and employees of Scotiabank and its affiliates may serve as directors of corporations.
Any securities discussed in this report may not be suitable for all investors. Scotiabank recommends that investors independently evaluate any issuer and security discussed in this report, and consult with any advisors they deem necessary prior to making any investment.
This report and all information, opinions and conclusions contained in it are protected by copyright. This information may not be reproduced without the prior express written consent of Scotiabank.
™ Trademark of The Bank of Nova Scotia. Used under license, where applicable.
Scotiabank, together with “Global Banking and Markets”, is a marketing name for the global corporate and investment banking and capital markets businesses of The Bank of Nova Scotia and certain of its affiliates in the countries where they operate, including, Scotiabanc Inc.; Citadel Hill Advisors L.L.C.; The Bank of Nova Scotia Trust Company of New York; Scotiabank Europe plc; Scotiabank (Ireland) Limited; Scotiabank Inverlat S.A., Institución de Banca Múltiple, Scotia Inverlat Casa de Bolsa S.A. de C.V., Scotia Inverlat Derivados S.A. de C.V. – all members of the Scotiabank group and authorized users of the Scotiabank mark. The Bank of Nova Scotia is incorporated in Canada with limited liability and is authorised and regulated by the Office of the Superintendent of Financial Institutions Canada. The Bank of Nova Scotia is authorised by the UK Prudential Regulation Authority and is subject to regulation by the UK Financial Conduct Authority and limited regulation by the UK Prudential Regulation Authority. Details about the extent of The Bank of Nova Scotia's regulation by the UK Prudential Regulation Authority are available from us on request. Scotiabank Europe plc is authorised by the UK Prudential Regulation Authority and regulated by the UK Financial Conduct Authority and the UK Prudential Regulation Authority.
Scotiabank Inverlat, S.A., Scotia Inverlat Casa de Bolsa, S.A. de C.V., and Scotia Derivados, S.A. de C.V., are each authorized and regulated by the Mexican financial authorities.
Not all products and services are offered in all jurisdictions. Services described are available in jurisdictions where permitted by law.