

By Julien Champagne
• Canada is an economy of small and medium businesses (SMEs). While SMEs account for two-thirds of employment and over 55% of GDP, they account for only 49% of investment and only 0.1% of small firms eventually become large (ISED, 2021).
• This matters because productivity growth mostly comes from smaller and younger firms that grow fast and become large. While SMEs are on average 37% less productive than large firms, SMEs that grow fast (“high growth”) are more productive than the average SME before scaling up and become even more productive after, fostering growth through the process. Moreover, they account for a disproportionate share of employment growth: Canadian high-growth firms accounted for 41% of net employment change between 2009 and 2012 (ISED, 2017).1
• Canada has long suffered from an investment and productivity deficit. The core of the Federal government’s transformation agenda is to raise investment across various areas to increase economic security and prosperity. While the focus is on projects at the national scale targeting major businesses, future productivity growth will need to come in part from SMEs.
• As a case in point, we estimate that SMEs have contributed for most of the (meagre) productivity growth Canada has experienced recently. Large firms, and the reallocation of hours worked across sectors and between SMEs and large firms, have not been important drivers of productivity growth.
• We estimate a huge potential productivity payoff from higher productivity in SMEs. We perform several counterfactual exercises and estimate that economy-wide labour productivity could rise between 3 and 32% depending on the improvement in SME productivity.
• Policy objectives should be growth, not size. Broad-based systemic reforms reducing internal trade barriers to expand market size, lowering fixed regulatory costs, incentivizing more growth capital, and tax reforms that smooth out size thresholds and reduce distortions are critical to fostering an economic environment where SMEs can scale up.
The level and evolution over time of labour productivity is an important barometer for the economy as it determines long-term growth and improvements in living standards. The distribution of the size of an economy’s firms has a large impact on productivity outcomes. This reality has been largely overlooked. This note drills down on SMEs, their potentially important role in raising productivity growth and identifies some policy measures to foster growth in these firms.
SME firms (defined in this report as those with less than 500 employees) are on average 37% less productive than larger ones (defined as firms with more than 500 employees). It is easier for large firms to absorb the fixed costs of innovation and technology adoption; they also have higher capital intensity; better access to wider markets (e.g. exports) and get cheaper credit. Moreover, regulatory burdens often represent a higher cost for smaller firms relative to larger firms. The Canadian Federation of Independent Business estimates that the annual regulation cost per employee is 5 times larger for small firms than for large firms (CFIB, 2025). All these factors contribute to higher productivity in larger firms compared to SMEs. And because they are more productive, larger firms pay on average higher wages than SMEs.
But smaller firms typically drive the creative destruction process: economic growth comes from relatively new firms with new ideas, products or services, where the most productive firms expand and the weaker firms exit. An economy where small and medium enterprises grow and compete with large firms should experience higher economic growth.
This is of relevance for Canada since SMEs are a long-standing and distinctive feature of the Canadian economy. But while the vast majority of Canadian firms are SMEs, most of them are small and very few scale up. However, we highlight that significant churn is expected in Canadian SMEs as 20% of business owners are expected to retire and sell in the next five years (BDC, 2026). This is a generational opportunity for SMEs to acquire other small firms, scale up their businesses and invest that provides a unique moment to raise the economy-wide productivity.
1. The Canadian SME landscape
Canada has a scale-up problem. Few SMEs become large. Over 90% of all size-class transitions occur among firms with fewer than 20 employees. Fewer than 0.1% of firms move from medium to large, and only 0.5% moved from 20–49 to 50–99 employees, suggesting firms struggle to grow past thresholds of 20 and 50 employees (ISED, 2021).2
Canadian SMEs mostly start at micro level (1–4 employees) and the smallest firms fail more. Over the 2018–22 period, 91% of new businesses started with 1–4 employees. 63% of these survived 5 years and 45% survived 10 years, while the shares of survivors increase to 75% and 56% for firms starting with 20–99 employees (ISED, 2026).3
Micro firms generally remain micro. A 2002–06 cohort study of Canadian startups shows that 93% of entrants have 1–4 employees, and 87% of start-ups never change size class over their lifetime. Only 4.2% of start-ups scale up sustainably. About 90% of small firms that move up a size class later move back down (ISED, 2021).
Growth happens early in firms’ lifecycle. About 75% of all firms scaling up occur within a firm’s first five years, and the likelihood of scaling up falls steadily with age (ISED, 2021). This matters because growth is concentrated. For example, high-growth firms accounted for about 41% of net employment change in Canada in 2009–2012 (ISED, 2017). Evidence from other countries support this. In the U.S., high-growth firms, mostly young, accounted for 59% gross job creation over the 1996–2013 period (Haltiwanger et al., 2017). Similarly, among European SMEs experiencing growth within a given year, high-growth SMEs account for two-thirds of jobs created, and young European SMEs are much more likely to scale their businesses than older SMEs (OECD, 2025).4
Firms that scale up become more productive. Consistent with larger firms being more productive than smaller firms, firms that scale experience increases in productivity and thus profitability. For instance, Canadian SMEs that acquire other SMEs report profits that are four times higher relative to SMEs that did not acquire another business (BDC, 2026) after five years. European SMEs that scale up saw their productivity advantage over the average SME grow from 20% before scaling up to 35% after (OECD, 2025).
This matters because Canada’s SMEs make up a large share of economic activity but invest less than their share of GDP would suggest. There is a lot of potential for productivity growth as SMEs account for almost all businesses (99.7%), about 63% of private sector employment and 60% of payrolls (Figure 1); and 66% of hours worked and 56% of GDP (Figure 2). Despite this importance in economic activity, they account for less than half of the investment made in the economy (Gu, 2024). Most SMEs are very small: 63% of them have less than 5 employees but make up only about 7–8% of employment and payrolls (Figure 1). Large firms comprised only 0.3% of all businesses but account for 36% of employment and 40% of payrolls. While this is large relative to SMEs, it is materially lower than the contribution of U.S. large firms to the U.S. economy, which account for 54% of employment and 61% of payrolls (Figure 1).
Figure 1. Distribution of businesses, employment and payroll by firm size (number of employees), Canada vs. U.S., 2022
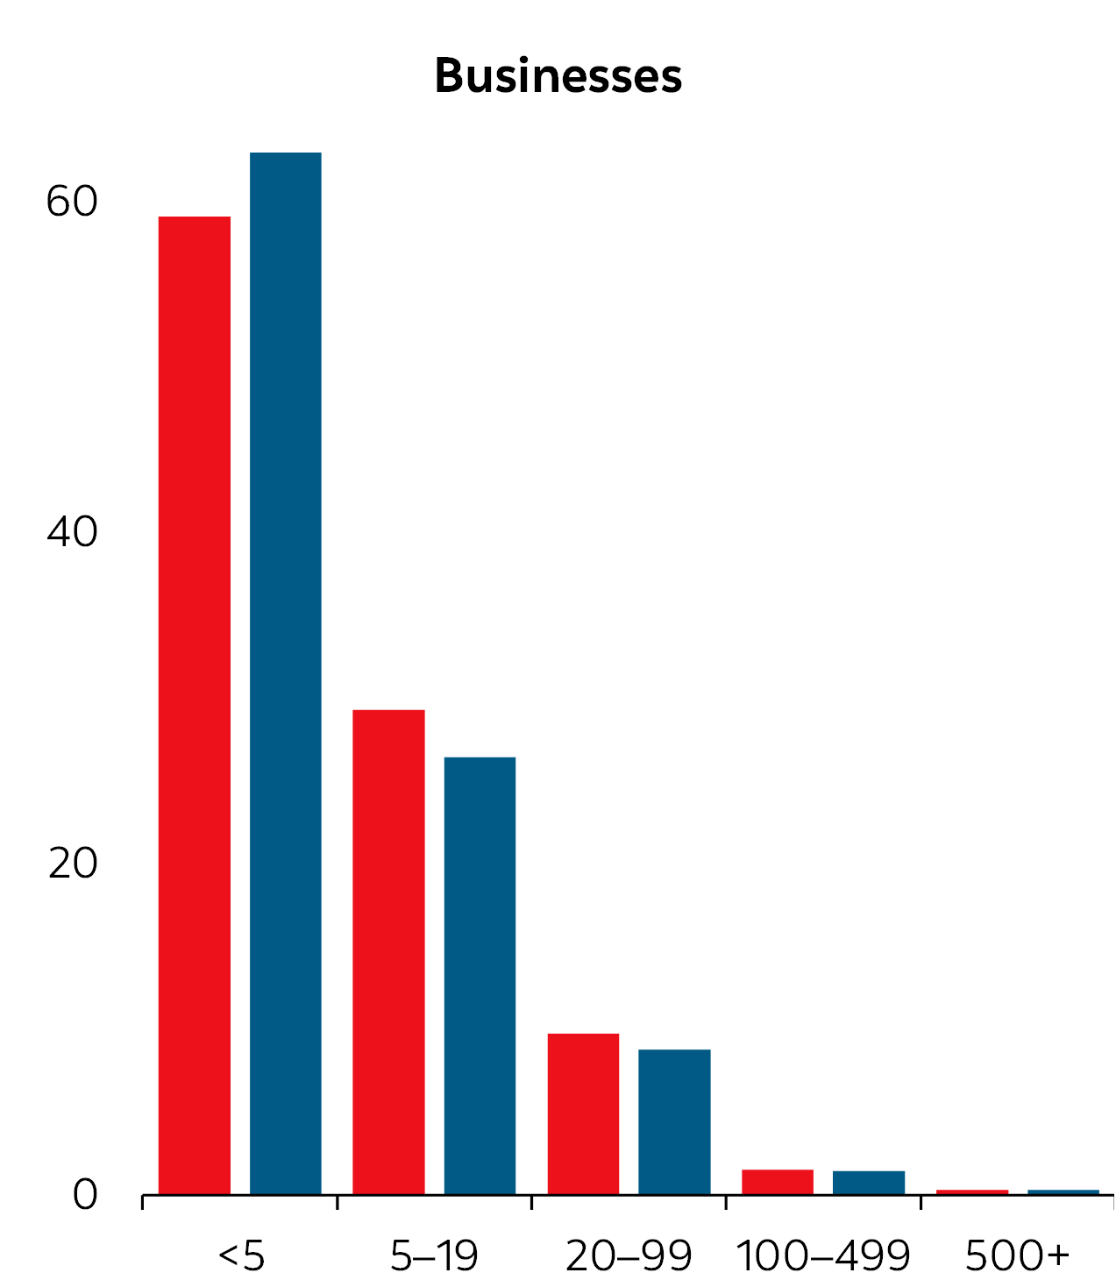
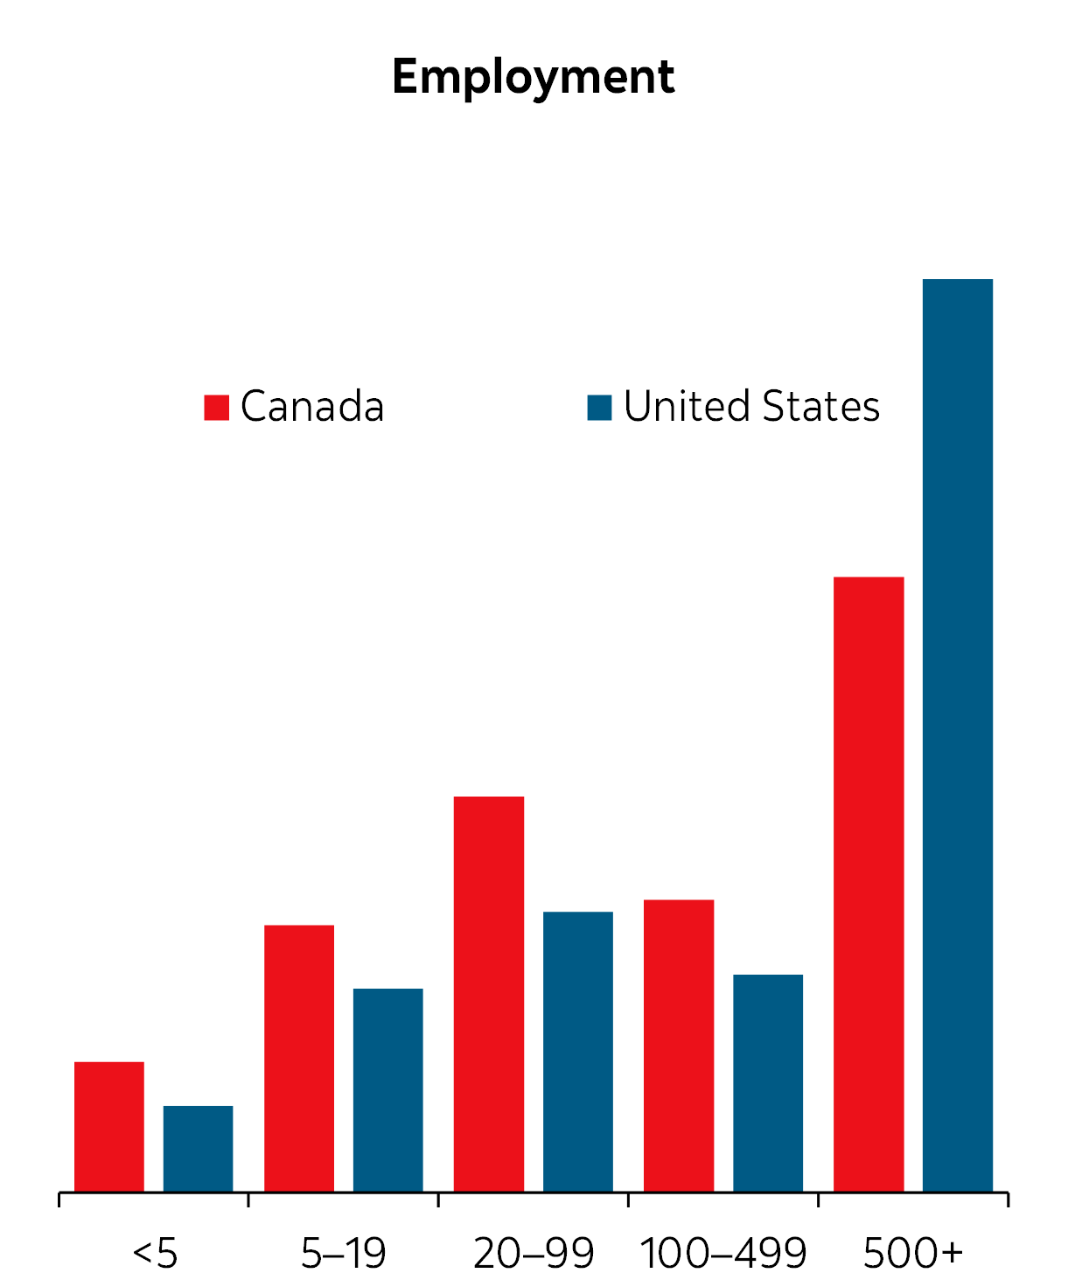
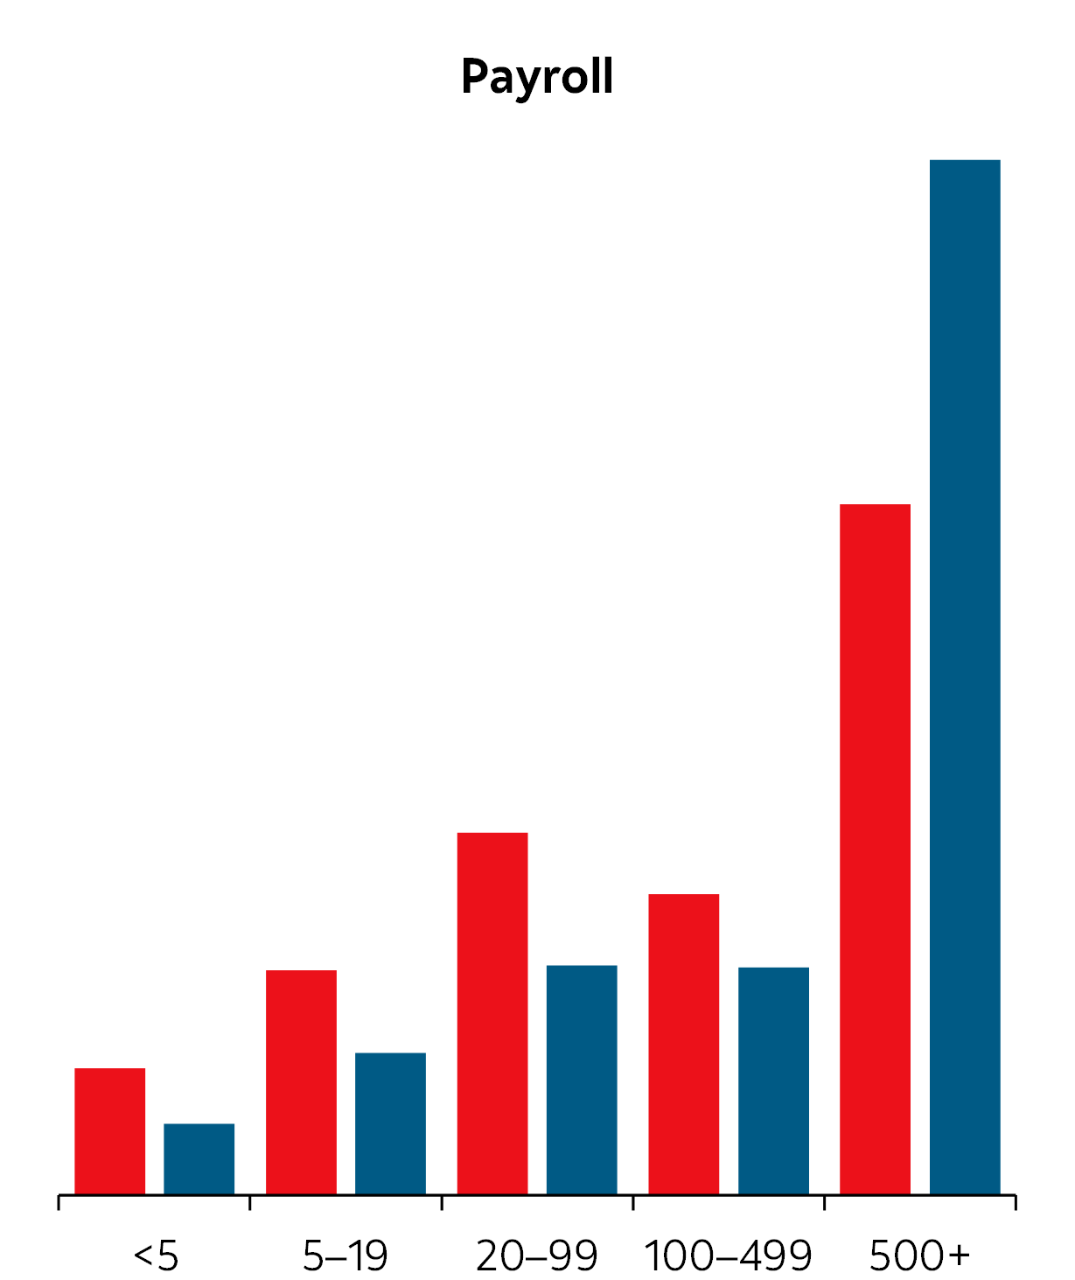
Canadian SMEs are smaller than those in the U.S. Canada’s SME are on average smaller than U.S. SMEs, but account for a larger share of private-sector employment and payroll (Figure 1), as well as a larger share of hours and GDP (Figure 2). The reason behind this is that large U.S. firms are bigger than those in Canada, averaging over 3,300 employees vs. about 1,350 for large Canadian firms.5
Canadian SMEs account for the bulk of employment across most sectors. Apart from selected sectors such as Finance and Insurance and Mining, Oil and Gas, the share of SME employment in most sectors is very high. For instance, 87% and 85% of employment in the Construction and Accommodation and Food sectors are in SMEs, respectively. While the share of SME employment in some Canadian industries is similar as in the U.S., many differ markedly. For instance, the share of SME employment in three large industries, i.e. Manufacturing, Retail trade, and Accommodation and Food is more than 20% higher in Canada relative to the U.S. (Figure 3).
Small firms account for the bulk of job creation and destruction. Over the 2001–23 period, they accounted for approximately 78% of new jobs created and jobs destroyed (Figure 2). This is materially higher than in the U.S., where SME generate about 57% of job turnover.6
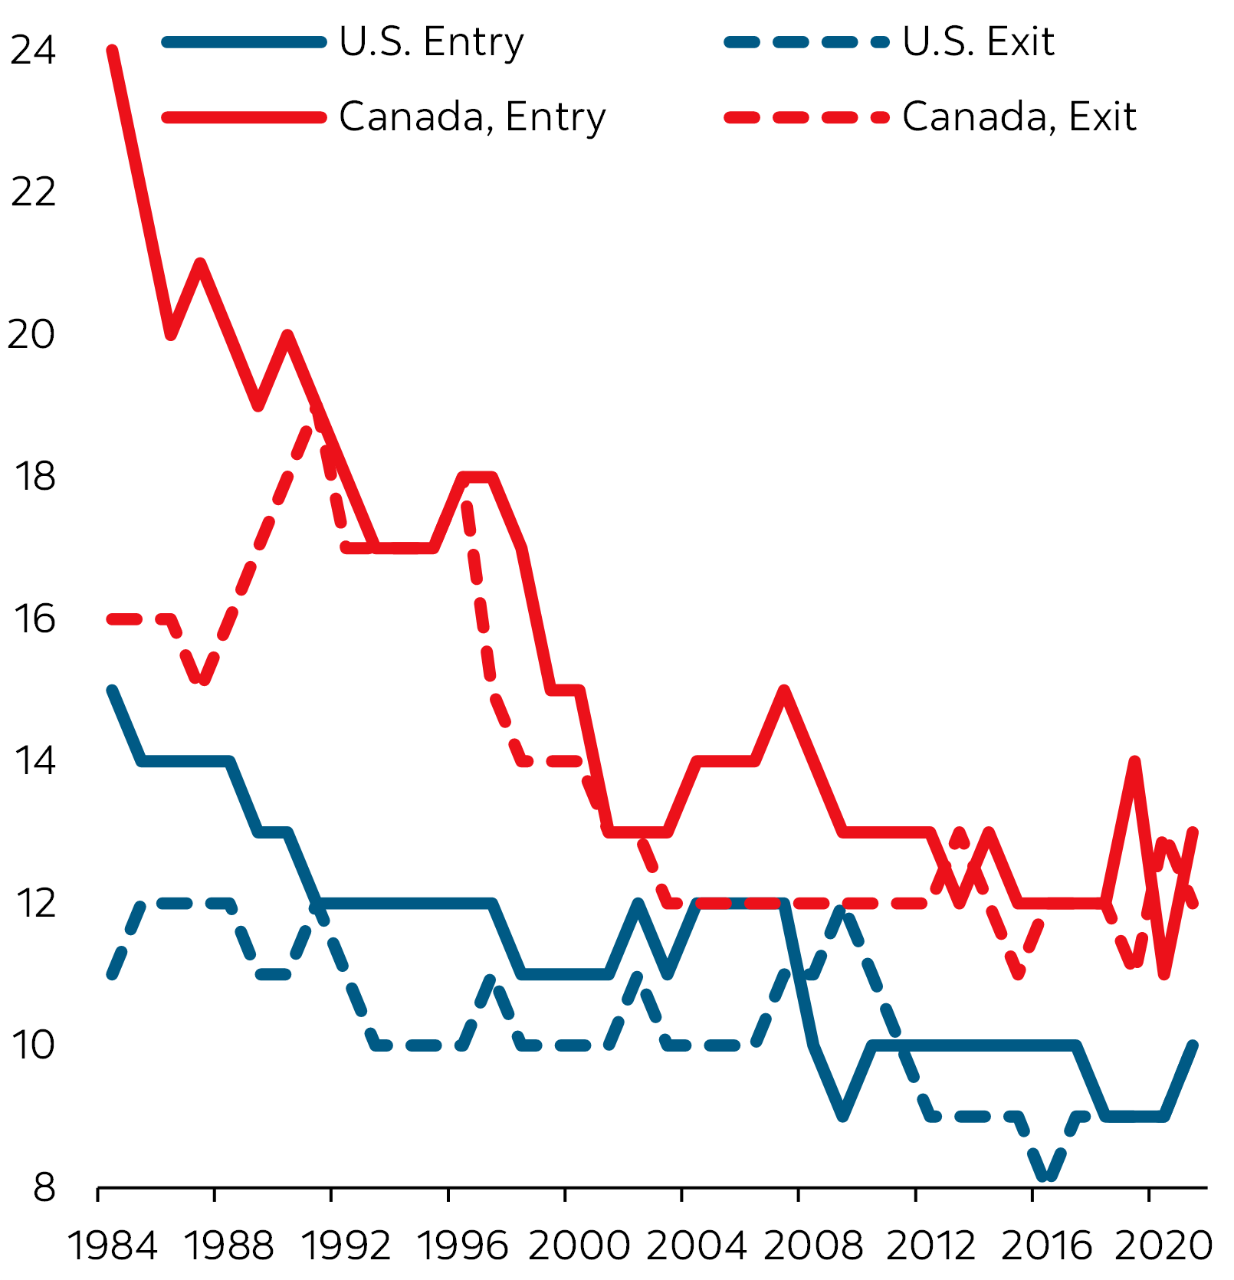
Business dynamism is declining but higher relative to U.S. From 1984 to 2021, Canada’s entry rate fell from 24% to 13% and its exit rate from 16% to 12%, while U.S. rates fell from 15% to 10% (entry) and 11% to 10% (exit). Canada rates have been higher than in the U.S., but this is probably the result of Canada having more very small firms than the U.S. (Figure 4).
Figure 2 – SME shares, Canada vs. U.S.
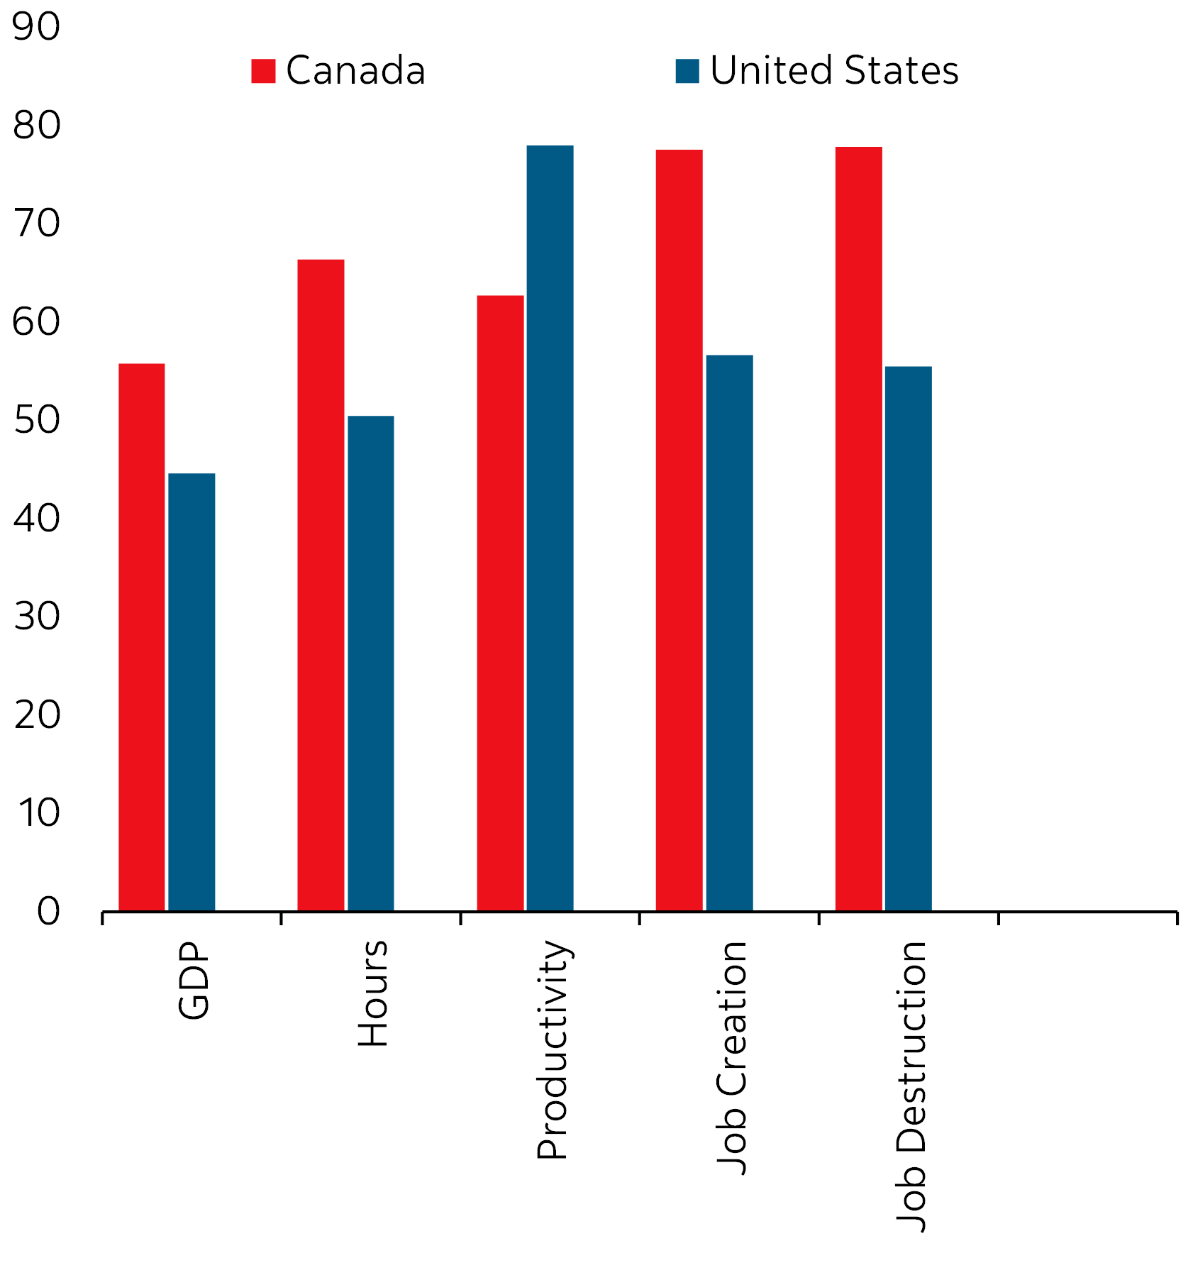
Figure 3 – SME share of employment by sector, 2022
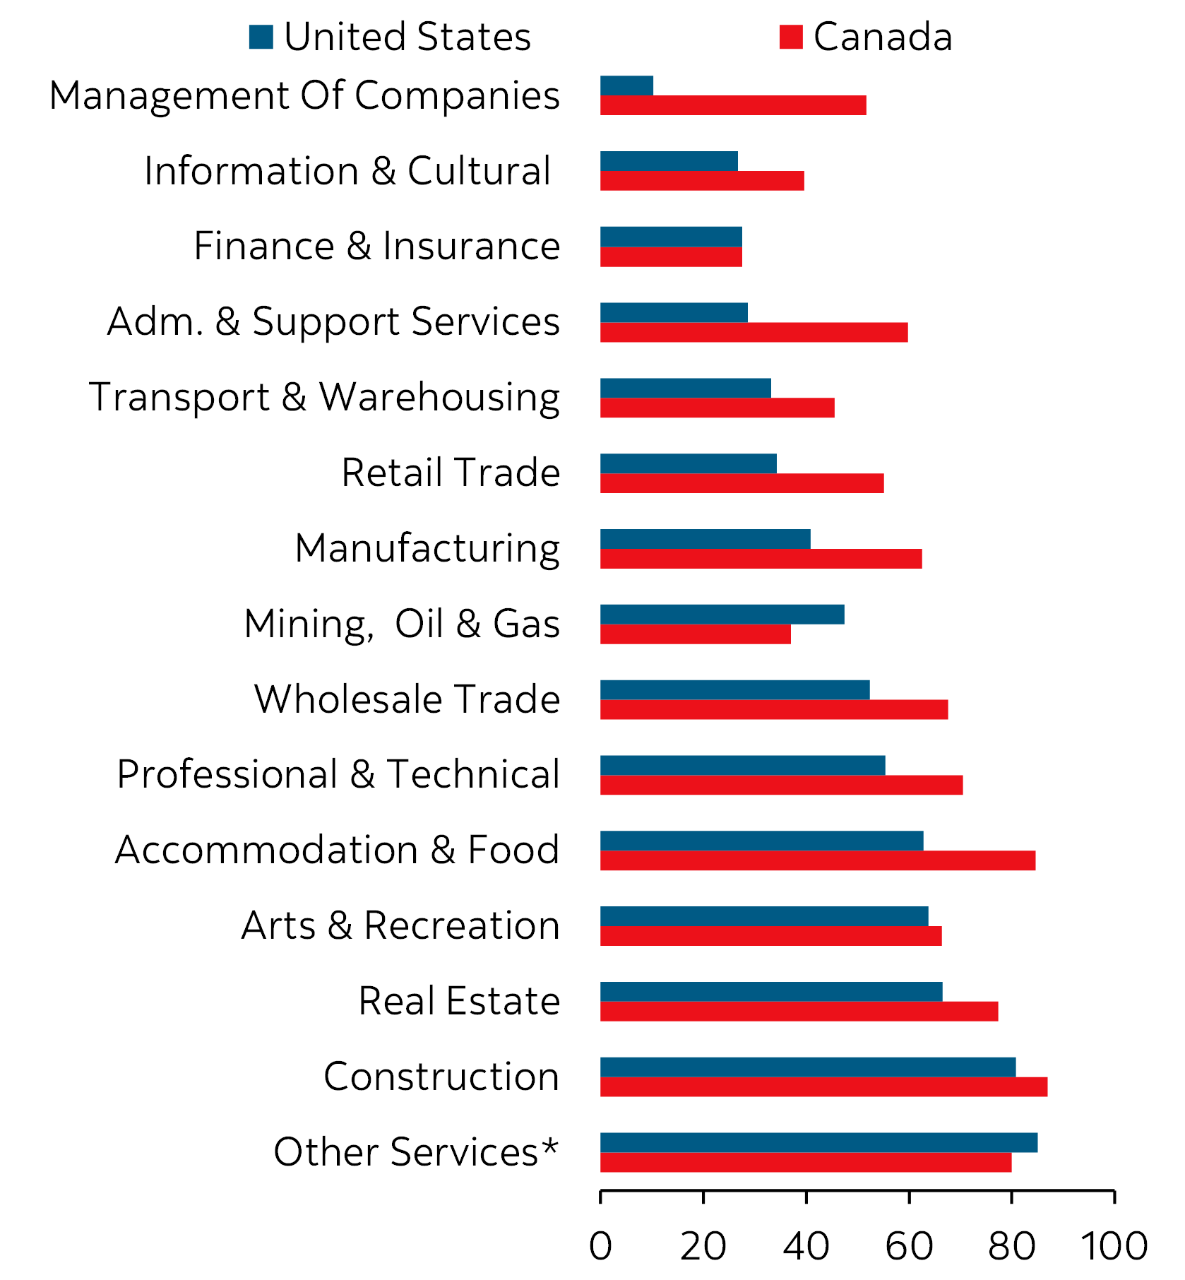
Figure 4 – Business entry and exit rates, Canada and the United States, 1984–2021
These facts matter now. About 20% of SME owners will retire in the next five years (BDC, 2026). This is a generational opportunity for SMEs contemplating to grow through acquisitions. SMEs that acquire other businesses report profits that are four times higher relative to SMEs that did not acquire another business five years after the purchase (BDC, 2026). Given the size of the SMEs in the Canadian economy, there is substantial potential from SMEs to support aggregate productivity growth going forward if more of them can scale up, invest and increase their productivity. We estimate in the next section their contribution to the weak labour productivity the Canadian economy experienced during the 2019–2025 period using a labour productivity decomposition. We then provide counterfactual scenarios to assess how different productivity-size distributions could impact Canadian labour productivity.
2. A Case in point: firm-size distribution and labour productivity growth since 2019
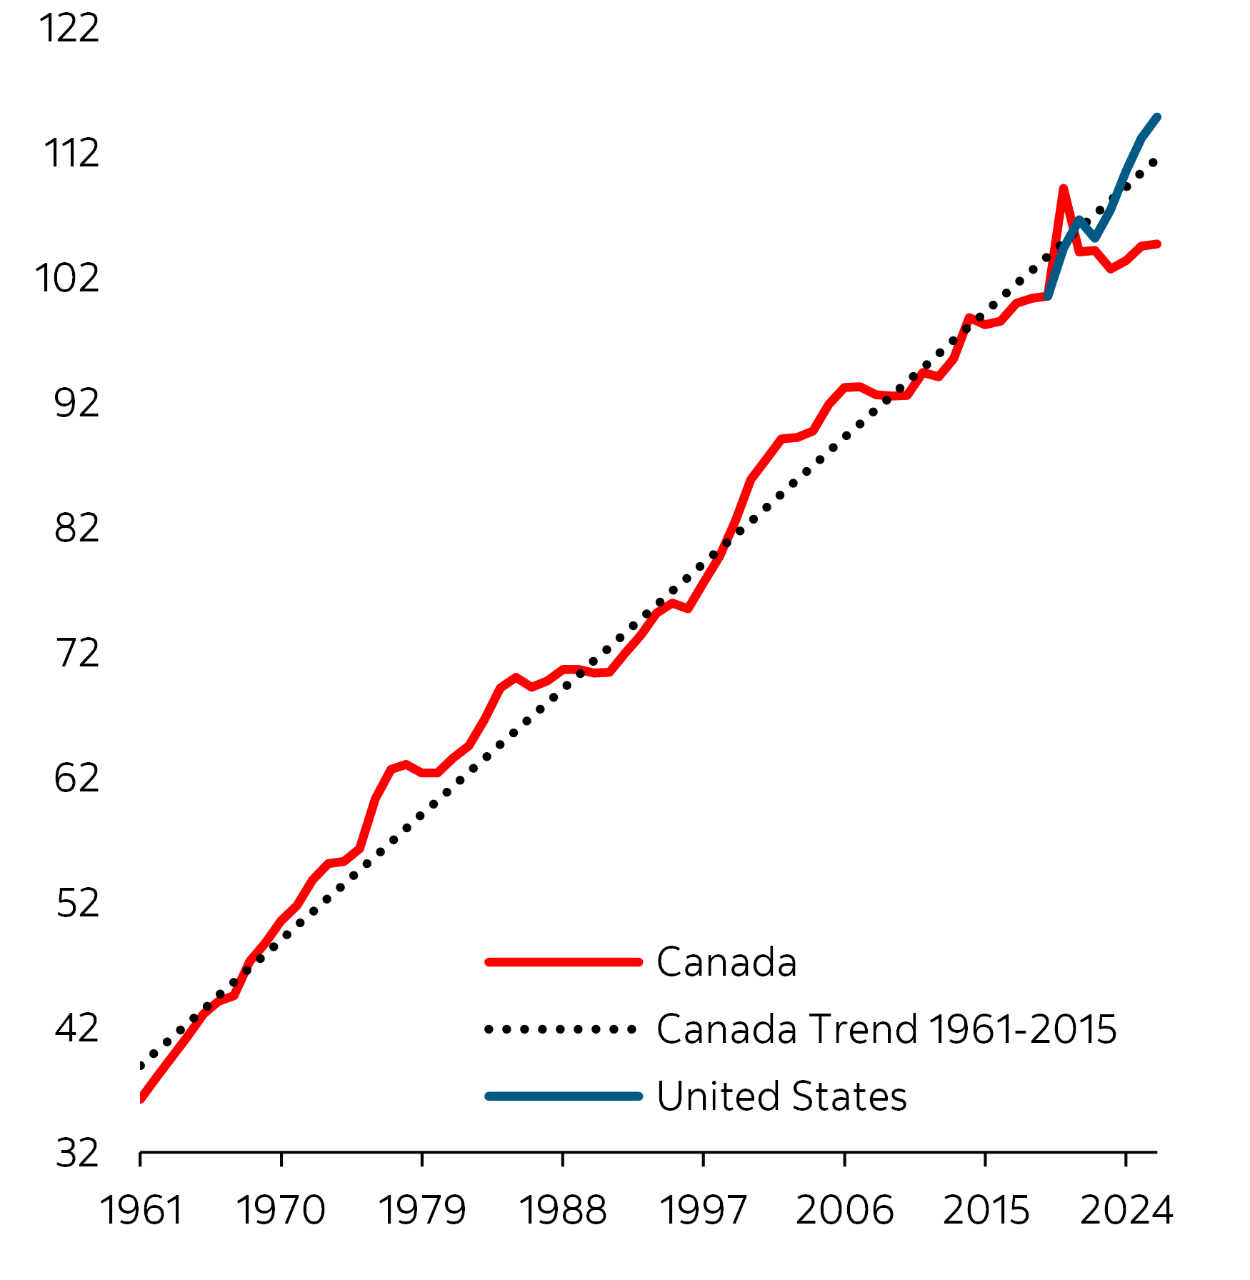
Canadian labour productivity has been weak. Canada has experienced weak labour productivity growth over the past decade. As of the end of 2025, the level of labour productivity sits almost 10% below the level implied by its 1961–2015 trend (Figure 5).7 We also plot the U.S. labour productivity, normalized in 2019 at the same value as for Canada. The divergence between 2019 and 2025 is striking: U.S. labour productivity has grown by 10 percentage points more than Canada’s since 2019. Many explanations have been put forward for Canada’s dismal productivity performance. For instance, chronic low business investment in machinery and equipment and intellectual property, coupled with strong growth in population has diluted capital per worker; slow technology and AI adoption; weak competition and internal trade barriers; regulatory burdens; and taxes and incentives have all been regularly cited as factors impeding growth.
Figure 5 – Labour productivity has diverged from the U.S.
Many of these same factors have also been put forward to explain why few Canadian SMEs scale up and, as a result, slows down aggregate labour productivity growth. Recall that SMEs account for roughly 64% of employment (Figure 1) but only 49% of investment (Gu, 2024).
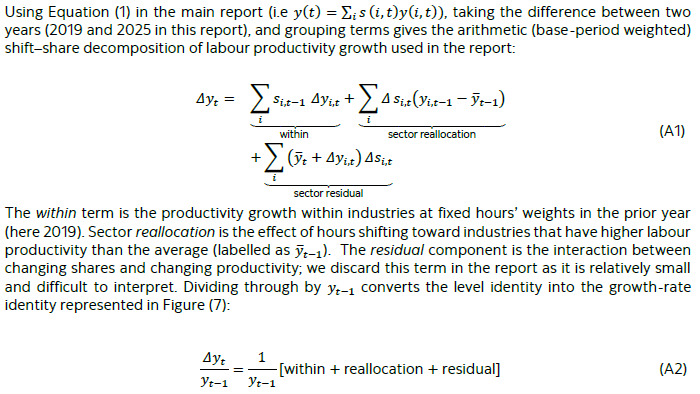
To make the case for the importance of SME in labour productivity growth, we provide a decomposition of growth over the 2019–2025 period using sector-level data.8 We start by looking at productivity across industries, and then we will turn to the firm-size dimension. Aggregate labour productivity in period t can be written as the sum of each sector’s labour productivity of the economy, weighted by its share of hours worked 𝑠𝑖,𝑡 (Equation 1).9

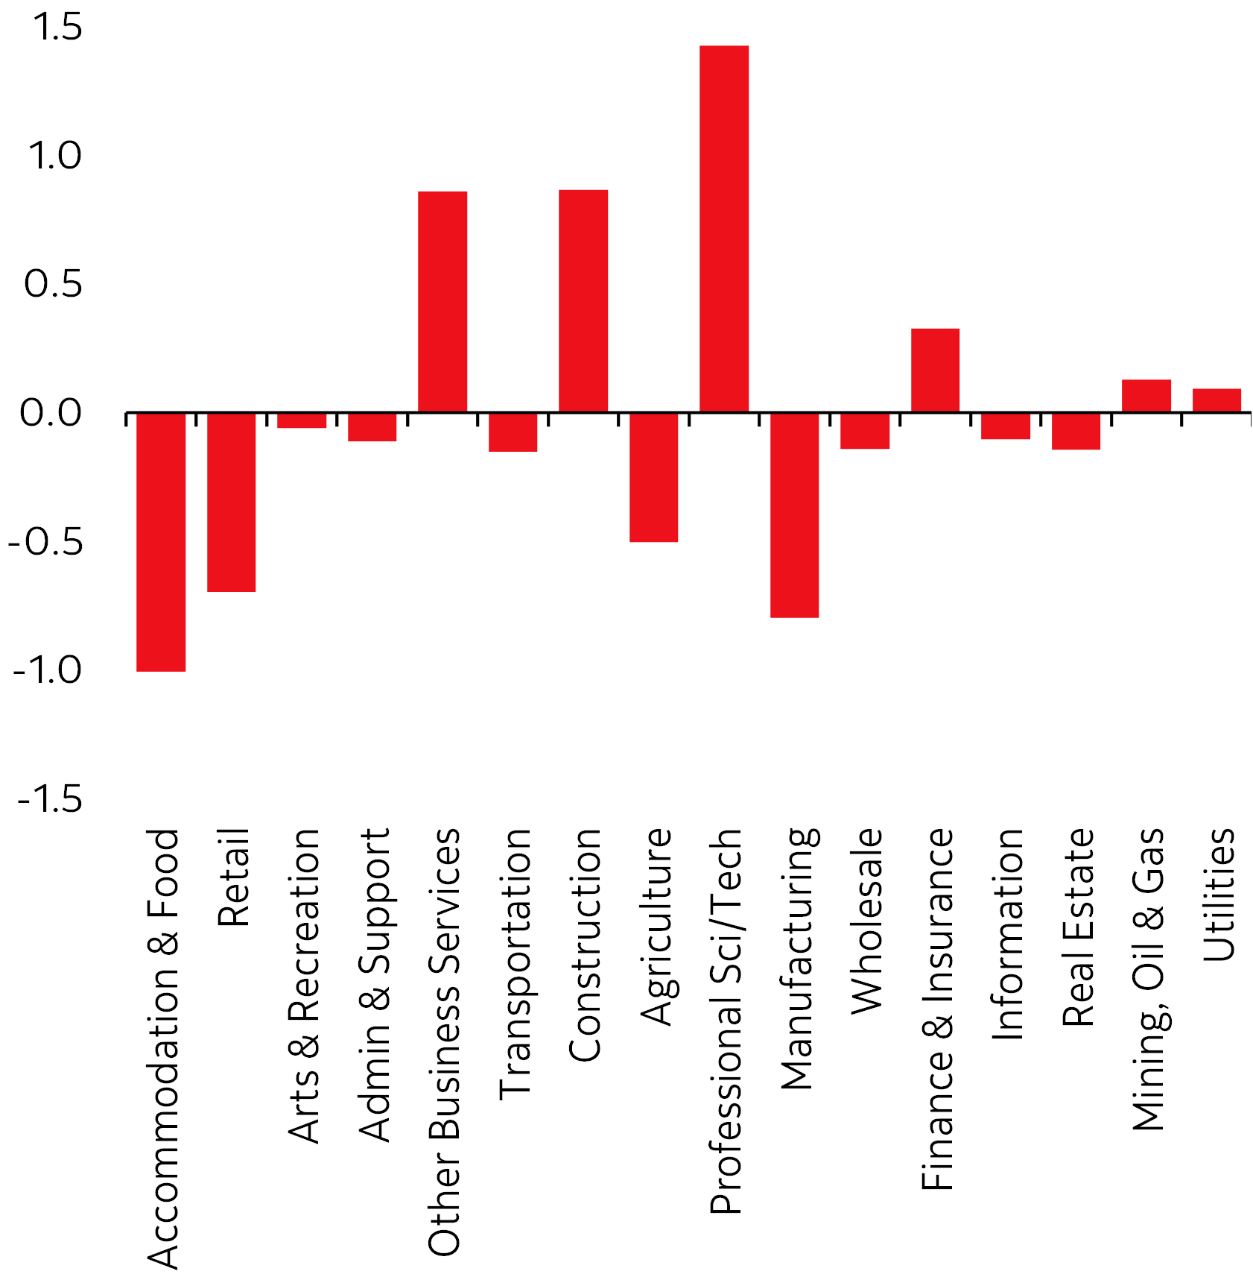
It is clear from Equation (1) that aggregate labour productivity growth can come from two sources: increases in labour productivity within sectors of the economy (the 𝐿𝑃𝑖,𝑡 terms), and from reallocation of hours across sectors (the hours shares, i.e. 𝑠𝑖,𝑡 terms). Figure 6 shows the changes in labour productivity (Panel A) and hours shares (Panel B) across sectors over the 2019–2025 period. Note that from left to right, sectors are ordered by their labour productivity levels, from lowest to highest. We note several interesting observations:
• Low-productivity sectors such as Food and Accommodation, Retail trade and Arts and Recreation have experienced marked increases in productivity over the period of interest. At the same time, their hours’ shares have decreased. Taken together, these have provided a boost to aggregate labour productivity.
• Construction and Manufacturing, two important sectors of the Canadian economy, have both experienced decreases in their sector’s productivity. While the Construction sector has importantly increase (share of hours increased by 0.9 percentage points), the Manufacturing sector decreased by about the same amount.
• Lastly, the two most productive sectors of the economy, Mining, oil and gas and Utilities, have both experienced declines in productivity while their shares are increased mildly, implying they provided a drag to aggregate labour productivity.
Figure 6A – Most sectors experienced modest growth
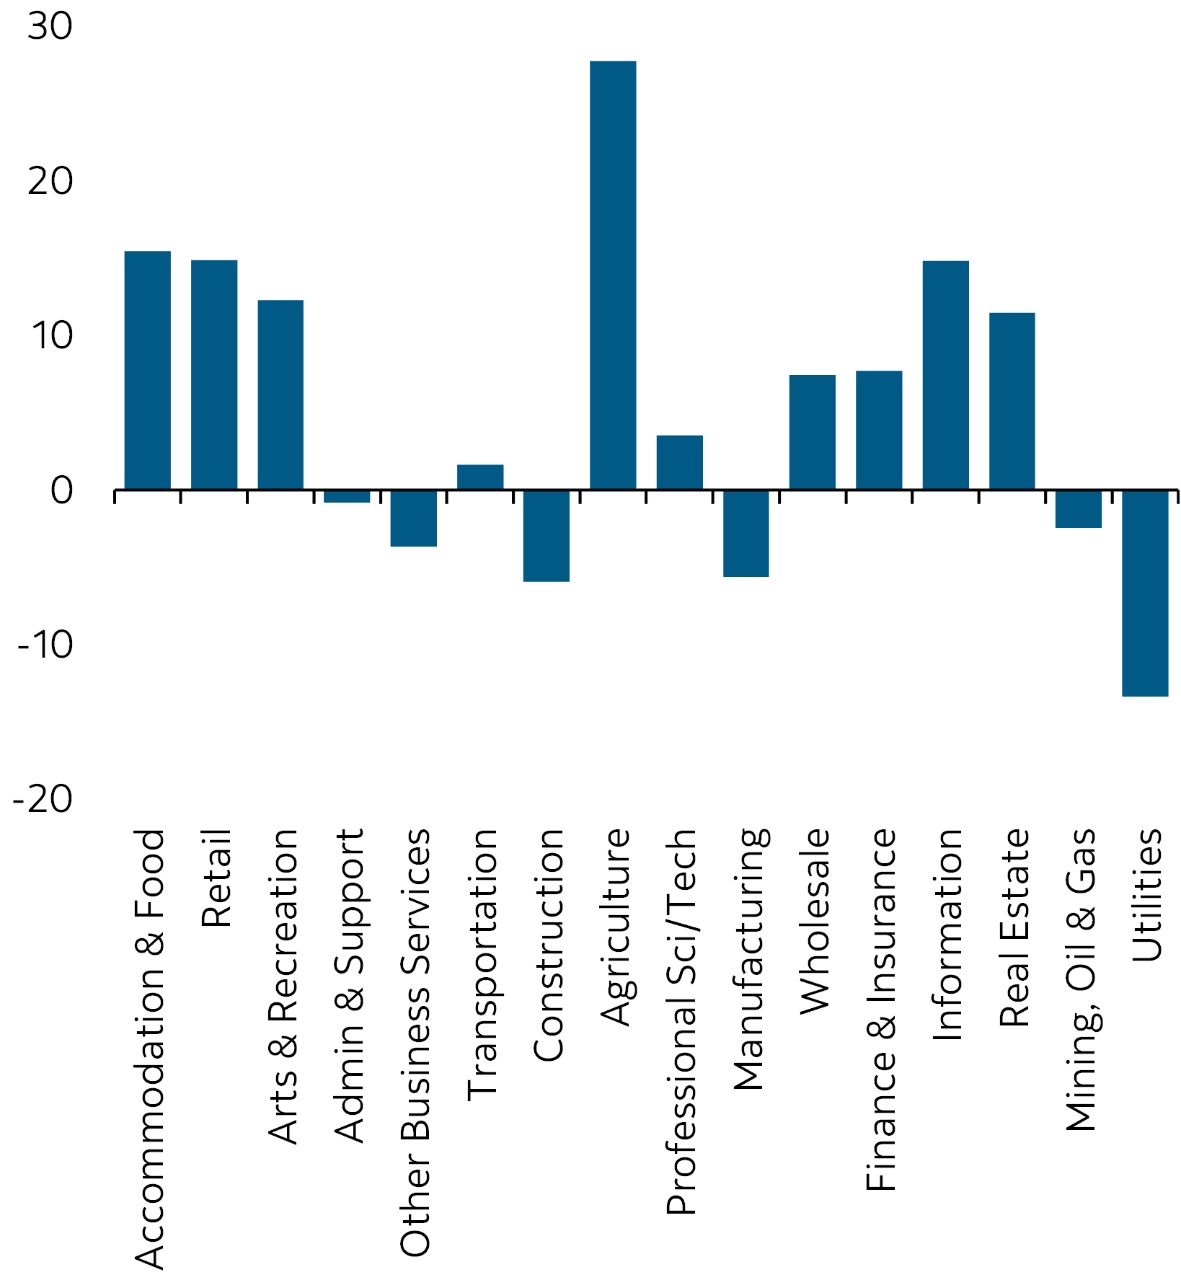
Figure 6B – No reallocation towards high-productivity sectors
Measuring contributions to productivity growth. While Figure 6 gives us an idea of where positive and negative contributions to labour productivity growth have come from, we need a framework to measure these contributions. We use an accounting decomposition where labour productivity growth over two periods (here between 2019 and 2025)10 can be decomposed into two contributions: (1) labour productivity growth within sectors (the 𝐿𝑃𝑖,𝑡 terms), and (2) reallocation of hours worked across sectors (the 𝑠𝑖,𝑡 terms)—e.g. hours worked moving from low-productivity sectors to high-productivity ones (Figure 7).11 We highlight here that the contributions of a sector’s labour productivity is weighted by its hours share (𝑠𝑖,𝑡), i.e. the larger the sector in the economy, the more the changes in its sector productivity will affect aggregate growth. Similarly, reallocation of hours across sectors will have positive effect on productivity growth when hours worked are moving from low-productivity sectors to high-productivity ones, and this effect will be larger when the productivity difference across sectors is larger.12
Figure 7 – Contributions to business sector labour productivity growth

Contributions to productivity growth across sectors have been uneven.
• Aggregate labour productivity growth has been anemic between 2019 and 2025, increasing by about 3.9% (roughly 0.65% annually, Figure 8A, black bar).
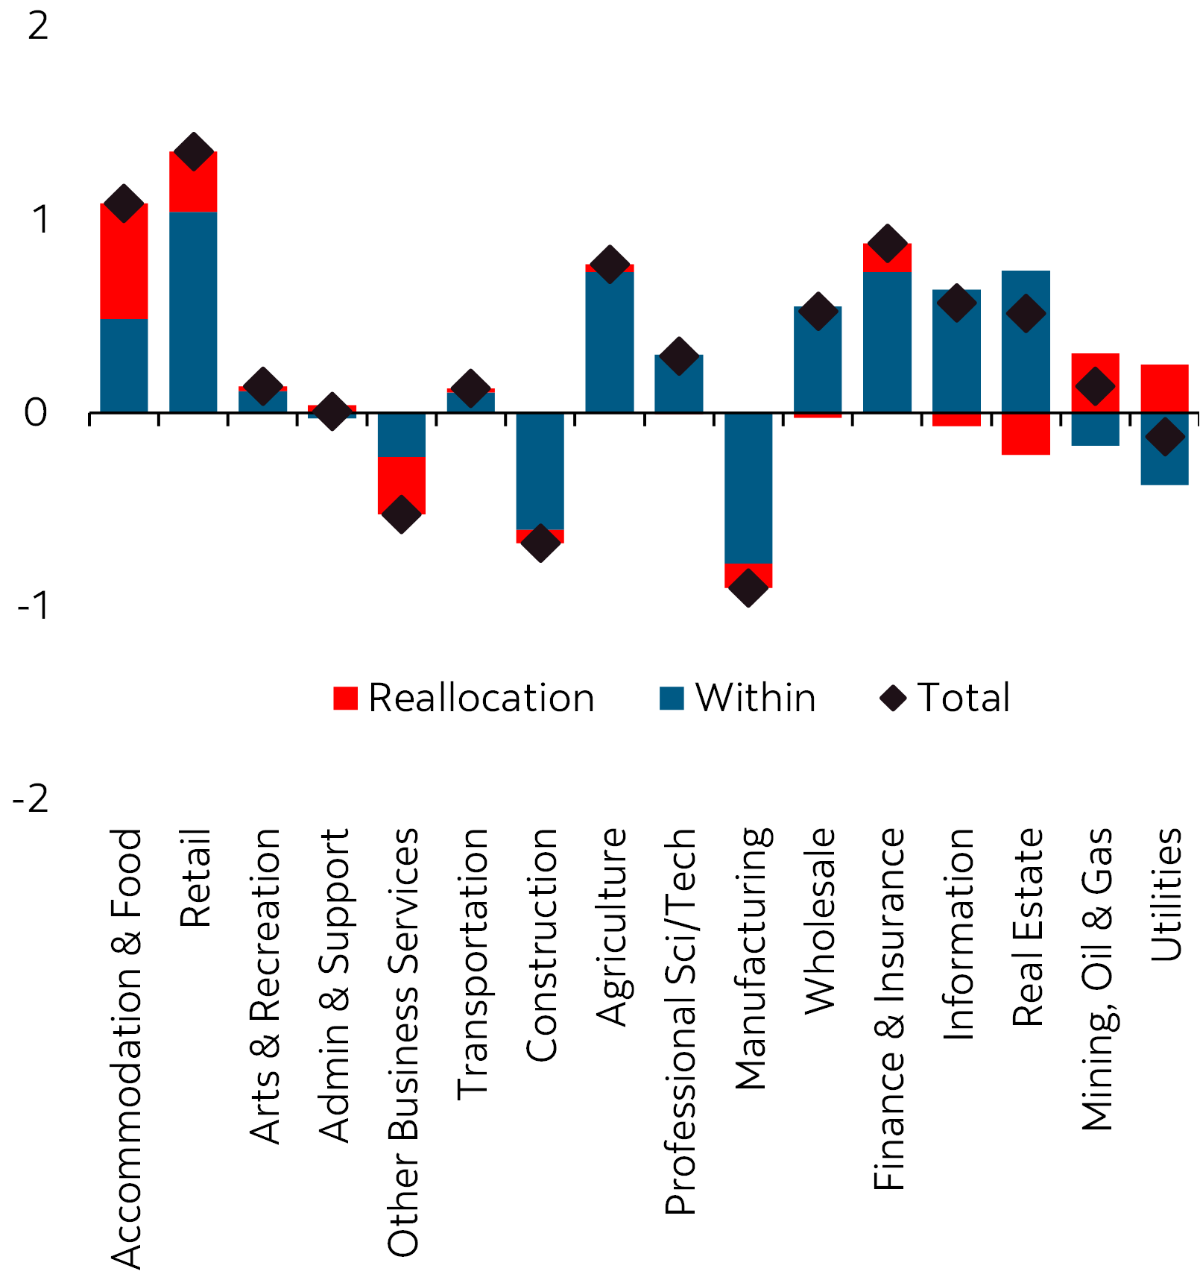
• The contribution of the reallocation effect has been negligible over the 2019-period (Figure 8A, red bar). While some low-productivity sectors like Food and Accommodation shrank, leading to higher aggregate productivity growth, other low-productivity sectors such as Construction and Other business services increased, providing a drag on growth (Figure 8B, red bars).
• Most of the weak productivity growth between 2019–25 has come from higher productivity within sectors. Lots of heterogeneity as sectors such as Retail, Food and Accommodation, Agriculture and Finance, Insurance and Real Estate have experienced increases in productivity within their sector, offset by decreases in productivity from Construction and Manufacturing (Figure 8B, blue bars).
• Overall, aggregate labour productivity growth has been weak, as the most productive sectors of the economy (Mining, oil, and gas and Utilities) have not provided any support to growth, while positive contributions from other sectors have been positive but weak.
Figure 8A – Labour productivity growth has been weak
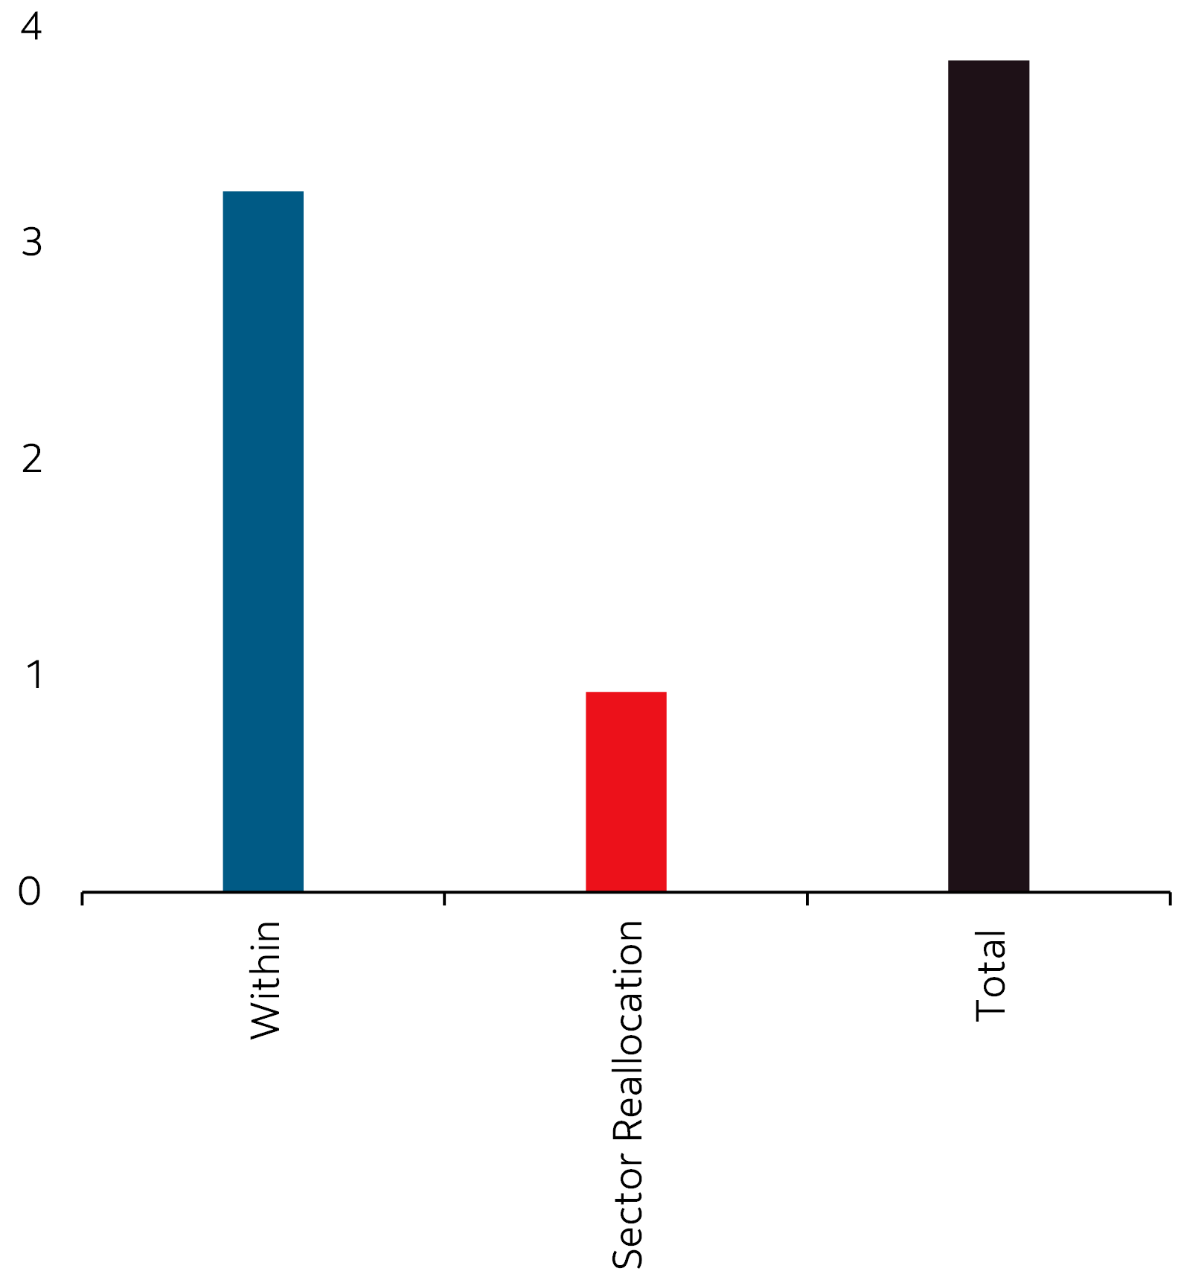
Figure 8B – Contributions across sectors have been uneven
Assessing SMEs’ contributions to labour productivity growth

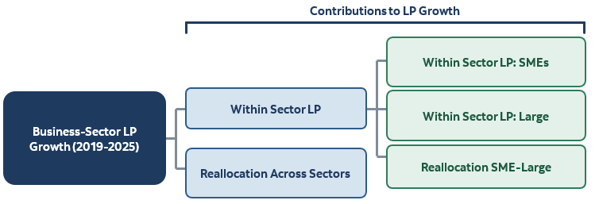
We can then use equations (1)–(2) together to further decompose the within sector contribution into contributions from SMEs, large firms, and reallocation of hours across SMEs and large firms within each sector (Figure 9, green bars). The intuition behind this expanded decomposition is the following: within sector labour productivity can increase because its SMEs have become more productive, because its large firms have become more productive, and because hours reallocate between SMEs and large firms.
Figure 9 – Contributions to business sector labour productivity growth
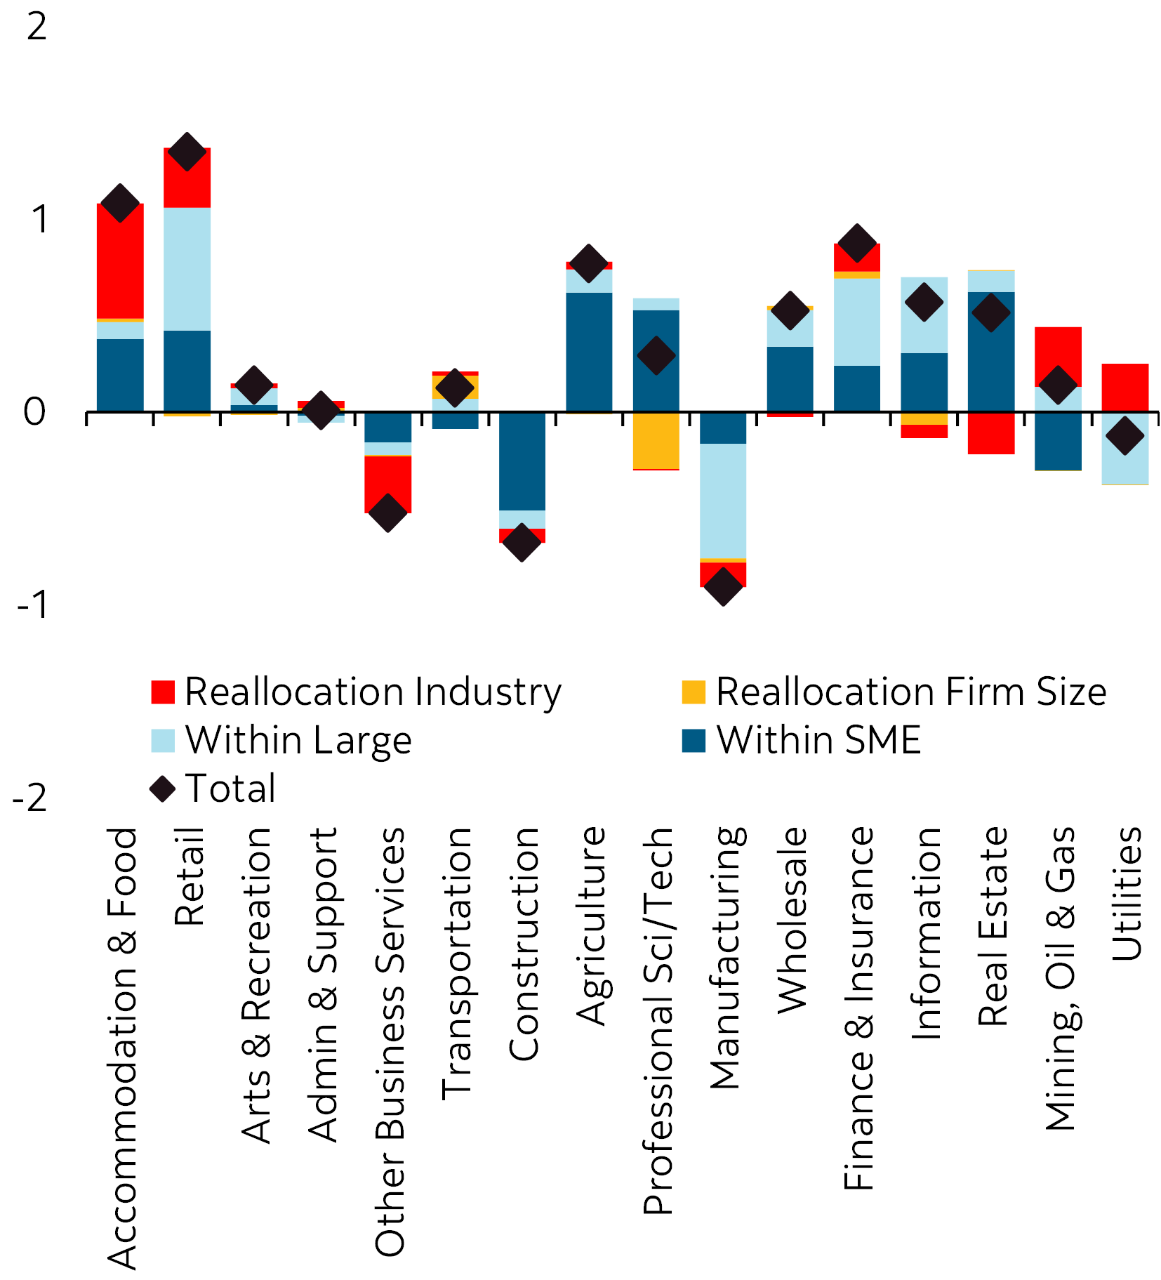
SMEs have likely contributed more to labour productivity growth than large firms over 2019–25.
• SMEs have been the most important driver of productivity growth within sectors, accounting for about 70% percent of the within-sector contributions (Figure 10A, dark blue vs. light blue bars).
• These contributions of SMEs and large firms have been uneven across sectors. SMEs have driven the increase in productivity of low-productivity sectors such as Food and Accommodation, retail trade and Agriculture, and in other sectors such as Professional and technical services and Real estate (Figure 10B, dark blue bars).
• The contribution of large firms has been modest. It mostly came in Retail trade and Finance and Insurance, with a large drag from the Manufacturing sector (Figure 10B, light blue bars).
• Reallocation of hours worked between SMEs and large firms had a negative but negligible contribution on the within effect (Figure 10A, orange bar).
Figure 10A – SME firms account for most of LP growth
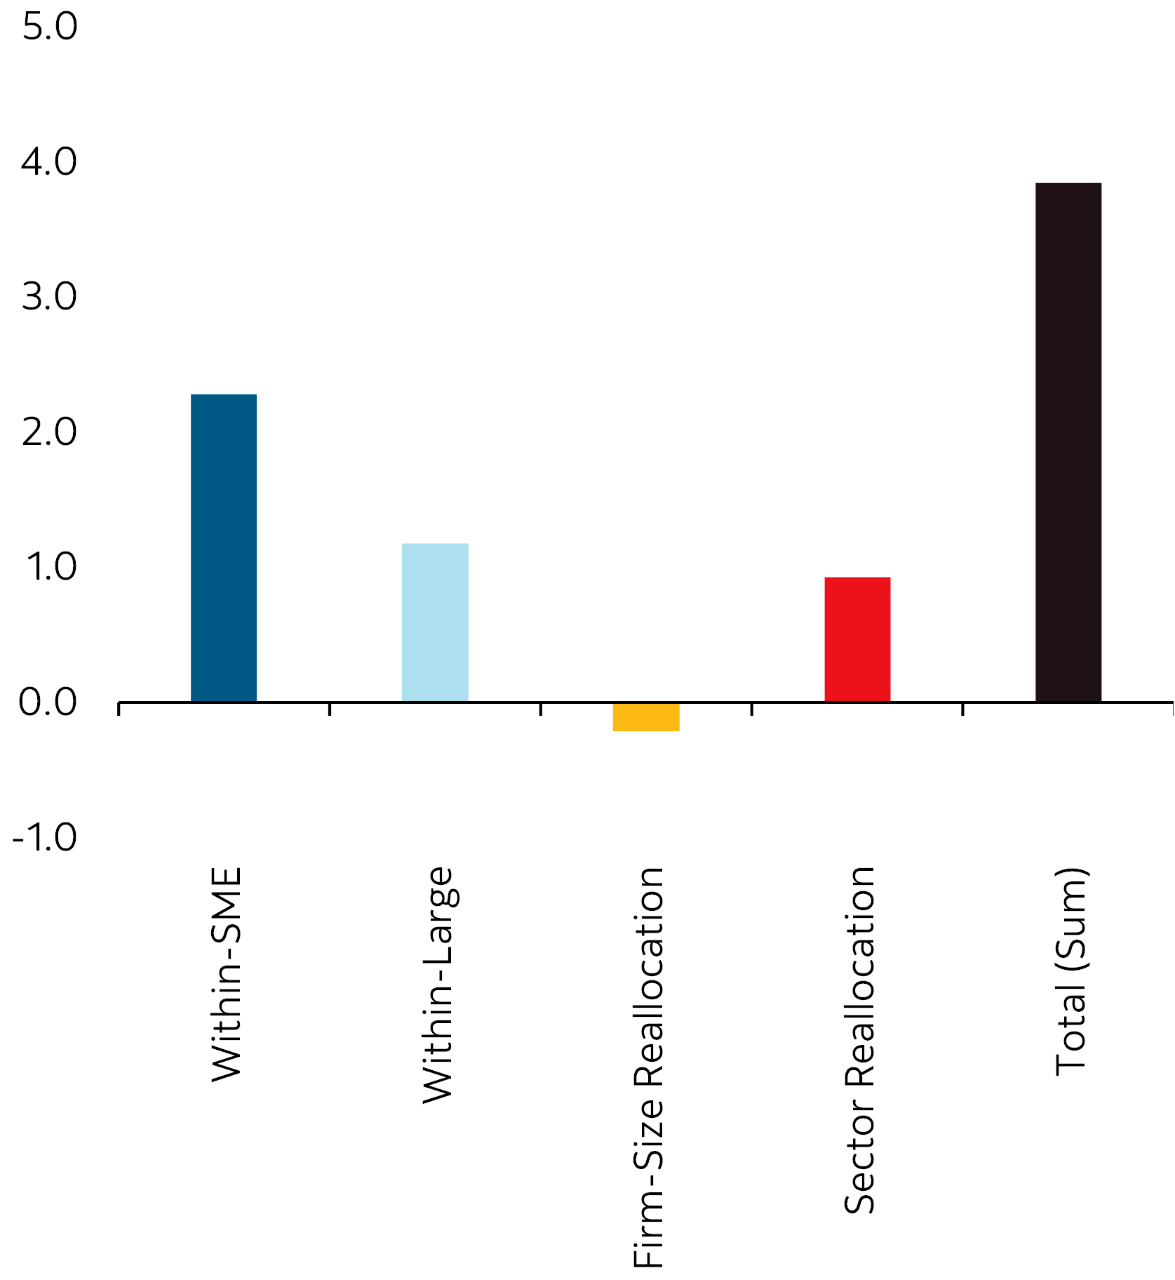
Figure 10B – Uneven contributions across sectors
Assessing SME potential. We can use the above framework to assess how aggregate business sector labour productivity would have evolved under different scenarios where SMEs had been either more productive (e.g. as SMEs in the U.S.) or had different distribution of hours shares across industries. We look at 4 different scenarios (Table 1).
1. Share of SME firms’ hours are similar to those in U.S.
Our first counterfactual scenario asks how aggregate business sector labour productivity would change if the shares of SME hours across sectors would roughly match the U.S. SME shares. We find a positive impact on aggregate business sector labour productivity in 2025 of 3.2%. For most sectors, changing the shares does not matter much because the differences are either small or because some sectors with larger differences in SME shares have a small share of private-sector GDP. Interestingly, the largest impact of this exercise comes from the Manufacturing sector, where the U.S. SME share of hours is about 45% (vs. 61% for Canada). Because larger firms are especially more productive than SMEs in this sector (about twice), changing the share of the Manufacturing sector accounts for half of the 3.2% increase in aggregate labour productivity.
2. The gap between Canadian SME and large firms’ labour productivity is reduced by half.
We perform a second scenario where we assume that the labour productivity gap between SMEs and large firms in each sector of the Canadian economy is reduced by half. This exercise yields an increase to aggregate business sector labour productivity in 2025 of over 7%.14
3. The labour productivity ratio of SME to large firms is similar to the U.S. ratio.
In the third scenario, we take the ratio of SME to large firms’ labour productivity for each sector for Canada and for the U.S., and assume that Canada’s labour productivity ratios are the same as those in the U.S. Because SMEs are relatively more productive (vs. large firms) in the U.S. than in Canada, this yields an increase in aggregate labour productivity of 10.5% in 2025.
4. Canadian SMEs’ labour productivity levels similar to U.S. SMEs.
Finally, we push this exercise a little further where we assume that SMEs in each sector of the Canadian economy are as productive as SMEs in the U.S.15 This exercise yields a much larger impact on aggregate labour productivity, raising its level by more than 32% in 2025.
Table 1. Labour productivity under counterfactual scenarios

Taking stock
Our sectoral labour productivity growth decomposition shows that the weak productivity growth Canada has experienced over 2019–25 has been broad-based across sectors, and that the weakness has been particularly weak for large firms. SMEs have contributed almost twice as much to productivity growth than large firms over the period.
Reallocation of hours towards higher productivity industries has not provided much support for growth; similarly, within sectors, hours moving from SME to large firms (or SMEs scaling up) have not provided support for growth either.
Our counterfactual exercises show how larger and more productive SMEs can potentially support growth. Canada needs more SMEs that scale up to become larger firms. This is where productivity growth generally comes from.
Given the upcoming waves of retirements from SME owners in the next decade, i.e. about 20% plan to retire in the next five years (BDC, 2026), these future business transitions create opportunities for Canadian SMEs to scale up.16 For example, SMEs that acquire other businesses report, after five years, profits that are four times higher relative to SMEs that did not acquire another business (BDC, 2026).
Implications for policy
The objective should be SME growth, not size. Most SMEs never grow: 86.9% of start-ups never change size class (ISED, 2021), and productivity varies far more within size classes than between them (OECD, 2025). This is not a problem per se: most small firms never intend to grow. Health professionals, consultants, skill trades, restaurants, and other types of businesses provide niche local services that are not scalable. The focus should be on those younger SMEs that are productive and have the potential and desire to grow. We identify a few high-level policy recommendations below. We will work to flesh some of these out in future reports, but our point is simple: the policy and financial system must recognize how vital SMEs are to a productivity revival. A determined effort is required at various levels of government to smooth the path for SMEs so then can fully play their critical role in fostering economic dynamism and competitiveness.
Increase market size
• Removing trade barriers. Canada’s market is one-tenth the size of the U.S. market with provincial barriers that fragments it further. In Europe, fragmented home markets keep firms small, most so in high-returns-to-scale industries (Becker et al, 2026). Implementing the One Canadian Economy Act at the federal level will help firms scale nationally, but much more work is required at the provincial level to remove trade barriers. For example, licensing covers about 20% of Canadian workers and differs widely across provinces (OECD, 2026). Broader mutual recognition of licenses and limits on non-compete agreements would let growing firms hire faster. Moreover, many forms of interprovincial trade barriers are regulations. The CFIB estimates that the number of provincial regulations dwarfs the number of federal regulations.
• Export support. SMEs are 73.3% of goods exporters but 37.9% of export value, and small firms send 79.4% of their exports to the U.S. (ISED, 2025). Temporary support could target firms that are near the export threshold.
Remove growth penalties
• Tax thresholds. The small business deduction applies to the first $500,000 of income and phases out between $10 and $50 million of taxable capital. Firms bunch below the limit, mostly through tax planning (Lesica, 2025). Such thresholds are generally seen as distortionary, i.e. they act an implicit tax on growth (see Guner et al., 2008). Our recommendation is that these thresholds should either be smoothed to reduce distortions, or to raise the threshold enough that it no longer distorts incentives to grow.
• SR&ED cliffs. Canadian-controlled private corporations (CCPC) get a 35% refundable credit on their first $3 million of R&D spending. A firm can therefore lose most of its R&D support by growing, since the $3 million limit is phased out as taxable capital rises from $10 to $50 million, or by bringing in foreign investors that take control, which ends its CCPC status (ISED, 2018). The 2025 Budget raised the limit to $6 million of R&D spending, moved the phase-out to $15–75 millions and opened the enhanced credit to Canadian public corporations.
• Regulation. Compliance is a fixed cost for businesses. Firms with under five employees report that they pay $10,208 per employee in regulatory costs, about seven times the $1,374 paid by firms with 100 employees or more (CFIB, 2025). 87% of owners say excessive regulation reduces their productivity and ability to grow (CFIB, 2025). This is another direct way in which interprovincial trade barriers penalize SMEs.
Support growth capital.
• Acquisition, M&A and buyout financing. As noted above, the upcoming retirements of about 20% of SME owners represents a massive opportunity to raise productivity in these firms. It will also be a huge opportunity for financiers as they help finance these transactions. To ensure that SME owners, and the broader economy, maximize the benefits from this ownership transition it will be essential to ensure that the financing ecosystem recognizes these opportunities and steps up to the plate. There may also be a need to reconsider tax laws to facilitate and/or encourage these transactions.
• Scaling-up growth financing. SMEs firms scaling up to become large firms need equity financing rather than debt. The Economic Strategic Tables report suggests that 71% of high-growth SMEs report difficulty raising capital to expand (ISED, 2018). The Canadian Venture Capital and Private Equity Association reports that U.S. investors joined two-thirds of Canadian venture rounds above 50M$ in 2025. These difficulties in raising capital are somewhat surprising, as private-equity backed SMEs grew employment by 7.3% per year, with twice the productivity growth of comparable public firms (study from 2020 PwC cited in Senate BANC, 2026).
• Bank credit is not a binding constraint for SMEs. 97% of SME debt applications were approved in 2025 (ISED, 2026), and (Champagne and Gouin-Bonenfant, 2026) estimate that only about 4% of SMEs are likely credit-constrained. Bank credit has expanded significantly since the past 15 years, and as of 2025, over 111B$ of debt that is available to but unused by SMEs.
Appendix
Industry-level decomposition
Adding the firm-size dimension (SME vs. large firms)

The terms 1–3 sum exactly to the original within-industry effect, while terms 4–5 are the same as in Equation (A1).
Interpretation
Within-SME / within-large: productivity growth of small and large firms within sectors, weighted by their respective hour shares.
Firm-size reallocation: hours moving between small and large firms within a sector, weighted at the SME−large productivity gap. It is negative when hours shift toward SMEs (𝛥𝛼>0) in industries where SMEs are less productive (𝑦𝑆<𝑦𝐿) — i.e. reallocation toward small, lower-productivity firms creates a drag on aggregate labour productivity.
Industry reallocation: unchanged from above. Sector reallocation is the effect of hours shifting toward industries that have higher labour productivity than the average.
Constructing firm-size value added and hours worked
The decomposition needs value added (VA) and hours worked for SMEs and large firms in each of the 16 business-sector industries, for both years 2019 and 2025. Statistics Canada does not publish these splits, so they are built in four steps. Each step is tied to published industry totals, so the firm-size split only divides an industry's VA and hours between the two groups (SMEs and large firms) and never changes the published industry totals.
Industry totals. Industry real VA (chained 2017 dollars) and hours come from the Canadian Productivity Accounts (Table 36-10-0207, anchored to the annual levels using 36-10-0480). As explained in the main report, VA levels are kept through 2019; for 2020–2025 they are extended with the annual growth of monthly real GDP by industry (36-10-0434), mapped to the Productivity Accounts industry definitions. Hours are taken from 36-10-0207 for all years.
Hours by firm size. Following Gu and Lesica (2025), average hours per worker are assumed to be the same in small and large firms within sectors. Under this assumption, the SME share of hours then equals the SME share of employment from SEPH (Table 14-10-0215: employment by firm size). SME hours are thus computed as the product of SME shares and industry hours, and large-firm hours are the difference between industry totals minus SME hours. Shares are available every year from 2001 to 2025.
Value added by firm size, 2019. We start with the firm-size LP levels published by Gu and Lesica (2025) for 2019. Because these estimates come from a different source the Productivity Accounts, their hours-weighted average does not exactly match industry labour productivity. Both firm-size levels are therefore scaled by a common industry factor, so that the SME-to-large productivity ratio from Gu and Lesica (2025) is preserved while the level matches sector labour productivities. Firm-size VA is then LP times the corresponding hours, and SME and large-firm VA add up to industry-level VA.
Value added by firm size, 2025. There is no firm-size labour productivity estimate published after 2019, so 2019 levels are projected to 2025 using income-side proxies.
SMEs: Labour productivity grows with real hourly labour compensation of SME employees. SME weekly earnings are backed out of the SEPH average weekly earnings by firm size (Table 14-10-0217), converted to hourly wages using industry average hours (as detailed above), and deflated by the Consumer Price Index (Table 18-10-0004).
Large firms: The growth of VA per hour combines real labour compensation growth of large-firm employees (Table 14-10-0217) with real growth of gross operating surplus (GOS) in each industry. The two are weighted by the 2019 split of industry income between labour compensation and GOS (from the supply–use tables, 36-10-0084). Note that the latest available GOS by industry covers until 2024, so GOS growth is for 2019–2024, and is deflated by the same CPI.
The projected 2025 levels are then rescaled to the actual 2025 industry LP in the same way as for 2019. The proxies therefore only determine the relative SME and large-firm growth within each industry; the level is always set by the published industry data.
