Authors
Julien Champagne
Senior Econometrician, Economic Policy
Émilien Gouin-Bonenfant
Associate Professor, HEC Montréal
Key Highlights
· Canada’s nation-building agenda represents an investment push of extraordinary scale. Nearly $1 trillion in major-project spending is planned from 2025 onward, with activity rising sharply between 2027 and 2031. We use a dynamic input-output model of the Canadian economy to assess how this investment agenda could reshape demand for workers across industries and occupations.
· Skilled Trades are likely to be the first and most important labour bottleneck. Construction supplies about half of Canada’s investment goods, and occupations in Trades, Transport and Equipment Operators account for roughly half of construction employment.1 The investment surge will therefore place particularly intense pressure on these occupations.
· The pressure initially appears in wages and then draws more workers into the Trades. By 2030, wages in Trades, Transport and Equipment occupations are projected to rise about 2.5% more than wages economy-wide, with premiums exceeding 3% in some highly sought-after occupations. As workers retrain and change careers, the average wage premium falls to about 1% by 2035 and largely disappears by 2040.
· Meeting the investment agenda will require a substantial expansion of the Trades workforce. Employment in Trades, Transport and Equipment occupations is projected to increase by at least 14% by 2035, slightly more than the roughly 12% increase in expansion-related job openings projected by Employment and Social Development Canada (ESDC). Relative to the rest of the economy, employment in these occupations rises by 3%, and by about 4% in the most heavily affected detailed occupations. This is a significant increase since it adds to the already high number of Trades workers that will be needed simply to replace those retiring over the next decade. ESDC estimates that 22% of Trades workers will retire over this period, the equivalent of about 772K workers.
· Labour constraints will determine how much of the agenda becomes real investment rather than higher costs. If the supply of Trades workers does not adjust quickly enough, stronger wage pressures and rising project costs will slow activity. Training and apprenticeship capacity, recruitment and interprovincial mobility will help determine whether the investment surge translates primarily into more productive capacity or instead into higher wages, higher project costs and delayed investment.
· Demand will eventually shift from building projects to operating them. As construction activity subsides, the strongest employment gains move toward Natural-resources, Manufacturing and Utilities occupations, creating a longer-lasting need for operators, engineers and technicians into the 2040s.
1. Meeting the Moment: Canada’s Nation-Building Agenda
Canada has spent over a decade under-investing. The real non-residential capital stock per worker has been falling since 2015, and as a result, GDP growth per capita has been abysmal, ranking 37th of 38 OECD countries over the period (OECD, 2025). A number of geopolitical events, such as the Ukraine and Iran wars, less predictable trading relationships, and sovereignty threats, have led to global fragmentation, and generally to more economic uncertainty. These events have turned a slow-burning productivity problem into a pressing one. The Federal government’s policy response has been an explicit nation-building agenda to raise investment across various areas to increase economic security and prosperity. The Building Canada Act (June 2025) and the Major Projects Office (MPO, August 2025) aim to move projects of national interest (e.g., oil, gas and LNG, critical minerals, power generation and transmission, ports, and rail) from approval to construction faster. The list of major projects includes Natural Resources Canada (NRCan) Major Energy and Natural Resources Projects, ReNew Canada Top100 Infrastructure Projects 2026 (ReNew), and the MPO’s Major Projects and Transformative Strategies. The Scotia Growth Institute’s Building Canada Tracker now puts the major project inventory at more than $1 trillion for an economy of roughly $3.3 trillion.2 Moreover, the commitment to raise defence spending toward NATO targets and NORAD modernization adds another layer of spending to the nation-building agenda.
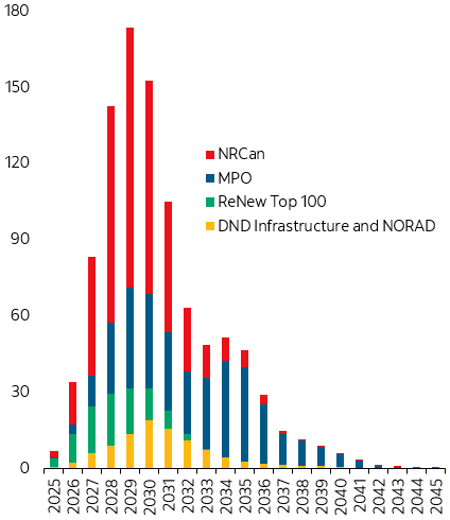
These numbers are large, and highly concentrated over time. There will be a steep “expenditure wall” which should be concentrated between 2027 and 2031 if projects move as planned. This synchronized peak of major projects will create important challenges for the Canadian economy in terms of bottlenecks in skilled labour and supply chains, leading to cost inflation. Two important questions follow. First, how much real growth will the nation-building agenda deliver once bottlenecks in labour, materials and construction capacity are taken into account? Second, who will benefit the most, given that the projects are concentrated in a handful of industries and regions? To answer these questions, we use a dynamic input-output, general-equilibrium model of the Canadian economy developed by Champagne and Gouin-Bonenfant (2026).3 This first note focuses on the labour market, specifically on the occupations the agenda will call on. Follow-up reports will focus on other aspects of how the agenda will affect the economy.
2. Under the Hood: A Dynamic Input–Output Model of the Canadian Economy
Basic macroeconomic theory states that in a frictionless, competitive economy, the elasticity of real GDP to an increase in the capital stock should be equal to the capital share of income. For example, a 1 trillion investment agenda as mentioned above would raise the capital stock of the Canadian economy by close to 13%; with a capital share of income of 35%, one can expect from basic macro theory that Canadian real GDP should grow by about 4.7%. But in practice, the economy is comprised of multiple sectors that operate using different types of capital that have different returns, and occupations requiring different skills. It is easy to picture that such a massive investment agenda will draw a lot more on certain sectors and occupations than others. Consequently, bottlenecks are expected to occur as capital and labour adjust slowly over time, raising prices and reducing demand, and thus lowering the overall impact on real GDP.
To study the impact of the potential transformative agenda on the Canadian economy and account for potential bottlenecks in production, we use a dynamic general-equilibrium input–output model of the Canadian economy (Champagne and Gouin-Bonenfant, 2026). In short, it is a quantitative laboratory that combines the industry detail of Statistics Canada’s Supply and Use tables with the forward-looking behaviour of a modern macroeconomic model. It follows a dollar of spending through supply chains, identifies which workers and which types of capital that dollar calls on, and traces how prices, wages, investment and financing respond over time. Four groups of agents interact in the model (Figure 1):
Figure 1. Overview of the model
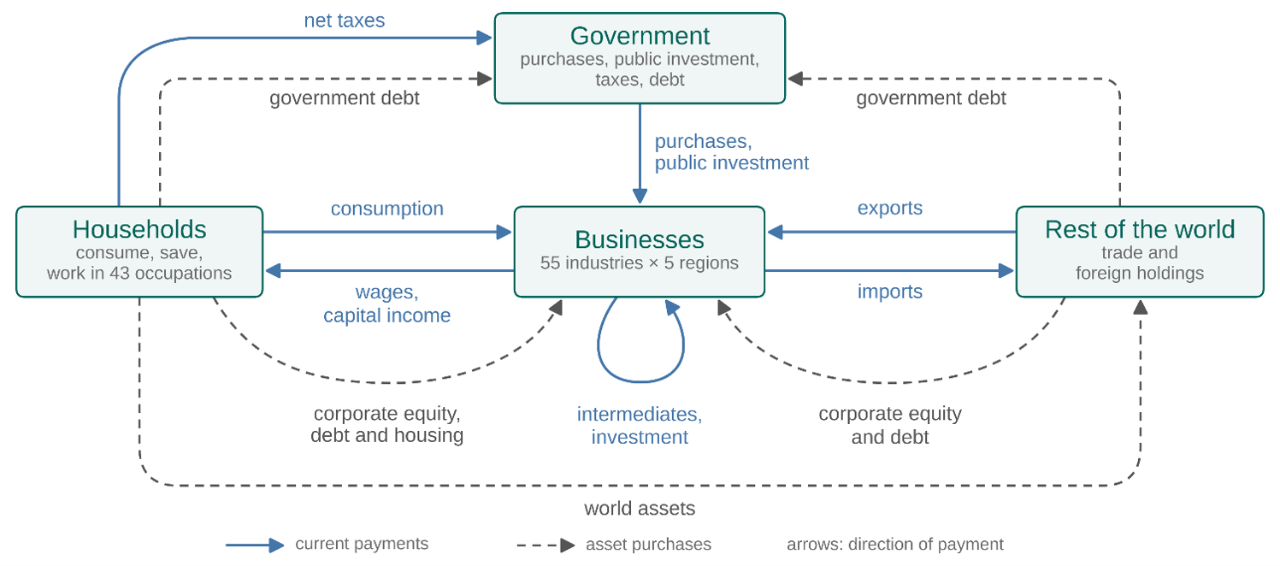
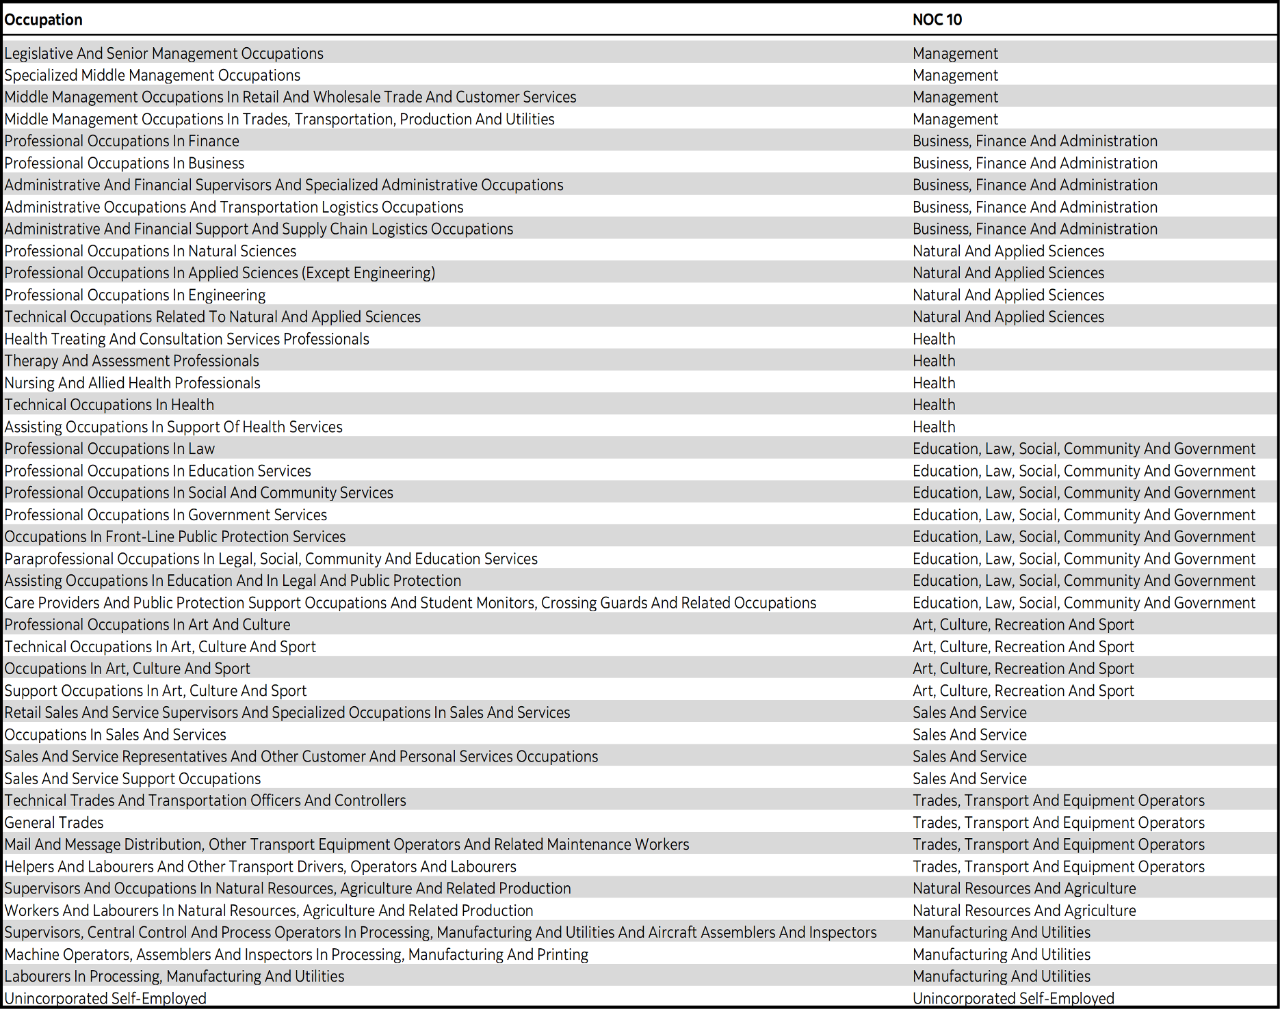
· Businesses. The model has 55 industries in each of five regions: the Atlantic provinces, Quebec, Ontario, the Prairies, and British Columbia and the territories. Each industry combines inputs bought from other industries (at home, in other regions or abroad) using labour from 43 occupations,4 five types of capital (non-residential structures, engineering, machinery and equipment, intellectual property products (IPP), and dwellings) and fixed resources such as land and natural resources. Firms invest when capital is worth more than it costs to build, but installation takes time, so capital stocks build up gradually across the economy.
· Households. Households consume, save, supply hours according to wages and hold various assets (e.g., debt [government and corporate]), equities, housing and foreign assets. As workers, they choose an occupation and a region based on expected earnings. Workers can change occupations to get to a better career, but these transitions take time.
· Government. Makes purchases and invests (public investment), and finances itself through taxes and debt. We assume public infrastructure modestly raises private-sector productivity.
· Rest of the world. Canada trades with the rest of the world, and foreign investors hold about one-fifth of Canadian corporate equity and debt and at least one-quarter of government debt.
Three features of the model matter most for what follows:
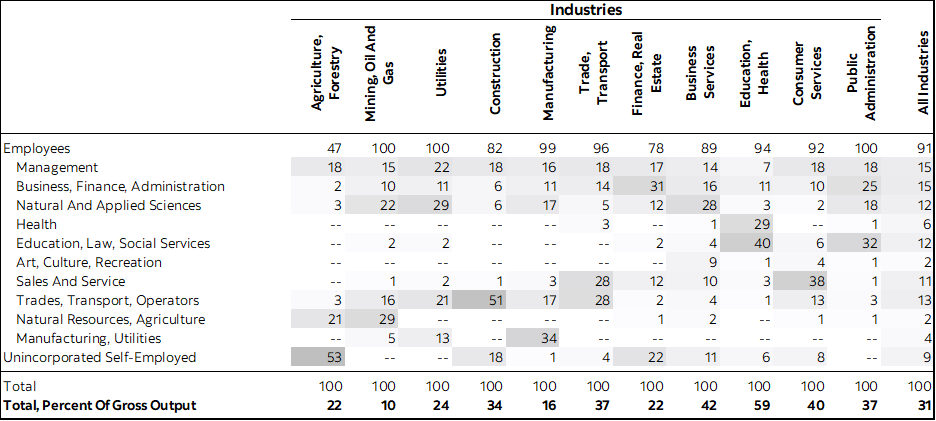
· Supply chains determine where demand lands. A dollar of new investment lands first on the industries that produce investment goods. Construction alone supplies about half of all investment spending in Canada, and Manufacturing (machinery and equipment) slightly over one-fifth (Figure 2). Demand then ripples out to their suppliers: e.g., steel, cement, engineering services and transportation. At each step, an industry hires workers according to its occupational mix in the data. For example, while Trades, Transport and Equipment Operators account for about half of Construction’s payroll, they account for much less in other sectors, for about 13% economy-wide (Figure 3).
· People and capital move slowly. In the data, only about 6% to 7% of workers leave their broad occupation group each year; transitions between provinces are rarer still. Occupations are distributed evenly across sectors. A sudden surge in demand therefore shows up first in the wages of scarce occupations and only later in employment as workers retrain, switch careers and new cohorts enter. This is why the model can deliver less growth per dollar than simple multipliers would suggest.
· Results are measured against a no-agenda path. The model is calibrated to Statistics Canada’s 2022 provincial supply-use tables, to Labour Force Survey (LFS) microdata for occupations and national balance sheets, with elasticities taken from the literature. All results measure, in isolation, the response of the model to the nation-building investment agenda relative to a scenario where the Canadian economy did not have such an investment agenda and remained on its 2015-24 trend.5
Figure 2. Construction and Manufacturing supply close to 75% of investment goods
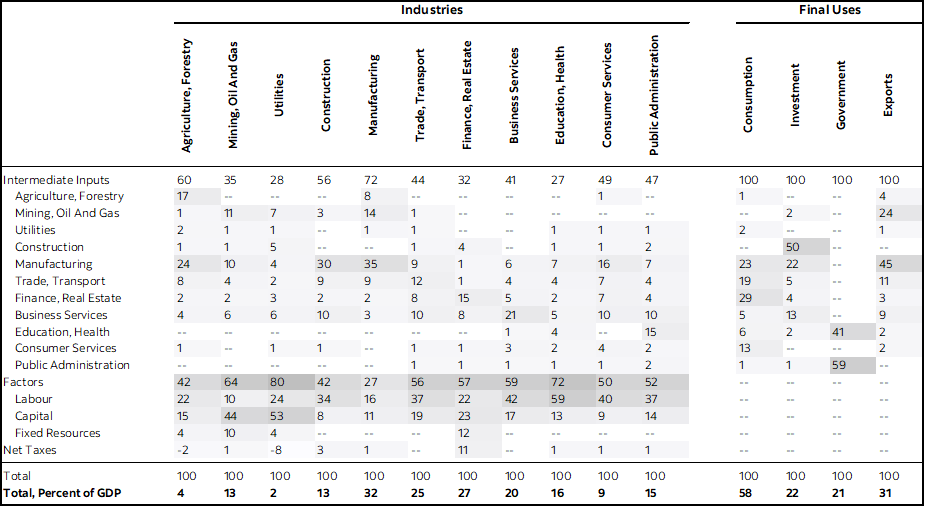
Figure 3. Trades, transport and equipment operators comprise half of Construction’s jobs
3. The investment scenario
The investment shock we model is constructed using projects mostly from Scotia Growth Institute’s Building Canada Tracker. The projects come from five principal sources: NRCan Major Energy and Natural Resources Projects, MPO, selected projects from ReNew Canada’s Top 100, the Defence infrastructure and NORAD modernization, with $982 billion of cost remaining from 2025 (Table 1).6 About 54% is assumed to be privately financed against 46% financed by the various levels of government. The simulation assumes the program is announced at the beginning of 2025 and proceeds on its listed schedule, with total investment increasing fast over 2027–2031, peaking in 2029 at close to $175B (Figure 4). In this scenario, total investment lies 17% above its trend in 2035.7
An investment shock of that size implies an increase in the level of real GDP (on top of the trend estimated over 2015–24 without the investment agenda) between 3% and 4% by 2040, most of it coming through higher labour productivity.
Table 1 – The Nation-Building Scenario
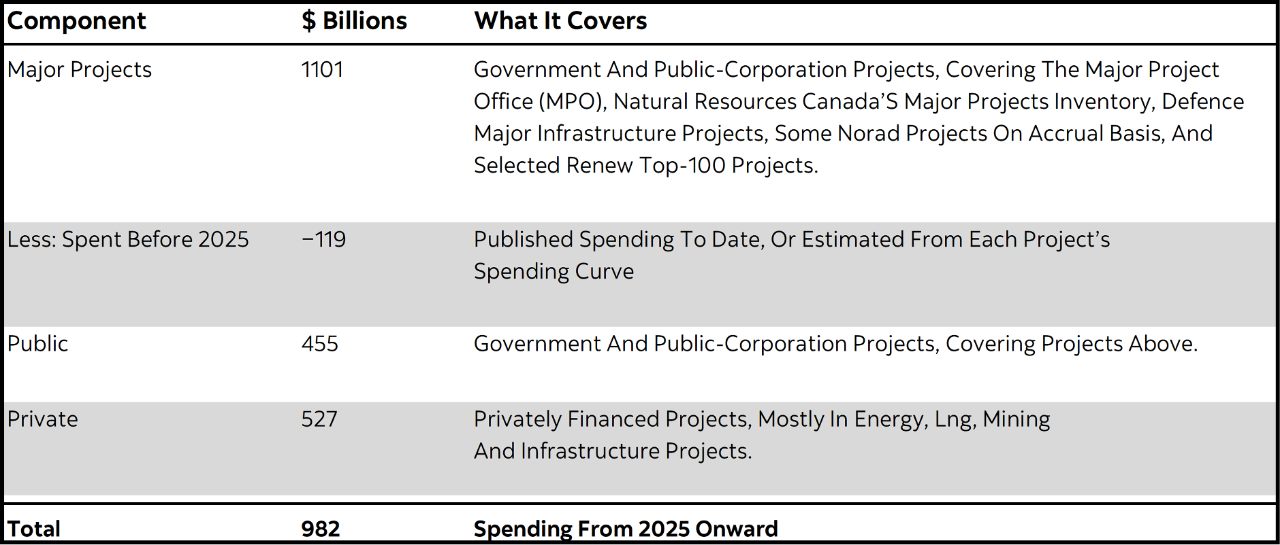
Figure 4. The investment profile is steep and concentrated between 2027–2031
4. Which Occupations Will the Nation-building Agenda Call On?
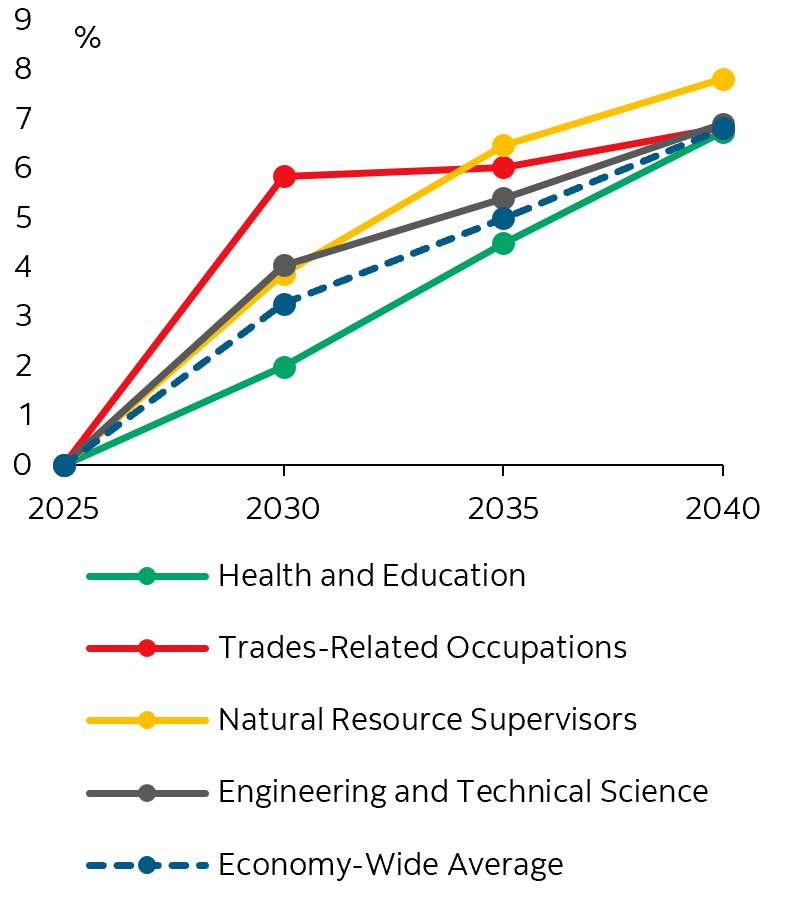
Trades are the first bottleneck. The Construction sector is drawn on from the investment agenda as it supplies half of investment goods. Occupations within its industry such as General Trades; Workers and Labourers in Natural Resources; and Technical Trades and Transportation Officers and Controllers become highly demanded and average wages per worker increase by 1.8%, 1.7% and 3.3% above the average economy-wide wage by 2030. Figure 5 plots the real wage growth (vertical axis) and employment growth (horizontal axis) relative to the economy-wide averages, for the 43 occupations groups in the years 2030, 2035, and 2040. Figure 6 shows that when including trend growth, these relative growth rates imply cumulative real wage gain of 5.1%, 5.0% and 6.6% by 2030, respectively, against 3.3% for the economy-wide average (dashed blue line).
Workers eventually follow the wages. These occupations in Trades, Transport and Equipment Operators experienced employment of 2.2% above the economy-wide average in 2030 and 2.9% in 2035 and 2040. As workers enter, the Trades wage premium falls from an average of 2.5% in 2030 to 1.0% in 2035 and almost disappears by 2040 (Figure 5, red dots). The highest-demanded occupations within Trades experienced important increases in employment. For example, employment in Technical Trades and Transportation Officers and Controllers is 4% above the economy’s average by 2035 (Figure 5).
Demand then shifts to operating occupations. Natural resources and Manufacturing and Utilities occupations employ 1.9% and 1.6% more workers than the average in 2035, rising to 2.4% and 1.8% in 2040. Natural resources occupations post the largest relative real wage gain of any group by 2040 (1.0%) and the second largest in employment (3.9%). But overall, over time factors of production are more elastic and thus wage growth is less heterogenous across occupations despite still large shifts in employment growth.
Engineering and science gain modestly. Engineers and science technicians employ 1.2% to 1.4% more workers than average by 2035, respectively, with wages slightly above average (Figure 5, grey dots).
Health, Education and Services occupations lose ground in relative terms. In 2035, employment relative to the economy-wide average is 2.2% lower in Health, 1.7% lower in Education, Law and Social Services, and 1.7% lower in Sales and Service (Figure 5, green dots). Healthcare real wages trail behind economy-wide wages in 2030 and catch up only by 2040. Care providers and public protection support, nursing and health support workers are among the most affected occupations.
Even as they lose workers, Health and Education occupations see real wages rise, because they must compete for workers. With limited productivity gains, the relative cost of these services rises, creating a type of Baumol’s cost disease.
Figure 5. Economy hits bottlenecks early on… but should adjust in the long-run
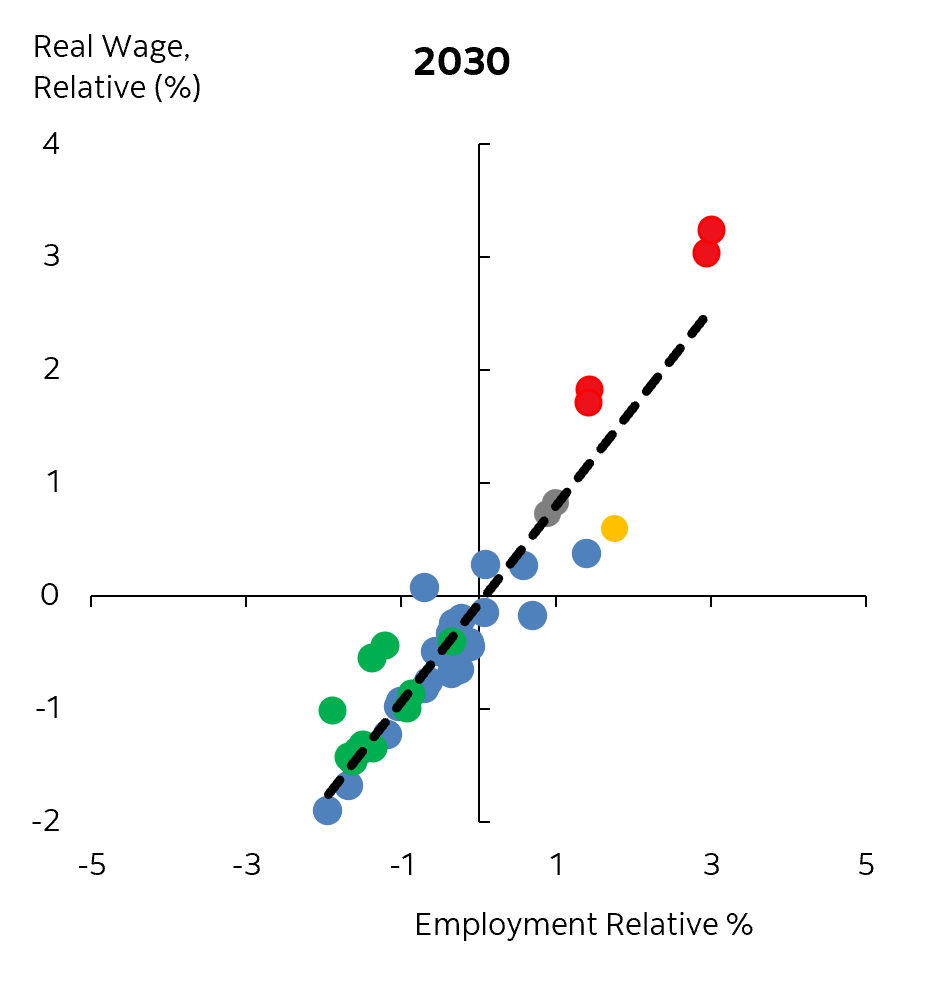
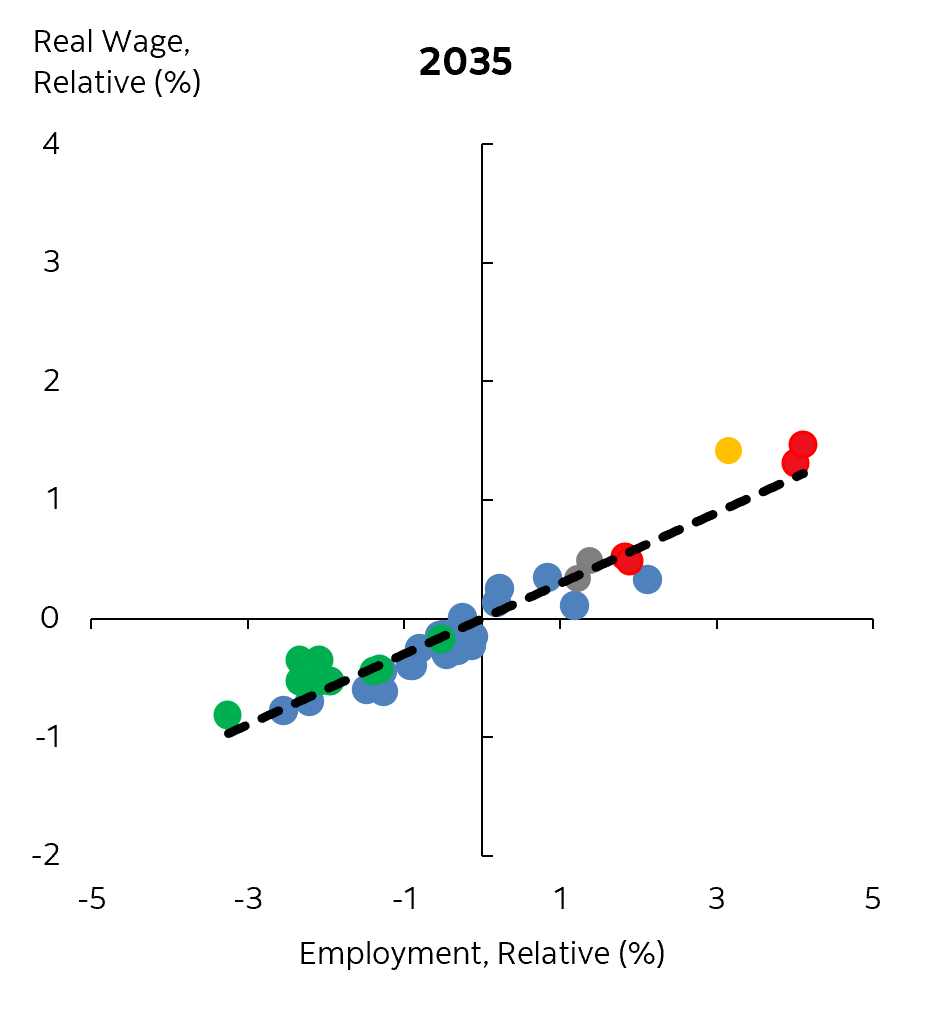
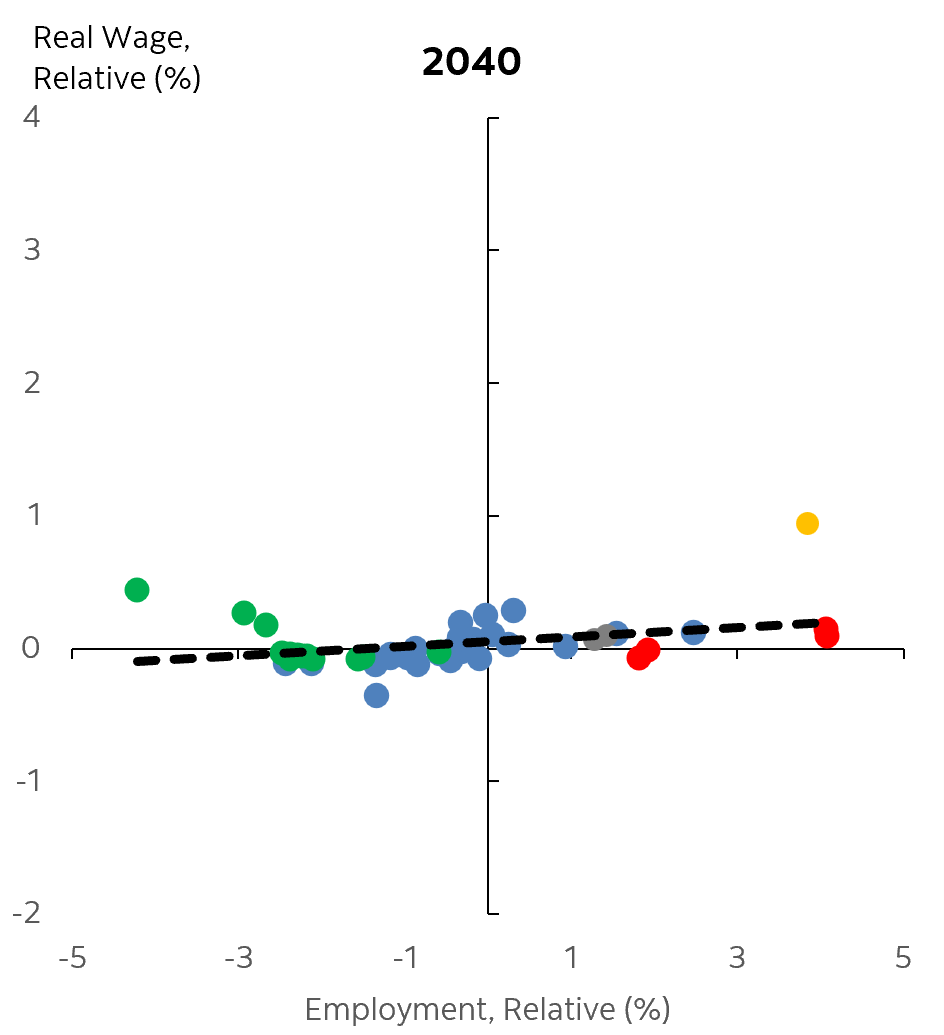

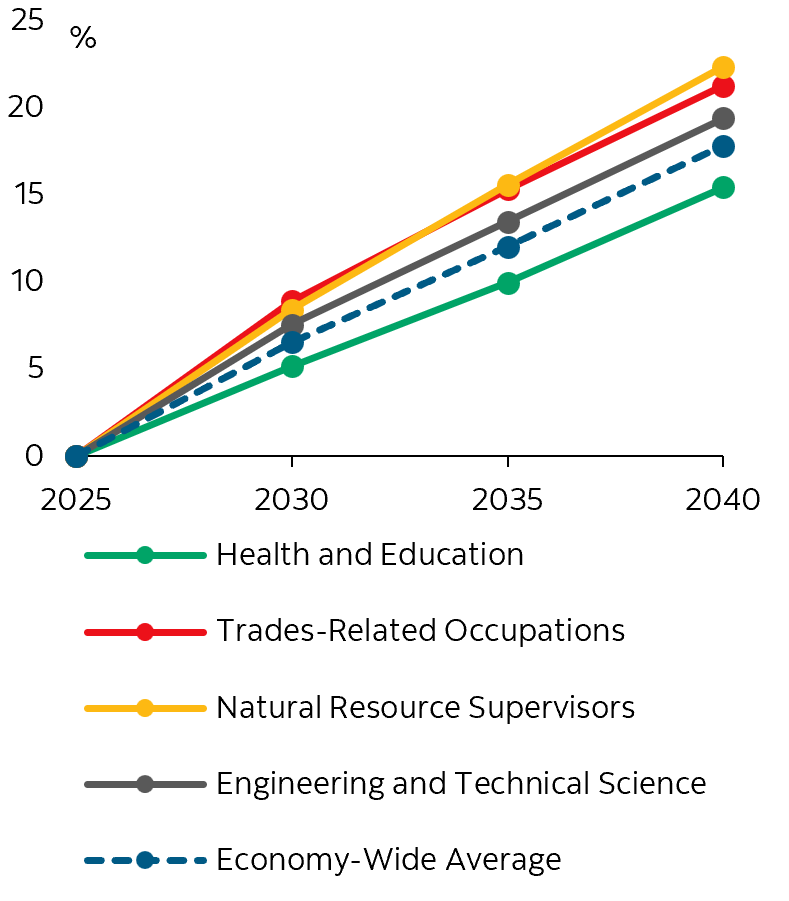
Figure 6. Cumulative growth for selected occupations, real wage and employment, 2025-2040
Discussion, Caveats and Implications
Our work illustrates the important reallocation of labour that needs to take place in order to achieve Canada’s investment agenda. Canada has a poor history of delivery, delays, cost overruns and cancellations, and our work provides a mechanism by which this occurs if labour does not reallocate appropriately.
There is considerable uncertainty around our estimates. Our simulation is a projection conditional on a specific investment agenda. Taking into account other known announced measures, such as hopes for a doubling of home construction, and pressures from rising health care needs, suggests bottlenecks could be substantially stronger than our simulations suggest. We will be assessing such scenarios in future reports.
We relate our estimates for the increase in the demand for trades, transport and equipment operators and related occupations to ESDC’s latest projections for 2026-2035. While we find that Trades occupations employment will increase by at least 14% between 2026 and 2035, ESDC’s forecast for job openings that are projected from expanding economic activity is slightly lower, at close to 12%. This increase is significant given it adds to the already high number of Trades workers that will be needed to replace those retiring over the next decade. ESDC estimates that 22% of Trades workers will retire over this period, an equivalent of about 775K workers.
Trades capacity matters most before 2030, when spending peaks at about 5% of GDP. Policies toward training and apprenticeship, interprovincial mobility, and recruitment decisions taken now determine whether the investment peak is met with additional workers or with higher costs which slow demand.
Trades occupations’ wages might remain relatively high past 2035. Our simulation implies that wage growth will eventually normalize towards the economy average. However, some wages in Trades are often bargained collectively at the provincial level, and adjustments are made infrequently and rarely downward. This could slow down the adjustment process and leave relative costs higher for longer.
The operating workforce is a lasting need. Resource, utilities and plant operators, engineers and technicians will be in demand into the 2040s, after construction winds down.
The Federal government’s plan to double housing construction would exacerbate dramatically the need for skilled trades. For example, in September 2025, the government launched Build Canada Homes, a new federal housing agency to supercharge non-market housing construction across the country. While it is unlikely that this objective of doubling housing starts will be reached, any push in that direction will substantially increase the pressure on the supply of skilled trades and raise costs across both the residential and non-residential sectors. Since our work in this report focuses only on non-residential investment projects, combining these two sources of labour demand would dramatically increase the need for workers and consequent concern about bottlenecks to the agenda. We will examine the potential impact of doubling housing construction in a future report.
Public services face relative recruitment pressure. In our simulation, while Health and Education occupations grow, they do much less relative to other occupation groups of the economy. By 2040, wages in these sectors must increase relative to the rest of the economy so they can retain and hire workers. Several issues suggest that this could be unrealistic. First, public-sector wages are not fully determined by market forces, implying very slow adjustments. Second, as population ages, demand for healthcare will keep increasing. ESDC estimates that job openings in healthcare will increase by a stunning 23% by 2035. Given our model does not capture these demographic factors, we could be overestimating the adjustments in the economy and bottlenecks could be substantially larger.
Conclusion
Canada’s nation-building agenda has the potential to deliver a meaningful upgrade to the economy’s productive capacity. But announcing and approving projects is only the first step. Delivering them will require Canada to build the workforce alongside the infrastructure. With investment heavily concentrated between 2027 and 2031, skilled trades are likely to become a binding constraint well before the new capital is fully in place.
That makes labour supply part of the nation-building agenda itself. Given the expected relative wage gains and career opportunities, the prospects of long, stable and rewarding careers in various trades are as bright as they have been in generations. For example, Technical Trades and Transportation Officers and Controllers occupations had average annual earnings of $81,700 in 2025 according to LFS data. Assuming inflation rates of 2% per year, our simulations imply annual earnings close to $96,000 by 2030 for these occupations.
While we hope this will be apparent to potential workers in these fields, governments will need to dramatically increase the infrastructure needed to develop (and encourage) this workforce. Training and apprenticeship capacity, recruitment and interprovincial mobility will help determine whether the investment surge translates primarily into more productive capacity or instead into higher wages, higher project costs and delayed investment. The need also does not disappear once the construction wave passes: demand shifts toward the operators, engineers and technicians required to run the new productive assets.
The central lesson is simple: Canada cannot build at nation-building scale without building its skills chain at nation-building scale as well.