The U.S. dollar has come under increasing pressure in recent months, reflecting shifting global dynamics and deteriorating investor sentiment. A confluence of factors, including aggressive and unpredictable disruptions to free trade frameworks, concerns about the stability and openness of U.S. financial markets, threats to central bank independence, and unease over widening deficits and mounting public debt, has challenged the long-standing notion of U.S. exceptionalism that has traditionally underpinned the U.S. dollar’s safe-haven status.
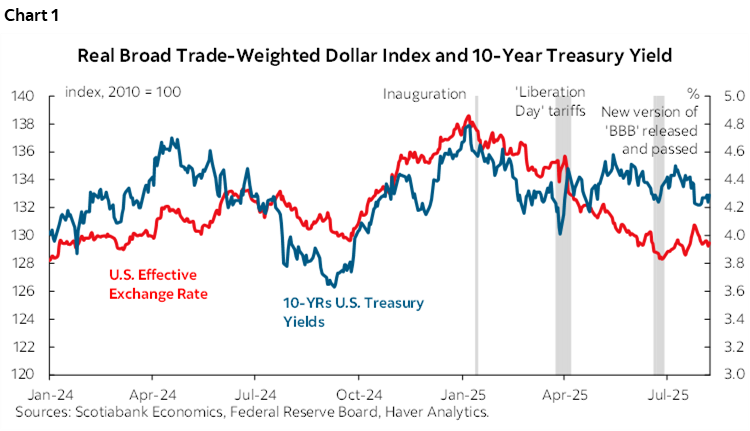
The U.S. dollar has posted one of its weakest first-half performances on record. While it has recently found some support from tariff reprieves amid newly signed trade deals and signs that the U.S. economy is proving more resilient to tariffs than initially feared, the trade-weighted broad dollar index remains 6% below its level at the start of the year (as of mid-August).
We have seen this play out in bond markets as well. Long-end Treasury yields initially declined earlier in the year, partly reflecting expectations of a weakening economy. However, yields rose sharply following “Liberation Day” and again after the passage of the One Big Beautiful Bill Act (BBB), with the latter widely expected to add approximately US$3 trillion to U.S. national debt over the next decade. While yield movements reflect several factors, including central bank communications, issuance patterns, and shifting growth and inflation expectations, the broader trend has been one of elevated long-term yields even as shorter-term yields have declined and inflation break evens are little changed from the start of the year.
Notably, the relationship between the dollar and U.S. 10-year Treasuries appeared to decouple after “Liberation Day” and more markedly following the passage of the BBB (chart 1). According to the Bank for International Settlements (BIS), the dollar’s sharp depreciation in April was not solely driven by selling but was amplified by ex-post FX hedging activity by non-U.S. investors, particularly from Asia. The BIS notes that the dollar’s trend appreciation since the pandemic, the dollar’s usual strength during risk-off episodes, and the flattening of the U.S. yield curve during the U.S. Federal Reserve’s hiking cycle, which increases the costs of hedging, had previously led to reduced FX hedge ratios among foreign investors. The April depreciation, coupled with a modest steepening in the yield curve, prompted a wave of delayed hedging, which tends to exert more pronounced pressure on the dollar than simultaneous hedging, contributing to its continued weakness through May. As hedge ratios adjust upward, the BIS suggests that the impact of ex-post hedging is likely to fade, and future dollar movements will increasingly reflect broader macroeconomic and U.S.-specific developments.
Rather than offering a verdict on the future of U.S. exceptionalism, this section explores different dollar and yield outcomes under alternative deficit scenarios, given the central role these deficits are likely to play in the medium to long term, as suggested by emerging evidence. Recent research from the International Monetary Fund (IMF) has found that the relationship between fiscal balances and long-term rates is not stable over time and has in fact strengthened as fiscal positions have deteriorated. The anticipated spending increases under the BBB are expected to further erode the U.S. fiscal position, amplifying these pressures on term premia and the dollar.
In our July base case, in which the federal deficit rises to and holds near 6.8% of nominal GDP through 2028 before gradually narrowing—in line with Congressional Budget Office (CBO) projections and BBB estimates—we project an additional 3.5% depreciation in the dollar by the end of 2026, building on the 7% decline already observed between early and mid-year 2025. The timing of this adjustment is uncertain; the depreciation may be limited in the near term, but structurally higher deficits are likely to weigh on the dollar more meaningfully as the horizon extends. By 2030, the cumulative decline reaches roughly 7.5%. This reflects an environment where policy, geopolitical, and fiscal concerns are undermining investor confidence, keeping long-term yields elevated in the near term, even as policy rates decline. Unlike the typical pattern where falling policy rates would lead to lower long-term yields and a weaker dollar, these concerns delay the drop in yields while further weakening the dollar. In this case, yields eventually resume a downward trend in line with fundamentals.
Larger deficits, reaching 7.3% or 7.8% of GDP, accelerate this trend (charts 2–5). In these scenarios, the dollar weakens by around 4% by the end of 2026 and by as much as 8%–9% by the end of 2030. The erosion of confidence is more pronounced here, leading to stronger upward pressure on long-term rates and a slower normalization in yields despite expected policy easing. The result is a more pronounced and persistent weakening of the currency.
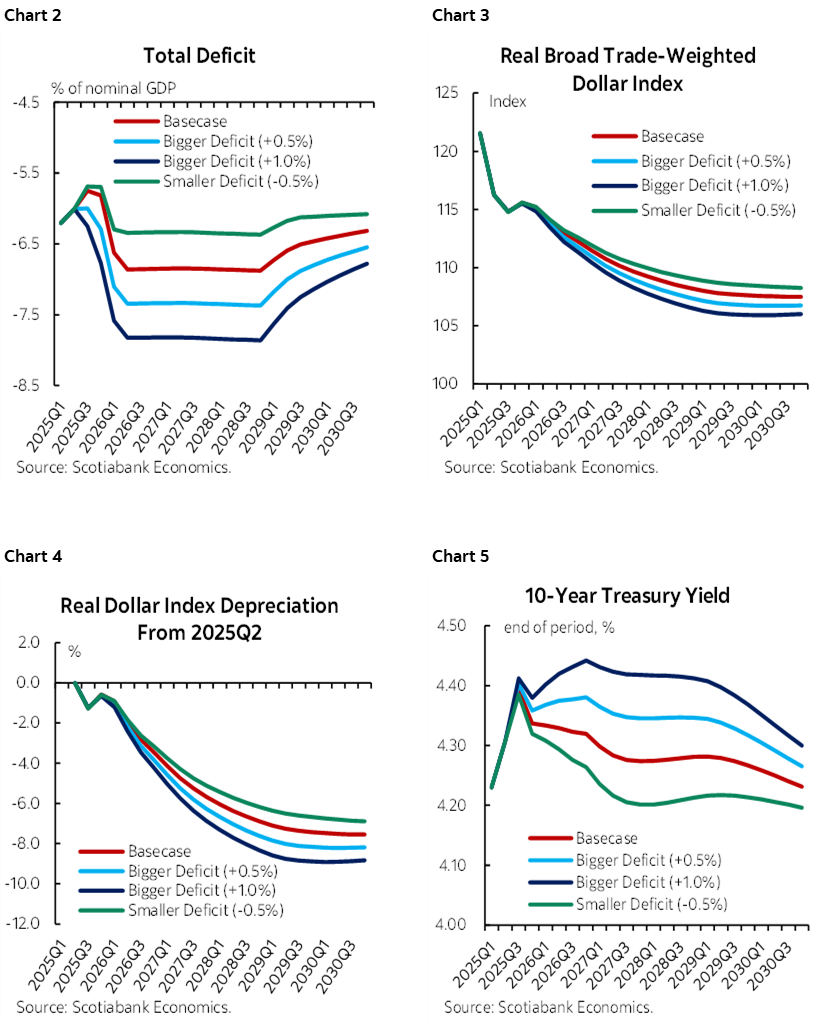
Conversely, a more disciplined fiscal path—driven by stronger economic growth or higher-than-expected tariff revenues, for example—in which the deficit narrows to 6.3% of GDP in 2026 through 2028, would support a more stable outcome. With CBO’s August update showing that recent tariff changes would increase revenues, resulting in reduced deficit projections, the probability of this more favourable deficit scenario has somewhat increased. In this case, the dollar still depreciates, but more modestly: 3% by 2026 and 6.9% by 2030 relative to Q2/25. Improved investor sentiment reduces term premia, allowing long-term rates to adjust more quickly to falling policy rates. The dollar benefits from a more conventional easing environment and relationship with yields differential.
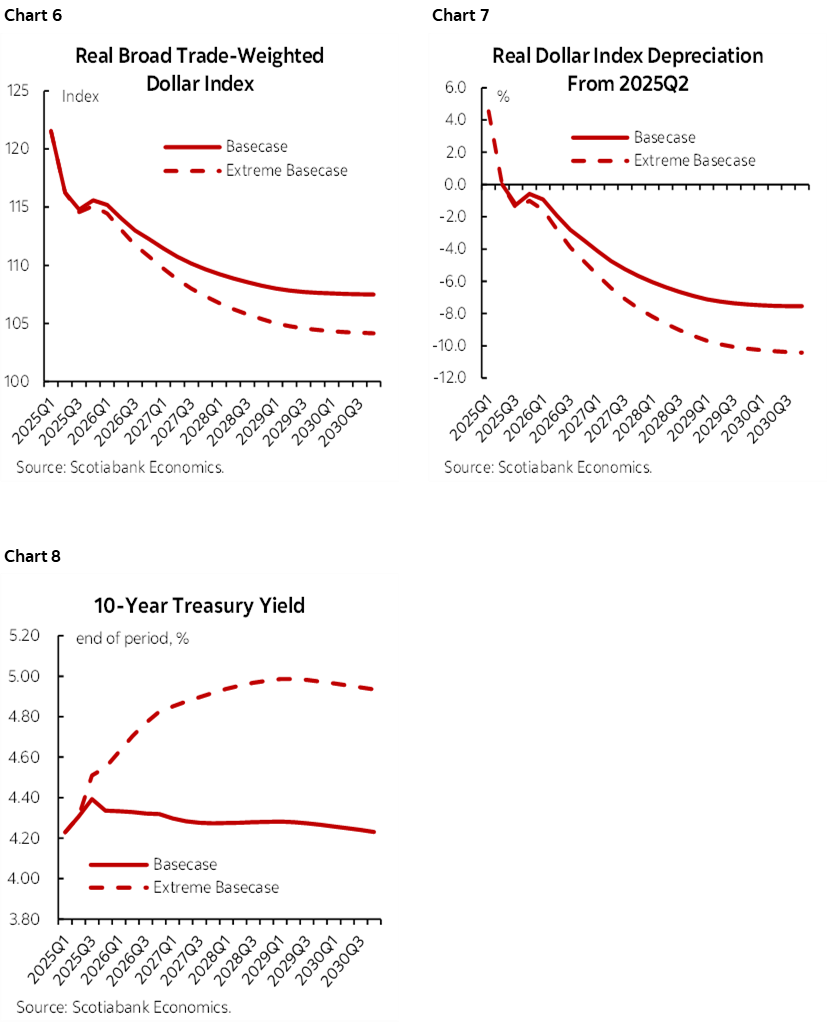
Importantly, the range of outcomes is determined not only by the size of the fiscal deficit, but also by the sensitivity of yields and the dollar to those deficits. In a final extreme case, we consider what happens when we increase the coefficients on the deficit in both the 10-year yield and dollar equations by two standard deviations relative to the mid-point estimates (charts 6–8). This adjustment reflects the inherent uncertainty around coefficient estimates, the potential for nonlinear and time-varying market reactions to worsening fiscal positions, and broader uncertainty in the policy environment. Under this extreme case specification, the base case itself shifts materially: Long-term yields are persistently higher, by as much as 50–60 bp, and the dollar weakens more substantially, depreciating by roughly 5% by 2027 and around 10% by 2030. The opposite would be true if we were to decrease the coefficients on the deficit in both equations by two standard deviations to reflect the uncertainty in the other direction.
DISCLAIMER
This report has been prepared by Scotiabank Economics as a resource for the clients of Scotiabank. Opinions, estimates and projections contained herein are our own as of the date hereof and are subject to change without notice. The information and opinions contained herein have been compiled or arrived at from sources believed reliable but no representation or warranty, express or implied, is made as to their accuracy or completeness. Neither Scotiabank nor any of its officers, directors, partners, employees or affiliates accepts any liability whatsoever for any direct or consequential loss arising from any use of this report or its contents.
These reports are provided to you for informational purposes only. This report is not, and is not constructed as, an offer to sell or solicitation of any offer to buy any financial instrument, nor shall this report be construed as an opinion as to whether you should enter into any swap or trading strategy involving a swap or any other transaction. The information contained in this report is not intended to be, and does not constitute, a recommendation of a swap or trading strategy involving a swap within the meaning of U.S. Commodity Futures Trading Commission Regulation 23.434 and Appendix A thereto. This material is not intended to be individually tailored to your needs or characteristics and should not be viewed as a “call to action” or suggestion that you enter into a swap or trading strategy involving a swap or any other transaction. Scotiabank may engage in transactions in a manner inconsistent with the views discussed this report and may have positions, or be in the process of acquiring or disposing of positions, referred to in this report.
Scotiabank, its affiliates and any of their respective officers, directors and employees may from time to time take positions in currencies, act as managers, co-managers or underwriters of a public offering or act as principals or agents, deal in, own or act as market makers or advisors, brokers or commercial and/or investment bankers in relation to securities or related derivatives. As a result of these actions, Scotiabank may receive remuneration. All Scotiabank products and services are subject to the terms of applicable agreements and local regulations. Officers, directors and employees of Scotiabank and its affiliates may serve as directors of corporations.
Any securities discussed in this report may not be suitable for all investors. Scotiabank recommends that investors independently evaluate any issuer and security discussed in this report, and consult with any advisors they deem necessary prior to making any investment.
This report and all information, opinions and conclusions contained in it are protected by copyright. This information may not be reproduced without the prior express written consent of Scotiabank.
™ Trademark of The Bank of Nova Scotia. Used under license, where applicable.
Scotiabank, together with “Global Banking and Markets”, is a marketing name for the global corporate and investment banking and capital markets businesses of The Bank of Nova Scotia and certain of its affiliates in the countries where they operate, including; Scotiabank Europe plc; Scotiabank (Ireland) Designated Activity Company; Scotiabank Inverlat S.A., Institución de Banca Múltiple, Grupo Financiero Scotiabank Inverlat, Scotia Inverlat Casa de Bolsa, S.A. de C.V., Grupo Financiero Scotiabank Inverlat, Scotia Inverlat Derivados S.A. de C.V. – all members of the Scotiabank group and authorized users of the Scotiabank mark. The Bank of Nova Scotia is incorporated in Canada with limited liability and is authorised and regulated by the Office of the Superintendent of Financial Institutions Canada. The Bank of Nova Scotia is authorized by the UK Prudential Regulation Authority and is subject to regulation by the UK Financial Conduct Authority and limited regulation by the UK Prudential Regulation Authority. Details about the extent of The Bank of Nova Scotia's regulation by the UK Prudential Regulation Authority are available from us on request. Scotiabank Europe plc is authorized by the UK Prudential Regulation Authority and regulated by the UK Financial Conduct Authority and the UK Prudential Regulation Authority.
Scotiabank Inverlat, S.A., Scotia Inverlat Casa de Bolsa, S.A. de C.V, Grupo Financiero Scotiabank Inverlat, and Scotia Inverlat Derivados, S.A. de C.V., are each authorized and regulated by the Mexican financial authorities.
Not all products and services are offered in all jurisdictions. Services described are available in jurisdictions where permitted by law.