A NEW NARRATIVE ON ENERGY NEEDED AS IMBALANCES GROW
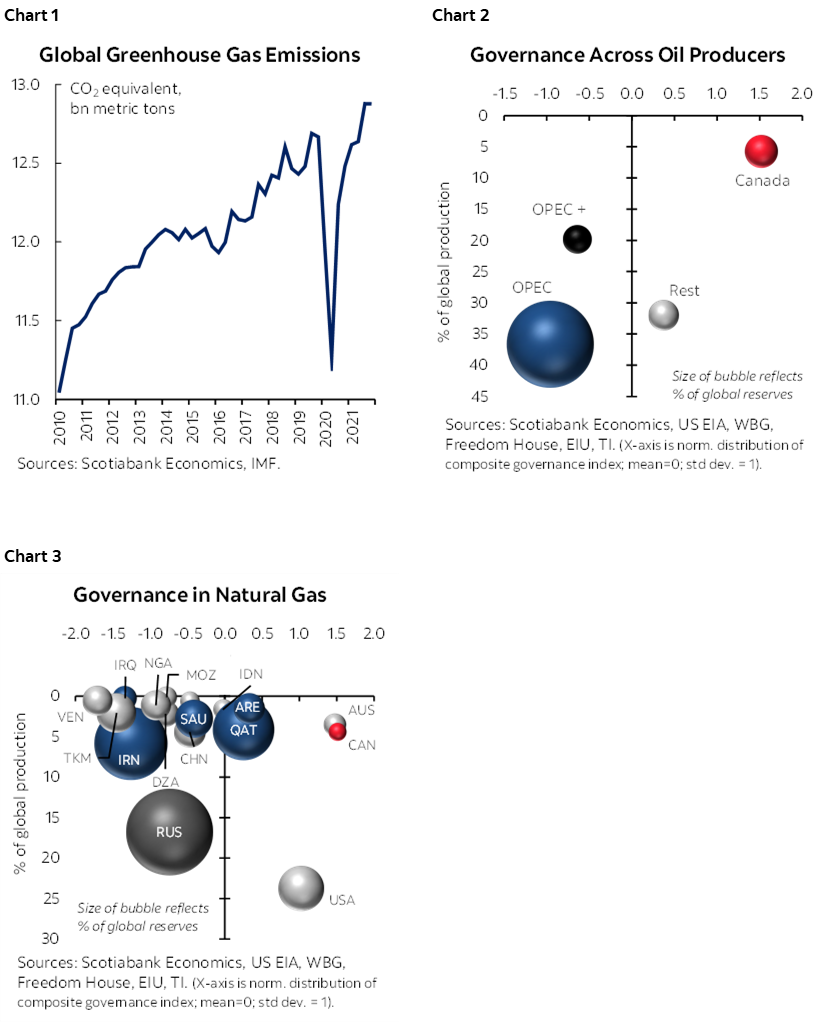
- Net zero goals are necessarily ambitious, and we have a collective responsibility to meet our commitments. Ever-growing global greenhouse gas emissions underscore the urgency (chart 1).
- However, trends in global energy investment suggest the world is falling well short of a path consistent with an orderly transition to net zero by 2050. Investments in clean energy alternatives are not keeping pace with the phase-out of fossil fuels against growing global energy demand.
- Mismatches are particularly acute for the oil and gas sector where waning investments (at least within non-OPEC countries) largely reflect a net zero future despite shortfalls in alternative energy supply. Meanwhile, renewed investments in carbon-intensive coal are picking up some of the slack as demand eclipses supply. Recent geopolitical events have only amplified—not created—these looming disparities.
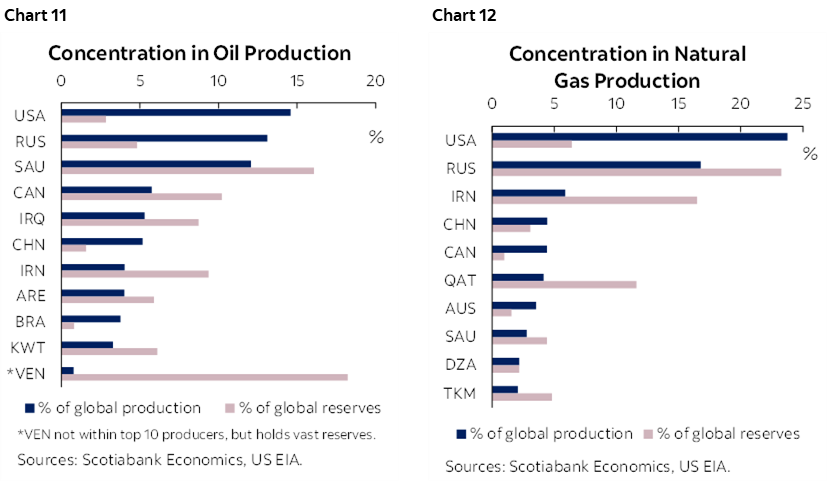
- Recent developments have starkly underscored that markets (and policymakers) have not internalized energy security risks. Global oil and gas production—and reserves even more so—are highly concentrated within a small set of countries with extremely weak governance regimes that stand a lot to lose in the transition to net zero (charts 2 & 3). And their market dominance is set to grow.
- This should serve as a wake-up call. Widening energy imbalances and heightened polarization suggest that persistent volatility and elevated energy prices could mark the path ahead. Such a path would not only undermine the ultimate goals of net zero, but could have even graver societal repercussions.
- The world—and Canada—needs a new narrative on the defining role fossil fuels will play in the relative orderliness of the necessary transition to net zero. Getting to less very likely means more in the years ahead, but that “more” will have to come from markets with strong governance records and credible net zero commitments if the global emissions curve is to durably pivot downward.
- Canada is uniquely positioned to reframe this discourse. It has tremendous traditional energy reserves with well-governed institutions, but ambitions, at least, to accelerate an orderly transition to cleaner energy sources—and it hosts vast reserves of critical minerals essential on that path.
- A slower off-ramp for Canada’s oil and gas sectors could be in the global interest despite putting more pressure on our own domestic goals. This should not be business-as-usual: Canada still needs to execute against ambition in decarbonizing its energy footprint, while concurrently pushing the international community and its governing institutions to more aggressively target global policy and market failures needed for course correction.
- The world also needs to defuse a different form of polarization—across stakeholders—that largely precludes a dialogue on what the best—or least bad—path could be on a transition where fossil fuels are still part of the story.
- A start would be a blunt assessment of what a disorderly path could look like in the years ahead. The International Energy Agency should paint this stark picture, alongside its “orderly” scenarios , coupled with potential coordinated policy responses from the likes of the IMF, World Bank, and WTO.
- Importantly, governments around the world should be poised to respond.
INFLECTION POINT FOR NET ZERO … BUT IN WHICH DIRECTION?
The tragic Russian invasion of Ukraine has underscored the limits of economics in a geopolitical world. The global policy community has been caught back-footed by developments that had, in hindsight, been showing signs of strain for years. Necessary sanctions against Russia sent commodity prices sky-high, exacerbating already worrying inflationary pressures around the world. While there has been some softening in prices against recession risk, supply still remains tight, foreboding further volatility ahead.
European economies are facing the worst of the fallout given their extensive reliance on Russian energy. These same countries that have been global leaders in the green transition are back-pedalling as scarcity of essentials extracts a very human toll. And the worst is likely to come as winter arrives. From broad-based gas tax relief, re-commissioning old coal plants, proposed price caps on Russian oil, to potential windfall taxes on others, governments around the world are deploying a slew of measures that would have been unimaginable only months ago.
Net zero ambitions face an inflection point. Recent developments should spur a doubling down on decarbonization efforts including reliable energy supply and there are a number of promising signs in this direction including measures within the US Inflation Reduction Act. More worryingly, it could derail the net zero drive in parts of the world and further fuel polarizations that could lead the global community down a highly disruptive and disorderly transition path.
Course correction may start with acknowledging some market fundamentals—and failures—that led us here. Clear signs of potential and persistent energy supply and demand mismatches on the horizon do not bode well for an orderly transition. Energy supply should not be conflated with demand: cutting demand should dampen supply over time, but stifling supply does not, in isolation, reduce demand. Recent events have also underscored that markets are imperfect, with an abject failure to internalize the costs of energy security, along with a weak and fragmented global carbon pricing landscape.
Today’s near-term responses by policymakers are understandable, if not excusable, in the face of current hardships, but a failure to address the underlying causes and hedge against uncertainties ahead puts net zero ambitions at peril. Market failures, at the end of the day, are policy failures.
THE BEST LAID PLANS
There have been enormous strides in mobilizing support for net zero. Almost 85% of global emissions are now reflected in countries with net zero targets, while a third of the largest publicly traded corporations have such goals. But the ambition gap is still enormous: current policies only capture a third of the emissions reductions needed to close the gap to keep the 1.5 °C target within reach, according to the International Energy Agency (IEA, chart 4). Updated scenarios by the United Nations Framework Convention on Climate Change paint a similar picture with an asymmetric distribution of potential outcomes skewed above the 1.5 °C target.
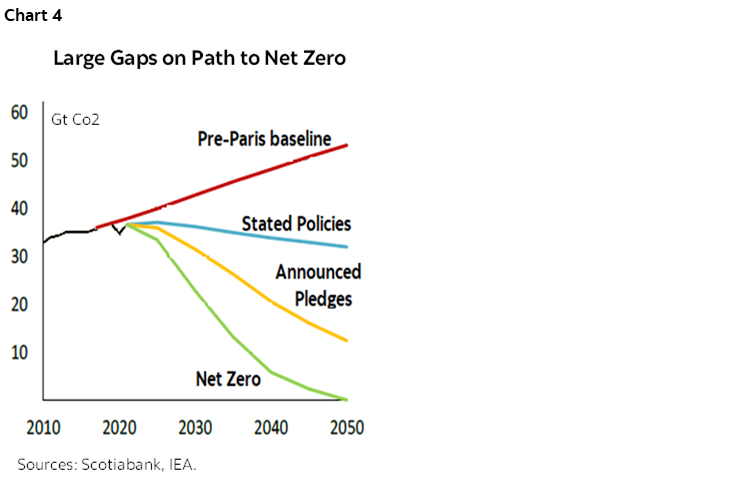
Global pathways to net zero are ambitious by design (and out of necessity). The IEA’s roadmap to net zero—updated in its recent World Energy Outlook—envisions a global economy that is twice as large by 2050, its population 25% greater, and energy demand 8% lower than today. Its analysis is intended to rally policymakers around the opportunities stemming from a timely and orderly transition, while also flagging the enormous gaps between current policies and those required to attain the end goal. Its scenarios “by design” paint smooth, orderly transitions in which “markets are always in equilibrium with investment rising and falling in different sectors to allow for a balance of supply and demand”.
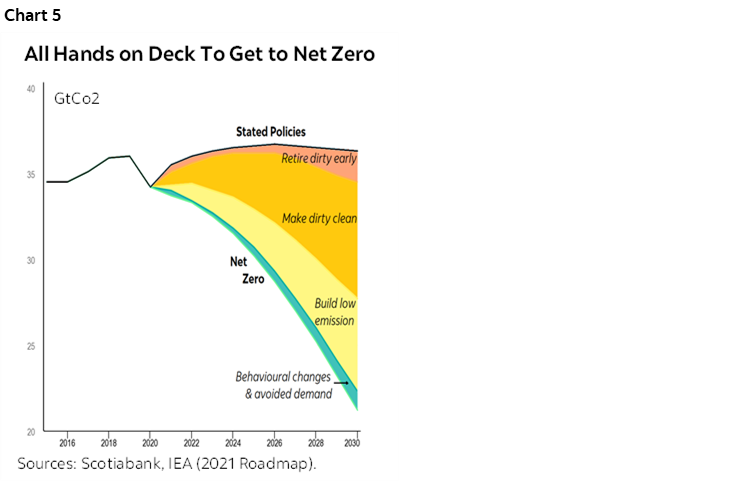
The energy sector—responsible for almost 75% of global emissions—must unequivocally undergo major transformations on this path. There is no panacea: the path to net zero demands a carefully sequenced rotation away from emissions-intensive energy sources to cleaner ones. The largest near-term gains would come from “making dirty cleaner”—in the words of the IEA—overshadowing contributions from low emissions solutions that would mostly have longer-term paybacks given their nascent stage of development. Meanwhile, retiring fossil fuels (namely unabated coal plants) and effecting behavioural changes play important, but not sufficient roles along the way (chart 5).
Global energy demand is a major wild card. Most of the growth in energy demand will come from emerging and developing countries, which currently account for about two-thirds of global emissions despite per capita energy consumption that is well-below advanced economies. In India, for example, it is less than a tenth of its American peers. About 10% of the world’s population still does not even have access to electricity. These parts of the world will experience the largest population gains, still rely largely on fossil fuels, and few have net zero commitments. Meeting basic needs will necessarily add to global energy demand, but the enormously wide range of assumptions around energy demand and emissions intensity compounds an already uncertain outlook.
From a supply perspective, lower emission energy sources are imperative. Technologies are largely available (but not deployed) to meet interim emissions targets by 2030, but half of the innovations needed by 2050 are still in their infancy. Financing needs are also substantial: the IEA estimates clean energy investments in the order of USD 4 tn annually are required by 2030 to close the ambition gap, with 70% of this deployed in emerging and developing markets. Demand for material inputs could drive a sevenfold uptick in the market size of critical minerals by 2030, giving a sense of scale needed on the path ahead.
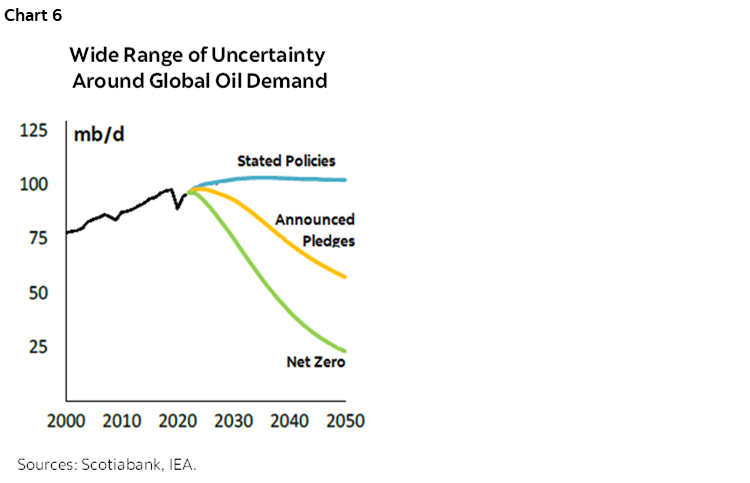
The role of fossil fuels would diminish over the long run. Their share in the global energy mix has stood around 80% over the past few decades, but would necessarily collapse to about 20% by 2050 in a net zero world. The IEA projects fossil fuel demand would peak (or at least plateau) in all of its scenarios in its recent outlook, albeit with a wide range in time and tilt. Under current policies, demand for oil would level off at 103 mb/d in the mid-2030s and decline only slightly thereafter through 2050 versus a sharp pivot to just under 24 mb/d by 2050 under net zero (chart 6). Demand for natural gas similarly peaks by 2030 before plateauing thereafter. It only sees a material decline in demand under more ambitious pathways, leaving a similarly wide range of uncertainty around fuel demand. Coal demand peaks in 2025 and declines thereafter under all scenarios, albeit remains elevated relative to last year’s outlook owing to recent fuel switching.
A misalignment or miscalibration of any of these trajectories would drive a more volatile transition ahead. In the words of the IEA, “the current energy shock has already had a seismic effect, providing a vivid reminder—if one was needed—of the importance of energy security and diversity. In so doing, it has highlighted the fragility and unsustainability of many aspects of our current energy system and the wider risks that this poses for our economies and well-being.”
MIND THE GAP
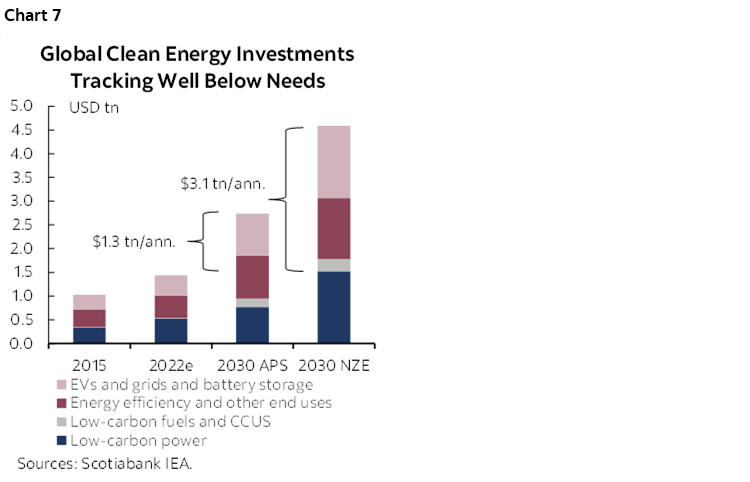
A quick stock-take against these goals and assumptions is not reassuring. Global clean energy investments have been accelerating at a pace of 12% y/y since 2020 after 5 years of flat real growth—to USD 1.3 tn in 2021 according to the IEA —but still, this must be tripled by 2030 to be consistent with a net zero path (chart 7). Furthermore, about half of the recent uptick reflects cost pressures, not additional supply. Other sources put the global financing need closer to USD 6 tn per year. With financing shortfalls particularly acute in developing and emerging markets, technological leapfrogging in these markets remains largely elusive.
Investments in fossil fuels, on the other hand, have waned. While activity has been picking up modestly since the pandemic-driven dip in 2020, global investment in fossil fuels in 2022 is still expected to sit about 30% below 2015 levels when the Paris Agreement was signed. In isolation, this should be positive—with caveats—as it is broadly aligned with countries’ climate pledges from a supply perspective. However, still more effort to curb demand is required to be consistent with an orderly path to net zero. Meanwhile, governments around the world have recently unleashed various fossil fuel subsidies in the face of escalating energy prices, demonstrating the risk of policy retreat in the face of volatility and supply deficits.
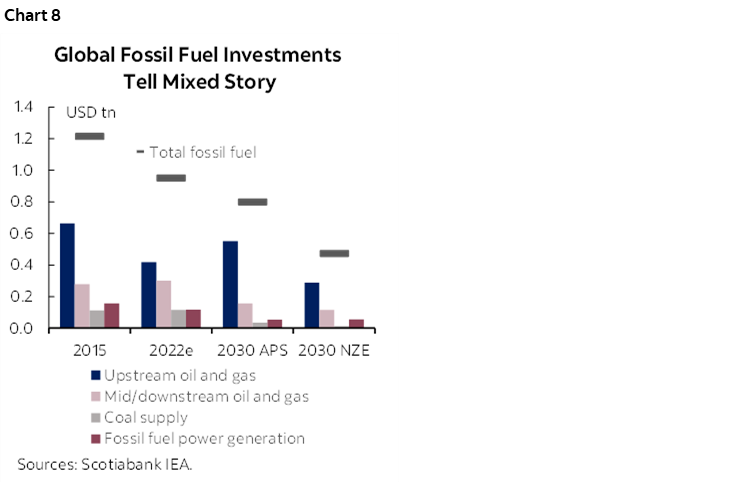
The current high-price environment is also impacting investment decisions unevenly within the fossil fuel sector which could potentially amplify imbalances. Coal investments, which are less capital- but more carbon-intensive, grew by 10% in 2021 and are accelerating at a similar pace in 2022. India, for example, plans to double its coal production in the coming decade to cover burgeoning domestic demand. Together with China, these two countries alone comprise about two-thirds of global coal demand. Elevated coal and fossil fuel power generation investments are not even consistent with current pledges, let alone a net zero path (chart 8). On the other hand, upstream oil and gas investment is still below pre-pandemic levels and is tracking almost 40% below 2015 levels. While this is consistent with a net zero world, it falls short of demand in a current-pledges world.
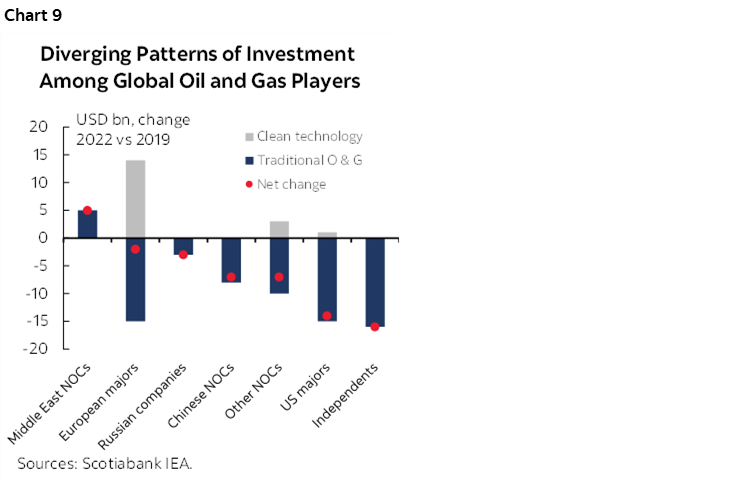
Investment patterns also deviate by geography and ownership structures. Four-fifths of the increases in upstream oil and gas investments in 2021 were undertaken by national oil companies in the Middle East in an effort to boost dwindling spare capacity, with some investment intentions of majors running in the order of 15–30% for 2022. Russian companies’ planned investment hikes in 2022 are unclear but should not be dismissed given solid revenue flows and potential alternative trading partners. European companies, on the other hand, are largely looking through high prices and are focusing on ramping up clean energy investments (chart 9).
It would be an understatement to say investment signals are mixed for fossil fuels. Further complicating the picture in the IEA’s new outlook is an expectation that Russian fossil fuel production needs to be replaced by production elsewhere under all scenarios. The IEA has extensively caveated last year’s message that no new oil and gas fields are needed on a path to net zero, emphasising among other considerations that any new developments would have to prioritize low-emissions technologies, while geo-political and commercial risk are elevated.
In short, energy imbalances are likely to persist in the years ahead absent decisive and coordinated action by policymakers. Without additional efforts to curb demand, today’s levels and composition of capital spending in the energy sector could further exacerbate supply pressures, put upward pressure on prices, and reduce the ability of markets to weather volatility ahead. In the IEA’s own words “In the absence of accelerated clean energy transitions, spending on traditional fuels is also insufficient to keep the current system operating effectively. Something has to change in order to avoid an energy-starved world characterised by continued price volatility.” All the while, countries could potentially pump out even more—not less—emissions into the atmosphere.
An increasingly polarized world with volatile and persistent energy supply shocks in the decade ahead could have important macro economic consequences. The largest economic growth dividends on an orderly path would come from ramped-up investments in clean energy (and averted costs), but ambition gaps are still enormous. Meanwhile, comprehensive modeling under UNEP FI’s Taskforce on Climate-related Financial Disclosures illustrates various scenarios whereby most major markets could experience sustained inflationary pressures over a multi-year horizon from a combination of elevated energy prices, carbon taxes, and/or increasingly divisive approaches to climate action. The IMF has also attempted to put numbers to growth and inflationary pressures in the near term under balanced policy responses. Admittedly, market failures and policy gaps make it challenging to predict the direction, let alone the magnitude of the potential consequences.
NECESSARY, BUT NOT SUFFICIENT
Fossil fuels also illustrate the imperative of tackling both supply and demand through an emissions lens, not just an economic one. Around three-quarters of emissions from oil, for example, come from its combustion. Canadian oil production is materially more carbon-intensive than many peers according to oft-cited research by Masnadi et al., but the gap narrows substantially under a more recent life-cycle comparison by IHS Markit in a “well-to-wheels” approach. Substantial commitments to carbon capture, utilisation and storage investments from governments—with private capital now on the table—are critically important to further decarbonisation. Meanwhile, Canada’s natural gas already confers a carbon advantage relative to many peers as recently laid out by the Public Policy Forum. This is not intended to discount the importance of reducing the production footprint, but to underscore the need to also bear down on demand-side measures.
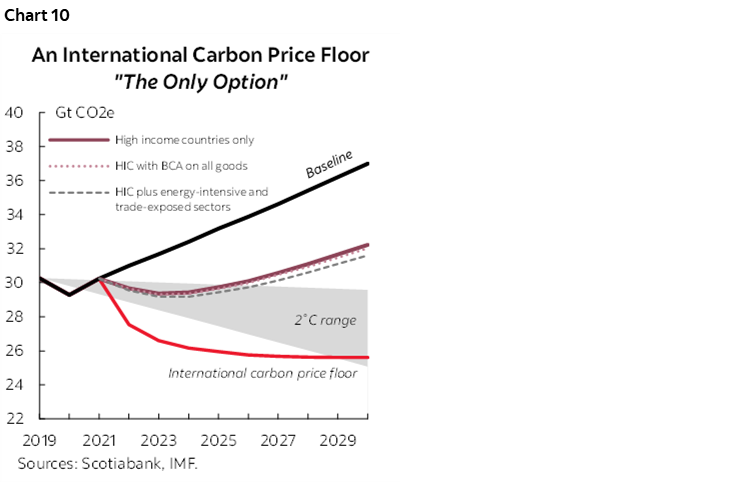
Greater internalization of carbon costs needs to do more of the heavy lifting in curbing demand, driving efficiencies, and spurring changes in behaviour. The IMF has proposed a tiered international carbon floor price (ICPF) which they dub “the only option” with the potential to incent a sufficiently broad-based market response consistent with keeping temperatures below 2 °C. Its analysis finds that advanced countries’ efforts alone—even with much more aggressive carbon pricing—would not limit global emissions sufficiently. Similarly, alternative scenarios that tack on more costly and complicated carbon border adjustment taxes or concentrate pricing on emissions-intensive and trade-exposed sectors would not bend the emissions curve sufficiently (chart 10).
There is effectively no price on carbon at a globally-relevant scale today. The IMF estimates the global average explicit carbon price is only USD 6 per ton versus pricing closer to USD 75 which is likely needed by 2030 (and closer to USD 225 for high-income countries in a tiered scheme). Canada’s federal carbon levy currently sits at CAD 50 per tonne (~USD 35/ton) and is set to gradually increase to CAD 170 per tonne by 2030 (~USD 120/ton). It is yet to be determined if G7 intentions to create a Carbon Club bring us closer to a coherent carbon price floor or towards a more fragmented CBA-like approach across trading blocs that could fuel further divisiveness across regions without necessarily bringing down global emissions.
It also underscores a practical challenge of current emissions accounting. A production-based approach as per UNFCCC standards introduces potential for additional distortions to the global energy balance through trade channels. For example, energy production sits on domestic balance sheets even if the benefits (i.e., consumption) are exported. This is a well-recognized challenge with no simple answer, but it illustrates yet another risk to an orderly transition where domestic incentives may run counter to the global good.
Regardless, greater internalization of environmental impacts is not likely sufficient to secure an orderly path to net zero in a geopolitical world. By design, this target focuses squarely on emissions. Recent events have highlighted that energy security (or poverty) will trump energy’s environmental impact if policymakers are confronted with the real-life trade-offs many parts of the world are facing today.
PARADOX OF PLENTY
On a path to net zero, fossil fuel production is increasingly concentrated in the Middle East and Russia. According to the IEA, the share of global oil production from OPEC and Russia would increase to over 60% by 2050 from 47% (2020) on a net zero path. The global share of natural gas production in the Middle East and Russia would see a similar uptick in concentration: by over 10 ppts to almost 45% by 2050. Consistent with current investment trends, higher-cost fossil fuel producers with net zero targets like Canada and Europe would see declining production over time.
But it would not necessarily be the highest emitters that could come offline first. According to more recent work under Masnadi, the concentration of pricing power—particularly in the oil sector—has the potential to distort market signals and exploit policy asymmetries in the face of demand shocks. Meanwhile, developing Asian economies remain dependent on fossil fuel imports, with a further concentration in trade flows expected between Middle Eastern-Russian and developing Asian economies. The latter’s import dependency is set to grow to about 50% and 85% for natural gas and oil, respectively, within this corridor by 2050 according to the IEA.
It would not only be naïve, but irresponsible for policymakers to discount the risk of an increasingly polarized path as the world navigates the energy transition. The resource curse is a well-studied phenomenon in the field of economics, linking natural endowment to weaker governance and conflict. A third of global oil reserves are concentrated in two countries alone—Venezuela and Saudi Arabia—while Iran and Iraq tip the tally to over a half. Natural gas reserves are even more concentrated among a subset of countries with Russia and Iran alone accounting for almost 50% of global reserves. On a current production basis, the picture looks only marginally better (charts 11 & 12). While it is appropriate to consider production with a view to meeting current demand, it is also important to reflect on reserves, namely what might (or might not) be exploited on a disorderly path over the long run when the rules of the game (by design or otherwise) may have changed, though admittedly reserves can be a dynamic marker.
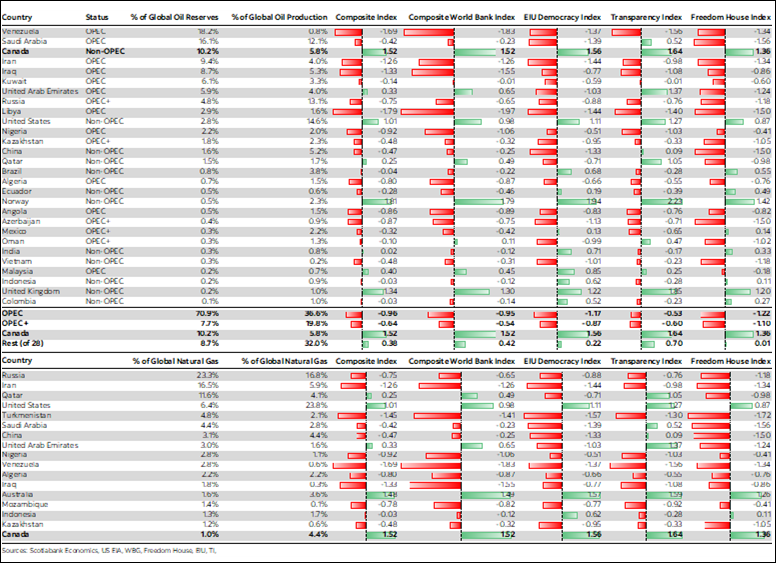
Governance by almost any metric among this subset of countries is abysmal. We develop a composite indicator comprised of publicly-available, third-party sources that cover a broad range of factors under the auspice of governance including transparency, corruption, rule of law, and democracy from the World Bank, Transparency International, Freedom House, and the Economist Intelligence Unit. There is overlap across the indicators—many of which are composites themselves—but this smooths out potential anomalies across sources or methodologies (see Annex for details). Almost three-quarters of global oil reserves (and almost 50% of current production) sit in countries where governance is almost a full standard deviation worse than an average sovereign. While the global supply of natural gas is less organized than oil, the balance of global production and reserves sits in countries with highly questionable governance regimes.
Canada is one of the few exceptions to the norm. While Canada’s current oil production was just shy of 6% of global output in 2021, it has the third largest share of proven reserves at 10%. This is larger than all non-OPEC/OPEC+ countries combined. Canada’s share of global natural gas production is roughly similar at about 5%, while its share of global reserves is about 1%. Meanwhile, Canada clearly stands above its producer peers by one-and-a-half standard deviations across a broad range of governance indicators. To be fair, Canada is still grappling with its own domestic governance issues around natural resources that are not likely fully reflected in these indicators, but, on balance, the bias is likely on under- versus over-exploitation relative to other major jurisdictions with sizable natural endowments.
A NEW NARRATIVE NEEDED
The global community’s net zero plans have been stress-tested in recent months revealing major vulnerabilities. It is time for a mirror moment that compels more proactive and expeditious policy responses, individually and collectively. A frank acknowledgment that a disorderly transition is plausible could reduce its probability. Aspirational targets and ambitious pathways play an important role in galvanizing support around net zero, but scenarios in their most useful form should reflect a range of plausible outcomes irrespective of their desirability. A starting point could be a more balanced set of scenarios that could provoke discussions among policymakers and the international community around more proactive and coordinated approaches to ward off the potential of a more polarized path in the coming years.
The world needs to wean itself off fossil fuels, but they play a pivotal role in an orderly transition to net zero. We are not currently on such an orderly path. A massive scale-up in investments—in both clean and cleaner—technologies is essential but we are not there yet. In the interim, the world needs more fossil fuels to get to less. A different form of polarization across stakeholders makes such a dialogue challenging: if the world still needs oil and gas in the years ahead, what is the best—or least bad—path that still points the planet towards net zero? What are the assurances and milestones needed along the way to ensure that this is not just business-as-usual for traditional energy providers? And how do we ensure a means-to-end approach that considers the human toll along the way?
A necessary follow-on is fixing the flaws in the frameworks that got us here. A failure to internalize both environment and governance aspects of supply could jeopardize the ultimate goal of limiting global temperature increases, particularly as cleaner options lag growing energy demand. Blind reliance on weakly governed energy sources (traditional or alternative) is not the way forward. Perhaps if the Carbon Club is willing to consider practically-problematic price caps on Russian oil, they should consider price premiums for better governed (and secure) energy resources as alternative supply is scaled up. That may be too ambitious in a world of incremental policymaking, but hastening the development (and acceptance) of the transition financing landscape that could accelerate “making dirty clean—and compliant” may be one step in the right direction. These are just some examples. International institutions mandated with global policy coordination such as the IMF, World Bank, and the WTO, along with the IEA, should be tasked with providing practically-feasible policy responses. Importantly, governments should be poised to respond.
Canada is in a unique position to lead the charge. It has tremendous traditional energy reserves with well-governed institutions, but ambitions, at least, to accelerate an orderly transition to cleaner energy sources—and it hosts vast reserves of critical minerals essential to getting there. Getting its own policy frameworks in place and actions in motion is critical to meeting Canada’s domestic commitments, but in an increasingly polarized world that may not be enough. A slower off-ramp for Canada’s oil and gas sectors could be in the global interest despite putting more pressure on our own domestic goals. But what will it take to have this debate at home and abroad?
This is just a warm-up for tackling global governance issues that likely lay ahead on the transition “from a fuel-intensive to a mineral-intensive energy system” where the potential for imbalances and disruptions are even greater.
ANNEX: METHODOLOGY FOR COMPARING GOVERNANCE REGIMES ACROSS TOP OIL AND GAS-PRODUCING COUNTRIES
Four leading third-party, publicly-available governance indices were compiled:
- The World Bank Governance Indicators reports on governance indicators for over 200 countries and territories on six dimensions of governance: voice and accountability; political stability and absence of violence/terrorism; government effectiveness; regulatory quality; rule of law; and control of corruption.
- The Economist Intelligence Unit’s Democracy Index provides a snapshot of the state of world democracy for 165 independent states and two territories based on five categories: electoral process and pluralism; civil liberties; the functioning of government; political participation; and political culture.
- Transparency International’s Corruption Perception Index ranks 180 countries and territories around the world by their perceived levels of public sector corruption.
- Freedom House’s Freedom in the World is a yearly survey that measures the degree of civil liberties and political rights in 195 countries and 15 territories based on a series of 25 indicators derived from the Universal Declaration of Human Rights.
Each governance indicator was normalized (standard distribution) with a mean of zero and a standard deviation of one. For each country, we subtracted the global mean from that country’s normalized governance indicator and divided it by the standard deviation. We then computed a Composite Index of the governance indicators for each country by taking the simple average of the governance indicators (including a simple average of the six World Bank governance indicators). Results for a subset of countries reflecting the vast majority of global production are included below.
With research assistance from Jaykumar Parmar, Economic Analyst, Scotiabank Economics.
DISCLAIMER
This report has been prepared by Scotiabank Economics as a resource for the clients of Scotiabank. Opinions, estimates and projections contained herein are our own as of the date hereof and are subject to change without notice. The information and opinions contained herein have been compiled or arrived at from sources believed reliable but no representation or warranty, express or implied, is made as to their accuracy or completeness. Neither Scotiabank nor any of its officers, directors, partners, employees or affiliates accepts any liability whatsoever for any direct or consequential loss arising from any use of this report or its contents.
These reports are provided to you for informational purposes only. This report is not, and is not constructed as, an offer to sell or solicitation of any offer to buy any financial instrument, nor shall this report be construed as an opinion as to whether you should enter into any swap or trading strategy involving a swap or any other transaction. The information contained in this report is not intended to be, and does not constitute, a recommendation of a swap or trading strategy involving a swap within the meaning of U.S. Commodity Futures Trading Commission Regulation 23.434 and Appendix A thereto. This material is not intended to be individually tailored to your needs or characteristics and should not be viewed as a “call to action” or suggestion that you enter into a swap or trading strategy involving a swap or any other transaction. Scotiabank may engage in transactions in a manner inconsistent with the views discussed this report and may have positions, or be in the process of acquiring or disposing of positions, referred to in this report.
Scotiabank, its affiliates and any of their respective officers, directors and employees may from time to time take positions in currencies, act as managers, co-managers or underwriters of a public offering or act as principals or agents, deal in, own or act as market makers or advisors, brokers or commercial and/or investment bankers in relation to securities or related derivatives. As a result of these actions, Scotiabank may receive remuneration. All Scotiabank products and services are subject to the terms of applicable agreements and local regulations. Officers, directors and employees of Scotiabank and its affiliates may serve as directors of corporations.
Any securities discussed in this report may not be suitable for all investors. Scotiabank recommends that investors independently evaluate any issuer and security discussed in this report, and consult with any advisors they deem necessary prior to making any investment.
This report and all information, opinions and conclusions contained in it are protected by copyright. This information may not be reproduced without the prior express written consent of Scotiabank.
™ Trademark of The Bank of Nova Scotia. Used under license, where applicable.
Scotiabank, together with “Global Banking and Markets”, is a marketing name for the global corporate and investment banking and capital markets businesses of The Bank of Nova Scotia and certain of its affiliates in the countries where they operate, including; Scotiabank Europe plc; Scotiabank (Ireland) Designated Activity Company; Scotiabank Inverlat S.A., Institución de Banca Múltiple, Grupo Financiero Scotiabank Inverlat, Scotia Inverlat Casa de Bolsa, S.A. de C.V., Grupo Financiero Scotiabank Inverlat, Scotia Inverlat Derivados S.A. de C.V. – all members of the Scotiabank group and authorized users of the Scotiabank mark. The Bank of Nova Scotia is incorporated in Canada with limited liability and is authorised and regulated by the Office of the Superintendent of Financial Institutions Canada. The Bank of Nova Scotia is authorized by the UK Prudential Regulation Authority and is subject to regulation by the UK Financial Conduct Authority and limited regulation by the UK Prudential Regulation Authority. Details about the extent of The Bank of Nova Scotia's regulation by the UK Prudential Regulation Authority are available from us on request. Scotiabank Europe plc is authorized by the UK Prudential Regulation Authority and regulated by the UK Financial Conduct Authority and the UK Prudential Regulation Authority.
Scotiabank Inverlat, S.A., Scotia Inverlat Casa de Bolsa, S.A. de C.V, Grupo Financiero Scotiabank Inverlat, and Scotia Inverlat Derivados, S.A. de C.V., are each authorized and regulated by the Mexican financial authorities.
Not all products and services are offered in all jurisdictions. Services described are available in jurisdictions where permitted by law.