- In this report, we outline our ‘fundamentals-based’ model of the USDCAD exchange rate estimated at a daily frequency over the past two decades. Our model relies on four key pillars that explain to a very high degree the evolution of the Canadian dollar exchange rate. These are: oil prices, metals prices, US-Canadian interest rate differentials, and market volatility (risk sentiment). The model’s specificity is augmented with a broad measure of the value of the USD.
- Our latest estimates suggest that the USDCAD exchange rate is currently overvalued by around 2%, with the fundamental drivers suggesting a ‘fair value’ of 1.22 USD per CAD.
- We also estimate a daily regime-switching model that indicates when the CAD exchange rate exhibits increased sensitivity to broad market forces (volatility and the US dollar index) as opposed to more traditional economic fundamentals (price of oil and the interest rate differentials). Our model is a helpful tool to explain the CAD’s performance during periods of heightened market stress when core fundamental drivers play a supporting role to risk- or safety-motivated movements in foreign exchange markets.
- According to the regime-switching model, the CAD is currently trading well in line with its key determinants. The currency most recently deviated from its core drivers during the March 2020 Covid-19 shock when market volatility spiked to its highest since October 2008. Prior to last year’s period of market turmoil, the regime-switching model had not identified a significant deviation in the CAD from its core drivers since early-2017, around the time President Trump was inaugurated.
1) THE FUNDAMENTAL PATH OF THE USDCAD
Having a daily model that estimates the fundamental path of the USDCAD is important because it allows us to know, at any point of time, if the Canadian dollar is over or undervalued relative to the US dollar. Our fundamentals-based USDCAD model is built on four key pillars: commodity prices, interest rate differentials, risk sentiment, and broad USD forces.1 In the long-run, the equilibrium exchange rate is driven by relative currency demand which depends on the trade balance (increased US demand for Canadian goods sees increased purchases of Canadian dollars), the relative return on assets, overall USD movements (whether it’s liquidity-driven or due to US global trade imbalances), and haven-seeking demand for the US dollar.
1) Commodity prices:
a) WTI crude oil (chart 3). We include oil prices to account for the importance of energy trade between Canada and the US. Canada has consistently run a trade surplus in petroleum products trade with the US so higher oil prices result in a relative increase in demand for Canadian dollars, all else equal. Changes in the price of oil also impact the attractiveness of assets in the Canadian energy sector (whether it’s direct or indirect investment) and thus the CAD.
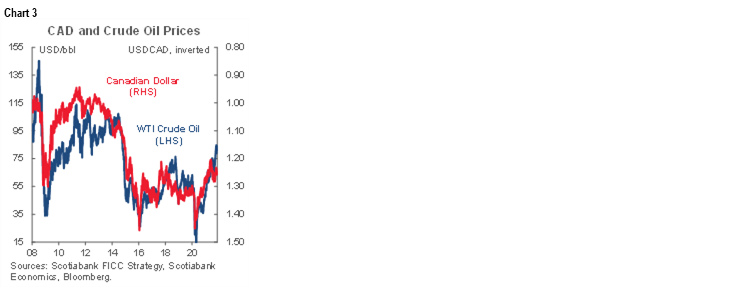
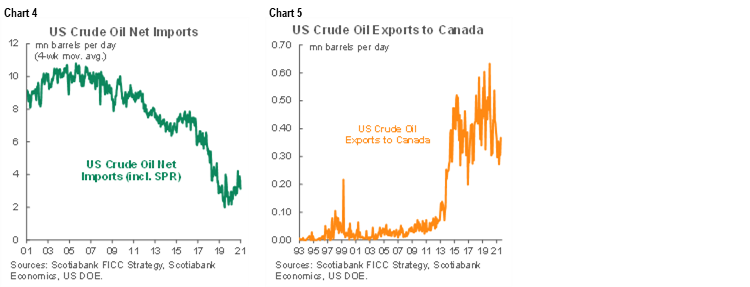
i) WTI Crude oil dummy variable (2000–2013 = 0, 2014–pres. = 1). We find that the sensitivity of the exchange rate to the price of oil declines starting around 2014, seemingly reacting with a lag to increased crude oil production in the US (mainly shale). While the US’s deficit with Canada in oil has continued to widen, the broad US crude deficit has narrowed significantly (chart 4, and chart 5 for US exports to Canada)—thus reducing the multilateral impact of higher crude prices on the USD. Going forward, we think that increased vehicle electrification and green energy efforts will likely see reduced reliance on oil and thus a reduction in the sensitivity of the USD to its price. Similarly, Canada’s energy sector has since become a smaller share of the country’s economy so fluctuations in oil prices have smaller reverberations on Canadian assets.
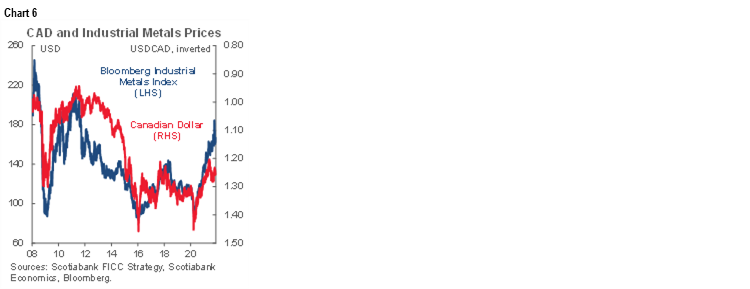
b) Bloomberg industrial metals index (chart 6). This weighted basket of copper, aluminum, zinc, and nickel is included given Canada’s trade surplus with the US in industrial metals, with a similar justification for the inclusion of crude oil prices.
2) Interest rate spreads:
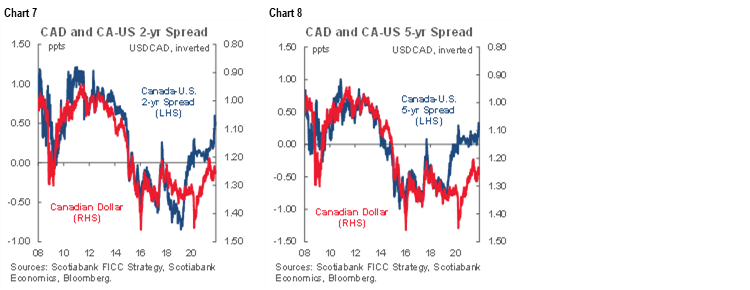
a) 2-year and 5-year Canada-US yield differentials (charts 7 and 8). Higher Canadian yields in relation to the US increase demand for CAD as investors seek higher returns in Canadian assets (all else equal). We include both the 2-yr and the 5-yr spreads to differentiate between shorter-term and longer-term investment horizons (note that 10-yr spreads are less statistically significant, in comparison). The former may act as a close reflection of near-term policy rate expectations while the latter points to expectations around how quickly the central banks will increase rates relative to each other. A specification that excludes either the 2- or the 5-year spread results in a weaker fit over our estimation horizon.
3) Volatility index:
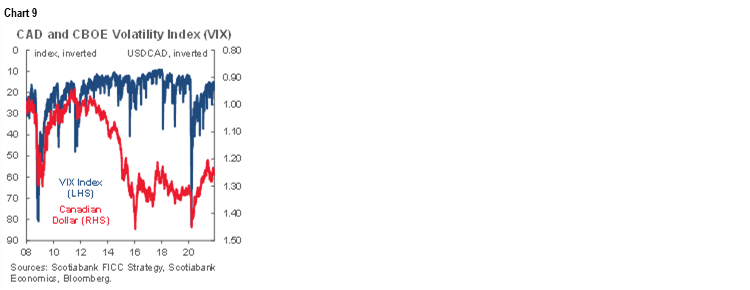
a) The CBOE’s volatility index (VIX) is used as a proxy for market risk sentiment (chart 9). Elevated volatility reflects increased anxiety in markets and in risk-off periods the USD (and US assets such as Treasurys) tends to outperform as investors flock to safety. The VIX is particularly informative in periods of high uncertainty in markets such as the peak of the Covid stress in spring 2020 and around the collapse of Lehman Brothers in 2008.
4) The US effective exchange rate:
a) A broad dollar index (chart 10) is included to adjust for multilateral adjustments in the dollar that represent broad international economic or financial conditions that impact USD demand. Integration in global markets means that the CAD is relatively more sensitive to external rather than intrinsic drivers. If this variable is omitted, an alternative model suggests that the CAD is currently significantly under-valued (suggesting a USDCAD value of around 1.10).
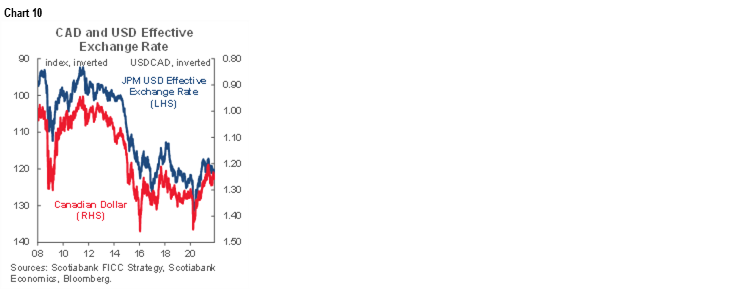
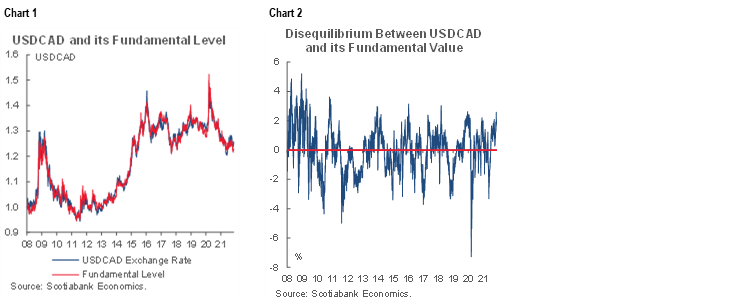
Chart 1 shows the USDCAD fundamental path since 2008 and chart 2 plots the disequilibrium between the USDCAD and its fundamental path. As of November 16, 2021 the Canadian dollar is 2% undervalued relative to the US currency. A 2% deviation is around the level where the exchange rate tends to begin to re-align closer to its fundamental value. Outside of the financial crisis years, we count only eight episodes where the CAD has been undervalued by, or over, 2% and these rarely last more than one month.
2) THE USDCAD DAILY REGIME SWITCHING MODEL
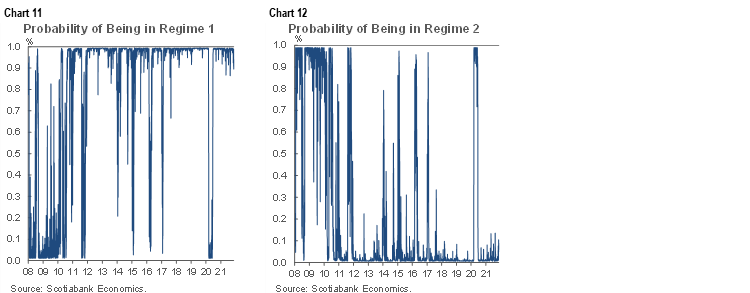
We estimate a regime-switching framework to identify periods in which the exchange rate’s response is driven by risk sentiment vs periods where the Canadian dollar is driven by more intrinsic fundamentals (charts 11 and 12).2 The risk-off periods are more greatly influenced by movements in the broad USD index and the VIX, whereas fundamental periods are driven mostly by oil and interest rates. According to the results, since the 08-09 financial crisis and its aftermath, the USDCAD has generally been in the latter regime, that is less impacted by risk sentiment.
Oil prices and interest rate differentials play a relatively smaller role in short-term variations in the exchange rate in this risk-off regime when compared to the other variables. The CAD’s sensitivity to oil price fluctuations in relation to changes in VIX is between 7 and 8 times larger in the ‘normal’ regime than in the ‘risk-off’ regime and a similar difference applies to the broad dollar index; or, put another way, the VIX’s ‘role’ in relation to oil prices is 7 to 8 times larger in periods of heightened market anxiety when compared to those of more orderly trading. Similar conclusions arise when comparing oil and interest rate differentials to the broad dollar index. Counterintuitively, however, the CAD’s relative sensitivity to metals prices increases under risk-off settings while one would think their influence would weaken alike oil prices; this may just be an estimation anomaly, or metals prices tend to move more closely in line with the VIX and the broad dollar than oil prices during periods of market stress.
Based on Charts 11 and 12 we identify a handful of key periods when the USDCAD traded in the risk-off regime:
1) 2008-2009 Great Financial Crisis: The S&P500 sheds over 55% of its value between October 2007 and March 2009 (with similar losses in crude oil, on net) while the VIX reaches its highest intraday level on record to date. The USD appreciates by close to a third against the CAD but ‘only’ by less than 20% on a broad basis.
- The CAD briefly switched back to the ‘normal’ regime in the first half 2010 before the May flash crash led to increased volatility in markets that kept the CAD somewhat on the defensive despite more favourable rate differentials.
2) 2011 Eurozone Debt Crisis: Market volatility jumped in the latter part of the year and the EUR lost over 10% of its value through the fourth quarter of the year, acting as a weight on the broader currency complex against the dollar. Throughout this period, however, crude oil prices had a $25/barrel roundtrip, with the CAD generally missing out on the rebound.
3) 2015-2016 Stock Market Selloff, and early 2017: Period that included the Chinese stock market crash, the collapse in crude oil prices, another Greek debt scare, the Brexit referendum, and concluding with the 2016 election of Donald Trump and the beginning of his protectionist presidency. Volatility spiked on multiple occasions.
4) Spring 2020 Covid-19 shock. The VIX surged to its highest point since the GFC and Canadian-US rate differentials see-sawed sharply. Some weeks later, front-month US crude oil prices briefly traded below zero. The USDCAD reached its highest level since early-2016.
According to the model, there is a 95% probability that we are currently in the ‘normal time’ regime in which the USDCAD is relatively more affected by oil prices and interest rates differentials than flight to quality towards the US dollar or multilateral adjustments in the currency. Note, however, that market volatility (VIX) has yet to return to pre-Covid levels on a sustainable basis, which suggests ongoing apprehension in markets regarding when the Covid crisis will end.
1 See Appendix 1 for more details on the model generating the fundamental path of the USDCAD.
2 See Appendix 2 for more details on the Regime switching model.
APPENDIX 1: THE USDCAD DAILY FUNDAMENTAL MODEL
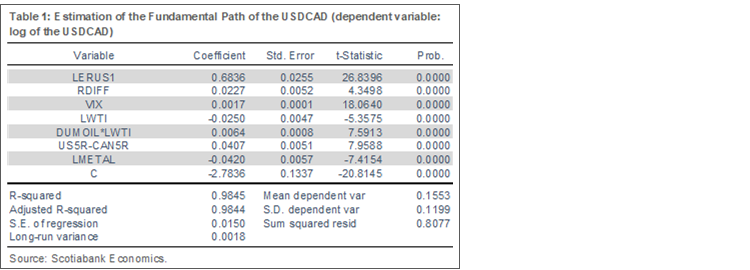
We use a cointegration approach to generate the daily fundamental path of the USDCAD. We tested many determinants of the CAD exchange rate available at the daily frequency. The final specification optimizes the fit of the model (i.e. all regressors are simultaneously statistically significant) and includes JP Morgan’s USD effective exchange rate index, the price of oil, metal prices, 2- and 5-years interest rate differentials and the VIX (see table 1).
Where,
LERUS1: log of the US effective exchange rate.
RDIFF: US/Canada 2 years rates differential (US minus Canada).
VIX: CBOE Volatility Index.
LWTI: log of the price of oil (WTI).
DUMOIL*LWTI: dummy equals to 1 after 2014, LWTI is the log of WTI.
LMETAL: log of Bloomberg’s industrial metals index.
US5R-CAN5R: US/Canada 5 years rates differential (US minus Canada).
C: constant.
APPENDIX 2: THE USDCAD REGIME SWITCHING MODEL
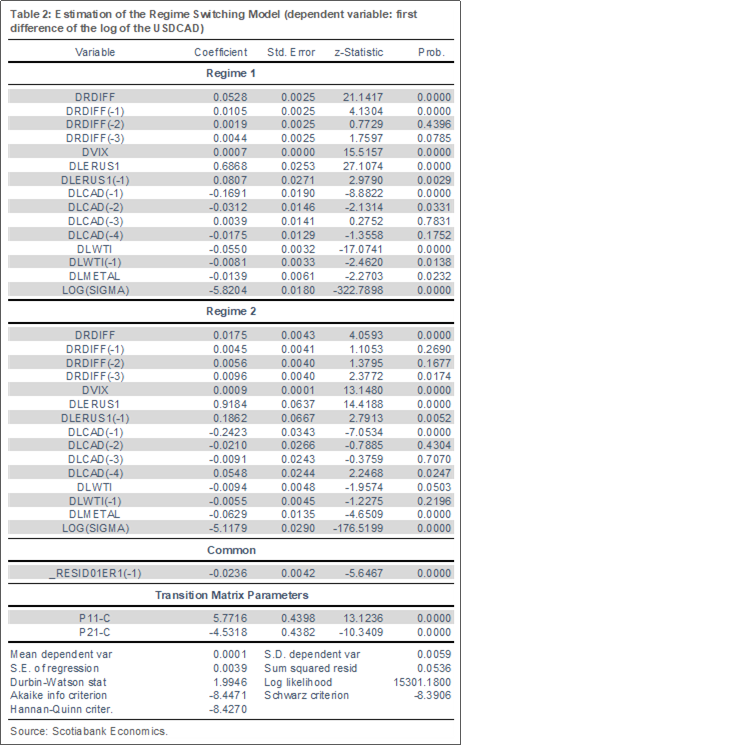
In the Markov Regime Switching Model we allow the USDCAD short-term elasticities to vary across two distinct regimes. Consequently, in the short term, the effect of the price of oil, metals prices, interest rates differentials, the US effective exchange rate, and the VIX on the USDCAD are different across the two regimes identified by the model. According to the results, all the drivers affect the USDCAD in both regimes with the same sign, but the magnitude of their effects differs from Regime 1 to Regime 2. The first regime is relatively more affected by oil prices and interest rate differentials and Regime 2 is relatively more affected by multilateral adjustments of the US dollar and market volatility as captured by the VIX. Note that we assume that the long run elasticities (i.e. the error correction term based on our fundamental path of the USDCAD) are the same across the two regimes.
Where,
DLCAD: first difference of the log of the USDCAD exchange rate.
DRDIFF: first difference of the US/Canada 2 years interest rates differential.
DVIX: first difference of the VIX.
DLERUS1: first difference of the US effective exchange rate.
DLWTI: first difference of the log of WTI.
DLMETAL: first difference of the log of metals prices.
_RESID01ER1: disequilibrium of the log of the USDCAD relative to its fundamental level.
DISCLAIMER
This report has been prepared by Scotiabank Economics as a resource for the clients of Scotiabank. Opinions, estimates and projections contained herein are our own as of the date hereof and are subject to change without notice. The information and opinions contained herein have been compiled or arrived at from sources believed reliable but no representation or warranty, express or implied, is made as to their accuracy or completeness. Neither Scotiabank nor any of its officers, directors, partners, employees or affiliates accepts any liability whatsoever for any direct or consequential loss arising from any use of this report or its contents.
These reports are provided to you for informational purposes only. This report is not, and is not constructed as, an offer to sell or solicitation of any offer to buy any financial instrument, nor shall this report be construed as an opinion as to whether you should enter into any swap or trading strategy involving a swap or any other transaction. The information contained in this report is not intended to be, and does not constitute, a recommendation of a swap or trading strategy involving a swap within the meaning of U.S. Commodity Futures Trading Commission Regulation 23.434 and Appendix A thereto. This material is not intended to be individually tailored to your needs or characteristics and should not be viewed as a “call to action” or suggestion that you enter into a swap or trading strategy involving a swap or any other transaction. Scotiabank may engage in transactions in a manner inconsistent with the views discussed this report and may have positions, or be in the process of acquiring or disposing of positions, referred to in this report.
Scotiabank, its affiliates and any of their respective officers, directors and employees may from time to time take positions in currencies, act as managers, co-managers or underwriters of a public offering or act as principals or agents, deal in, own or act as market makers or advisors, brokers or commercial and/or investment bankers in relation to securities or related derivatives. As a result of these actions, Scotiabank may receive remuneration. All Scotiabank products and services are subject to the terms of applicable agreements and local regulations. Officers, directors and employees of Scotiabank and its affiliates may serve as directors of corporations.
Any securities discussed in this report may not be suitable for all investors. Scotiabank recommends that investors independently evaluate any issuer and security discussed in this report, and consult with any advisors they deem necessary prior to making any investment.
This report and all information, opinions and conclusions contained in it are protected by copyright. This information may not be reproduced without the prior express written consent of Scotiabank.
™ Trademark of The Bank of Nova Scotia. Used under license, where applicable.
Scotiabank, together with “Global Banking and Markets”, is a marketing name for the global corporate and investment banking and capital markets businesses of The Bank of Nova Scotia and certain of its affiliates in the countries where they operate, including; Scotiabank Europe plc; Scotiabank (Ireland) Designated Activity Company; Scotiabank Inverlat S.A., Institución de Banca Múltiple, Grupo Financiero Scotiabank Inverlat, Scotia Inverlat Casa de Bolsa, S.A. de C.V., Grupo Financiero Scotiabank Inverlat, Scotia Inverlat Derivados S.A. de C.V. – all members of the Scotiabank group and authorized users of the Scotiabank mark. The Bank of Nova Scotia is incorporated in Canada with limited liability and is authorised and regulated by the Office of the Superintendent of Financial Institutions Canada. The Bank of Nova Scotia is authorized by the UK Prudential Regulation Authority and is subject to regulation by the UK Financial Conduct Authority and limited regulation by the UK Prudential Regulation Authority. Details about the extent of The Bank of Nova Scotia's regulation by the UK Prudential Regulation Authority are available from us on request. Scotiabank Europe plc is authorized by the UK Prudential Regulation Authority and regulated by the UK Financial Conduct Authority and the UK Prudential Regulation Authority.
Scotiabank Inverlat, S.A., Scotia Inverlat Casa de Bolsa, S.A. de C.V, Grupo Financiero Scotiabank Inverlat, and Scotia Inverlat Derivados, S.A. de C.V., are each authorized and regulated by the Mexican financial authorities.
Not all products and services are offered in all jurisdictions. Services described are available in jurisdictions where permitted by law.