

- The Iran war has led to more than a typical oil shock. Diesel prices have risen well beyond what the move in crude would normally imply, adding a distinct and broader layer of inflation pressure to the latest energy shock.
- Diesel’s reach extends well beyond the pump. As a critical input into trucking, agriculture, construction and manufacturing, higher diesel costs spread through freight, production and distribution networks before ultimately reaching consumer prices.
- We estimate that supply-chain effect empirically. By isolating diesel-price movements that cannot be explained by crude oil and tracing their impact through consumer and producer prices, we find clear evidence that the inflationary effects extend beyond energy in both Canada and the United States.
- The pass-through is gradual—and persistent. Transportation prices respond first, while pressures in food, shelter, and other categories build with a 12-to-18-month lag as higher costs work their way through the supply chain. A longer-lasting shock would increase the risk of broader inflation pressure and a stronger monetary policy response.
- For central banks, persistence is problematic. The Bank of Canada and the Federal Reserve can look through a temporary relative-price shock, but not one that spreads into broader inflation expectations. With the diesel shock adding to an already widening set of upside risks, a sustained move would increase the pressure to raise rates more aggressively.
A BROADER ENERGY SHOCK THAN CRUDE OIL
This is no longer just an oil shock. Following the Iran war, diesel—and, to a lesser extent, gasoline—prices have surged well beyond what the increase in crude oil would normally imply. This reflects challenges in transporting these products through the Middle East, as well as the conflict in Ukraine that shut down some of Russia’s refining capacity. These two events combined led to a crunch in the supply of diesel in the global market and sent prices higher. Chart 1 illustrates the close historical relationship between real refined-product prices and real crude prices, while also showing how far recent movements have departed from that relationship.
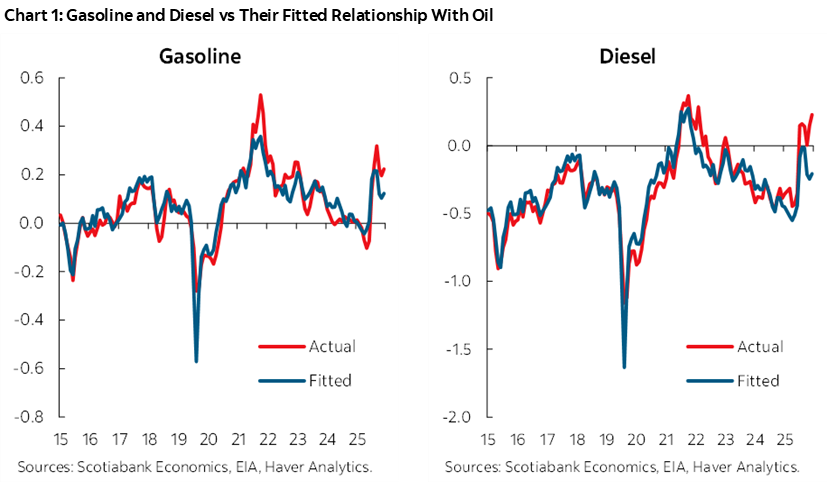
Historically, refined-product prices have moved with crude oil, but usually by less. Higher crude prices were typically accompanied by some compression in product spreads, limiting the incremental pressure on consumers and firms. This episode, however, looks quite different. Chart 2 shows the six-month rolling correlation between changes in WTI prices and changes in refined-product spreads relative to crude oil. Historically, the correlation between crude prices and the diesel-oil spread was negative: when oil prices rose, the spread typically narrowed, meaning that diesel prices increased, but by less than crude oil. This is what we would normally expect, since crude oil is only one input in diesel production. More recently, however, the correlation has flipped and has been strongly positive since the start of the year.
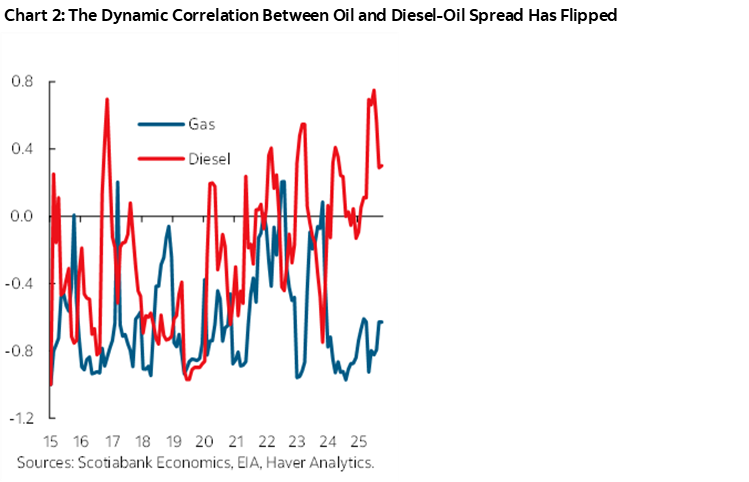
This is another layer of complication of the Iran war as diesel can potentially have a broader impact on prices. It powers trucks, construction equipment, farm machinery and other hard-to-substitute parts of the supply chain. When those costs rise, some of the pressure faced by truckers, farmers and builders can ultimately be passed through to final consumer prices. That is the channel we assess in this note. Specifically, we estimate the impact of this extra layer of pressure by isolating diesel-specific price movements—those not explained by crude oil—and tracing their effects through consumer and producer prices.
The results suggest that diesel amplifies the inflationary impulse in both Canada and the United States. Importantly, the effect is not confined to energy prices. There is evidence of pass-through to broader prices, with the effects appearing gradually in categories such as food and shelter. That timing is consistent with a supply-chain channel: energy costs rise first, production and transportation costs follow, and the final-price impact emerges with a lag.
HETEROGENOUS IMPACT AT THE COMPONENT LEVEL
To assess the impact of diesel prices on broader price pressures, we first need an empirical strategy. Unfortunately, we cannot simply relate CPI measures directly to diesel prices, because diesel often rises alongside crude oil and during periods of strong global demand. A direct relationship would therefore mix the specific effect of diesel with these broader forces. We address this in two steps. First, we estimate how diesel prices typically respond to crude oil prices while also controlling for U.S. economic activity.1 The portion of the diesel-price movement that remains unexplained is our measure of a diesel-specific shock:
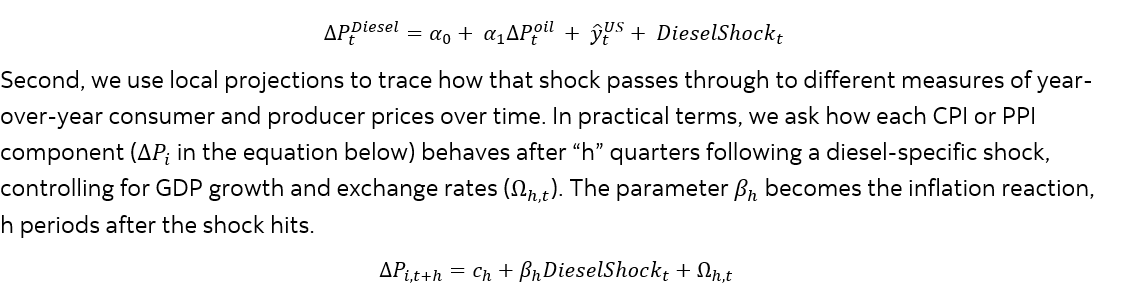
Local projections are well suited for this type of exercise because they allow us to trace the dynamic response of each price component over time without imposing a tightly specified transmission mechanism. They are also highly flexible, allowing us to assess the impact of shocks on a wide range of components, and thus form an empirical view of the supply chain effect.
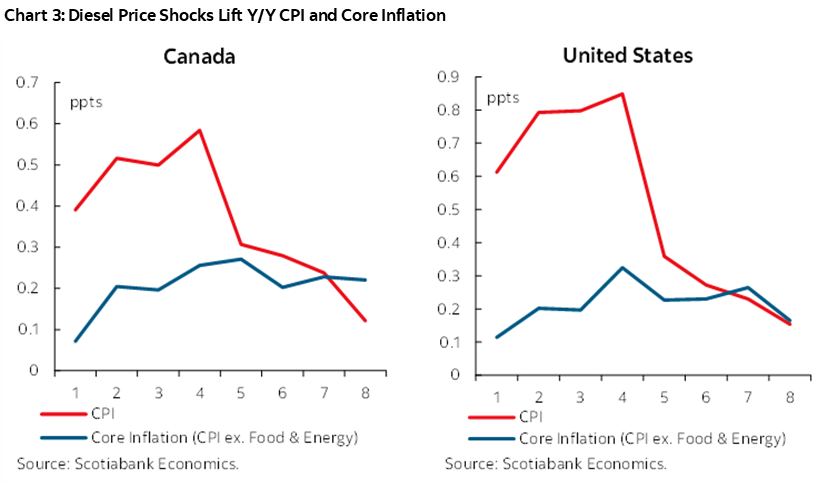
The first result is straightforward: diesel-specific shocks have a statistically positive relationship with year-over-year inflation in both Canada and the United States, with more impact on US CPI. For a temporary increase of about 15% in the diesel spread (close to what we have seen recently), we estimate an effect of 0.6 p.p. on CPI inflation in Canada and 0.8 p.p. in the U.S. (chart 3).2 More interestingly, the pass-through is not limited to headline inflation. We find evidence of a response in underlying inflation measures in both countries, which points to the broader supply-chain effect discussed above. The impact is obviously smaller than for total CPI but it is persistent, and still statistically significant. Put differently, when diesel prices rise independently of crude oil, the impact does not stop at the pump; it leads to broader price pressures later on.
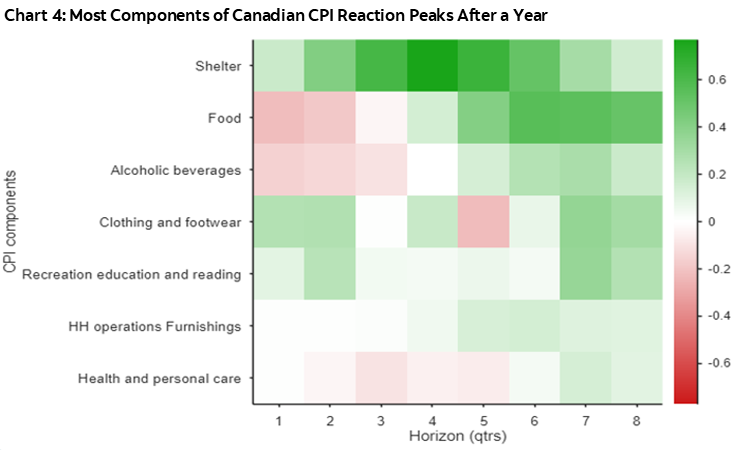
But how does that pass-through actually happen—and where does it show up first? The component-level local projections help answer that question. Chart 4 below shows the response of individual CPI components excluding energy to the same diesel shock. The X axis shows the number of quarters after the shock hits, while the Y axis shows the CPI component. A green response means a positive impact on prices, and red means a negative response. It is interesting to note that shelter and food prices rise, but with an important lag—peaking roughly one year after the shock for shelter and 18 months for food. That delayed response is consistent with higher transportation, heating, and production costs gradually working their way through the supply chain. We also see that food prices and alcoholic beverages tend to decline slightly right after the shock hits. This could reflect a negative demand effect coming from lower purchasing power.
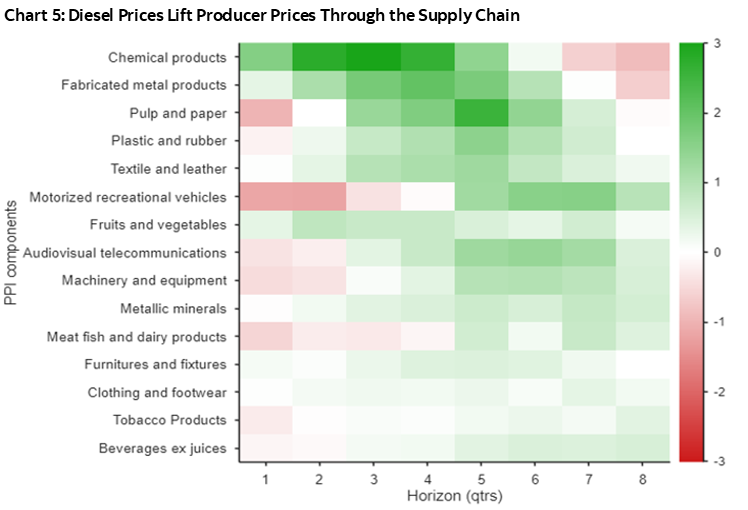
The Canadian producer price data tell a similar story from the production side (chart 5). The direct impact is clearly positive for energy producers, so the chart focuses on PPI excluding energy to isolate the broader supply-chain effect and for better illustration purposes. Chemical products respond relatively quickly, closely tracking the timing of the energy shock itself. Other categories respond with a delay, with more positive effects appearing more than a year later, again reflecting the lag coming from the supply chain effect. Some categories, including meat and motor vehicles, even show a negative response. Again, that may reflect a short-run demand effect: higher energy costs squeeze real purchasing power and can delay purchases, especially for big-ticket items, before the supply-side cost pressure eventually dominates.
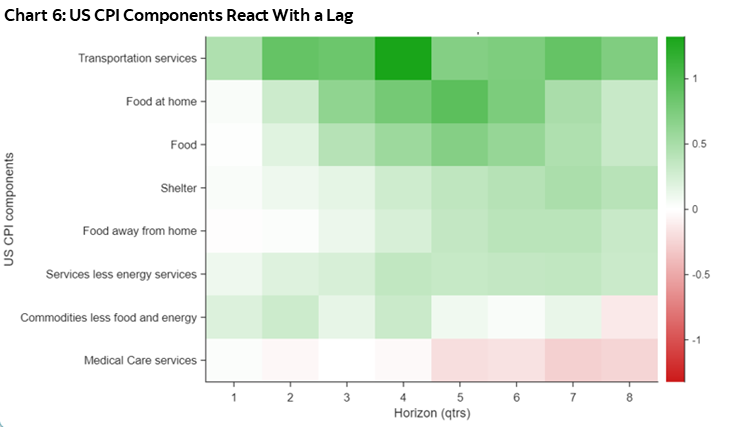
We see a similar pattern in the detailed U.S. CPI data (chart 6). Transportation services see the largest impact outside of energy, with the effect peaking after one year. Similarly to Canada, food prices are positively impacted, with a much more delayed peak impact reached more than one year after the shock hit, reflecting the delays in the transmission through the supply chain.
PERSISTENCE WOULD MAKE IT WORSE
Overall, the evidence points to a clear inflationary impact from diesel-specific shocks. The initial effect is concentrated in energy and transportation, and some of the pressure passes through to prices outside energy, with the broader effects emerging only gradually as higher costs move through the supply chain.3
The important caveat is that our analysis treats the diesel shock as temporary; it does not fully capture what happens when the shock persists or begins to influence expectations. The inflation consequences could be meaningfully larger if firms and households come to expect elevated energy costs to last. Product-price shocks are usually short-lived, so that risk should not be overstated. But the longer the shock endures, the greater the likelihood that firms pass on higher costs more forcefully, inflation expectations become more sensitive and monetary policy is forced to respond more aggressively. We explored a similar mechanism in a previous note on persistent oil shocks and de-anchored expectations. Diesel shocks are no different: if they last long enough, they can become a broader inflation problem.
That is problematic for central banks. The Bank of Canada and the Federal Reserve can look through a temporary relative-price shock, but they will be far less comfortable if the surge in oil prices begins to generate persistent or broad-based price pressures. The additional impulse from diesel makes that task harder: it adds to the risk that inflation spreads beyond energy and increases the pressure to raise rates to keep inflation expectations well anchored. With upside risks beginning to accumulate, this new shock adds fuel to the fire.
1 We control for US economic activity to make sure that diesel prices shock does not capture aggregate demand shocks that would push up inflation on their own.
2 There is a risk that the current shock proves longer lasting than what is underlying the estimates here, but the current diesel futures curve suggests some normalization in the next 12 months. In the last section of this note we discuss the implications of a longer lasting shock.
3 The effect of diesel shocks on economic activity is less clear. We find some evidence of a positive impact in both countries, but the estimate is not statistically different from zero. However, if central banks respond more forcefully to the current shock amid accumulating upside inflation risks, the resulting tightening would weigh on growth.
DISCLAIMER
This report has been prepared by Scotiabank Economics as a resource for the clients of Scotiabank. Opinions, estimates and projections contained herein are our own as of the date hereof and are subject to change without notice. The information and opinions contained herein have been compiled or arrived at from sources believed reliable but no representation or warranty, express or implied, is made as to their accuracy or completeness. Neither Scotiabank nor any of its officers, directors, partners, employees or affiliates accepts any liability whatsoever for any direct or consequential loss arising from any use of this report or its contents.
These reports are provided to you for informational purposes only. This report is not, and is not constructed as, an offer to sell or solicitation of any offer to buy any financial instrument, nor shall this report be construed as an opinion as to whether you should enter into any swap or trading strategy involving a swap or any other transaction. The information contained in this report is not intended to be, and does not constitute, a recommendation of a swap or trading strategy involving a swap within the meaning of U.S. Commodity Futures Trading Commission Regulation 23.434 and Appendix A thereto. This material is not intended to be individually tailored to your needs or characteristics and should not be viewed as a “call to action” or suggestion that you enter into a swap or trading strategy involving a swap or any other transaction. Scotiabank may engage in transactions in a manner inconsistent with the views discussed this report and may have positions, or be in the process of acquiring or disposing of positions, referred to in this report.
Scotiabank, its affiliates and any of their respective officers, directors and employees may from time to time take positions in currencies, act as managers, co-managers or underwriters of a public offering or act as principals or agents, deal in, own or act as market makers or advisors, brokers or commercial and/or investment bankers in relation to securities or related derivatives. As a result of these actions, Scotiabank may receive remuneration. All Scotiabank products and services are subject to the terms of applicable agreements and local regulations. Officers, directors and employees of Scotiabank and its affiliates may serve as directors of corporations.
Any securities discussed in this report may not be suitable for all investors. Scotiabank recommends that investors independently evaluate any issuer and security discussed in this report, and consult with any advisors they deem necessary prior to making any investment.
This report and all information, opinions and conclusions contained in it are protected by copyright. This information may not be reproduced without the prior express written consent of Scotiabank.
™ Trademark of The Bank of Nova Scotia. Used under license, where applicable.
Scotiabank, together with “Global Banking and Markets”, is a marketing name for the global corporate and investment banking and capital markets businesses of The Bank of Nova Scotia and certain of its affiliates in the countries where they operate, including; Scotiabank Europe plc; Scotiabank (Ireland) Designated Activity Company; Scotiabank Inverlat S.A., Institución de Banca Múltiple, Grupo Financiero Scotiabank Inverlat, Scotia Inverlat Casa de Bolsa, S.A. de C.V., Grupo Financiero Scotiabank Inverlat, Scotia Inverlat Derivados S.A. de C.V. – all members of the Scotiabank group and authorized users of the Scotiabank mark. The Bank of Nova Scotia is incorporated in Canada with limited liability and is authorised and regulated by the Office of the Superintendent of Financial Institutions Canada. The Bank of Nova Scotia is authorized by the UK Prudential Regulation Authority and is subject to regulation by the UK Financial Conduct Authority and limited regulation by the UK Prudential Regulation Authority. Details about the extent of The Bank of Nova Scotia's regulation by the UK Prudential Regulation Authority are available from us on request. Scotiabank Europe plc is authorized by the UK Prudential Regulation Authority and regulated by the UK Financial Conduct Authority and the UK Prudential Regulation Authority.
Scotiabank Inverlat, S.A., Scotia Inverlat Casa de Bolsa, S.A. de C.V, Grupo Financiero Scotiabank Inverlat, and Scotia Inverlat Derivados, S.A. de C.V., are each authorized and regulated by the Mexican financial authorities.
Not all products and services are offered in all jurisdictions. Services described are available in jurisdictions where permitted by law.