

CANADA HOUSING MARKET: EXISTING HOME SALES STILL APPEAR ON A RECOVERY PATH, BUT NATIONAL MARKET CONDITIONS REMAIN SOFT
SUMMARY
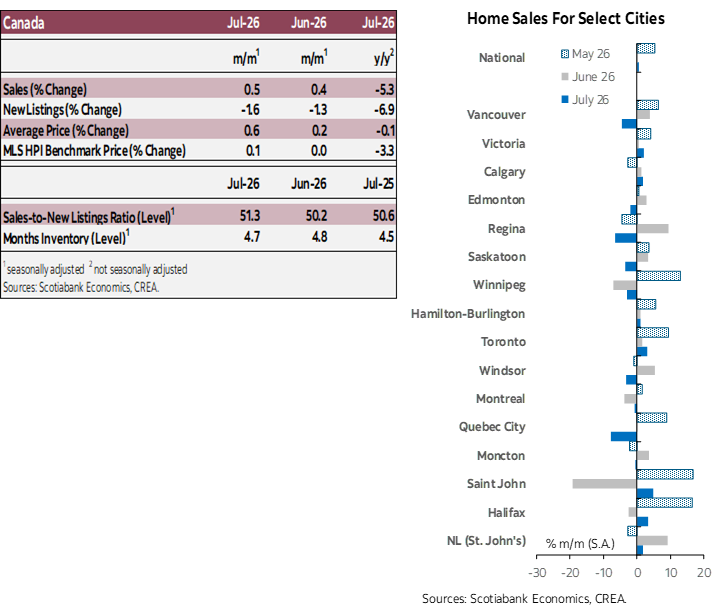
Nationally, housing sales increased in July and new listings continued to decline. Market conditions tightened from June to July according to the sales-to-new listings ratio and months of inventory. The MLS HPI edged up modestly from June to July, its first monthly increase in 20 months.
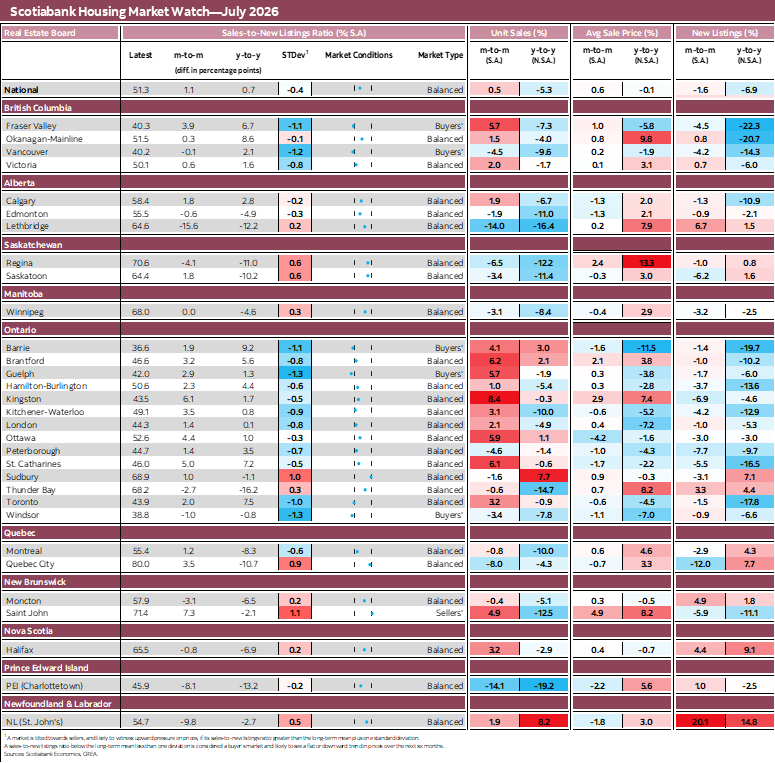
The number of national sales reported by the Canadian Real Estate Association increased by 0.5% (sa) from June to July, a fourth consecutive monthly rise. Over this 4-month period, sales have risen by a cumulative 7.2% (sa), which is equivalent to a 23% annualized pace. Nearly 55% of the local markets we track saw sales rise from June to July, with strongest increases observed in Kingston (8.4%; sa), Brantford (6.2%) and St. Catharines (6.1%). Compared to the same month in 2025, sales fell 5.3% (nsa) in July, with annual declines recorded in 84% of the local markets we monitor, with the largest ones observed in Charlottetown (PEI; -19.2%), Lethbridge (-16.4%) and Thunder Bay (-14.7%).
National new listings declined by 1.6% (sa) from June to July, still on their downward trend that started in summer 2025. In July, new listings were 6.9% (nsa) weaker than their level in the same month of 2025. From July 2025 to July 2026, new listings declined in just above 2/3 of our tracked local markets, with the largest declines observed for Fraser Valley (-22.3%), Okanagan-Mainline (-20.7%) and Barrie (-19.7%).
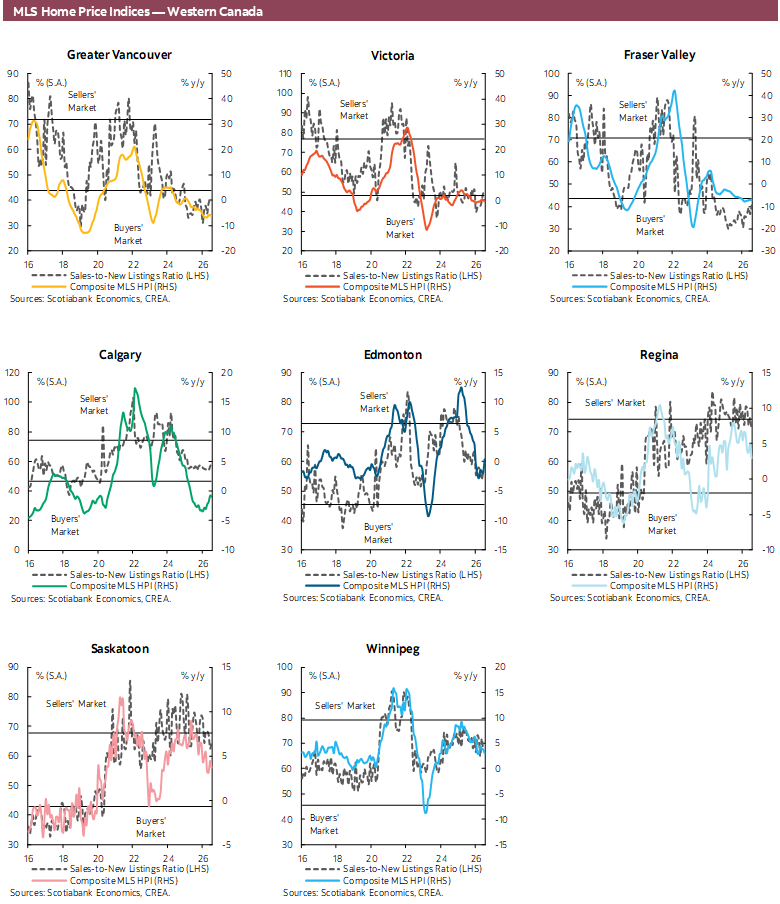
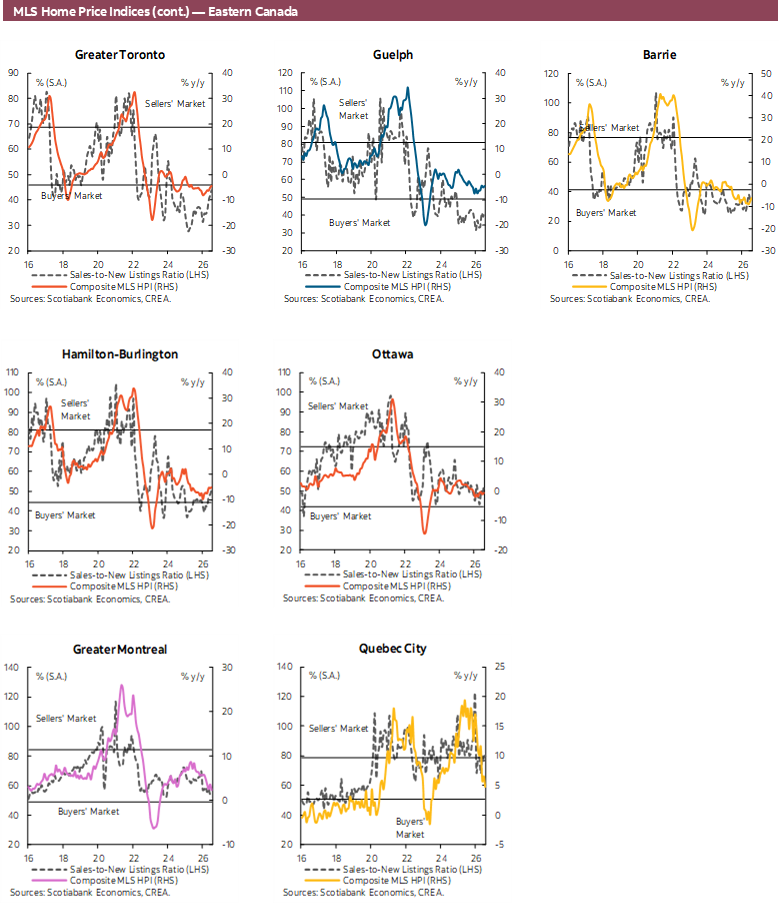
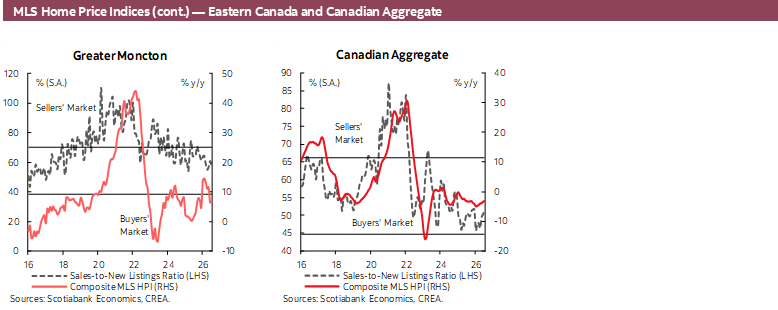
With sales increasing and new listings declining, the national sales-to-new listings was lifted—tightened—from 50.2% in June to 51.3% in July (sa figures), still in the lower half of our estimated range for balanced conditions. Over the 12-month period ending with July, this indicator for the national resale market edged up by 0.7 percentage point (from sa figures) with just over half of the local markets we track also showing a tightening in this indicator. Based on this indicator, 25 of these markets (80.6%) were deemed balanced in July; 5 were estimated as buyers’ favourable and only one (Saint John, N.B.) sellers’ favourable.
Months of inventory mildly tightened nationally from June to July declining from 4.8 to 4.7 months, which is half-a-month below its long-term (pre-pandemic) average. As was the case in several preceding months, this indicator was below its long-term average in all provinces in July, except in British Columbia (+1.1 month) and Ontario (+0.9 month).
After staying flat in June, the national MLS House Price Index (HPI) edged up 0.1% (sa) from June to July, its first noticeable monthly rise since November of 2024. Over this period, increases in this indicator for 1- and 2-storey single units (with respective increases of 0.2% and 0.1%) mildly dominated declines for townhouse and apartment units (-0.2% in each case). In July, the MLS HPI declined by 3.3% (nsa) from its level in the same month of the previous year, with all unit types contributing to this annual decline, and the largest ones observed for apartment (-5.3%) and townhouse units (-4.9%). Compared to its historical high in February 2022, the national MLS HPI was weaker by 20.4% in July (from sa figures).
IMPLICATIONS
The story line for the national housing resale market dynamic in June and July is similar. In both months, sales increased, new listings weakened and the sales-to-new listings ratio edged up but still lies in the lower half of the balanced conditions range. A noticeable difference between these two months is that in July, the MLS HPI posted a monthly increase the first time since November 2024, while it was essentially flat from May to June. It is too soon to conclude that the index has stabilized or will resume an upward trend soon; incoming data will help determine whether July marks the start of a more durable upward trajectory.
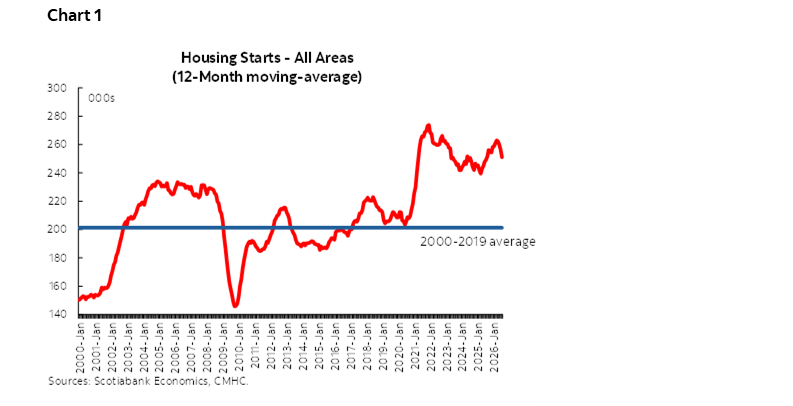
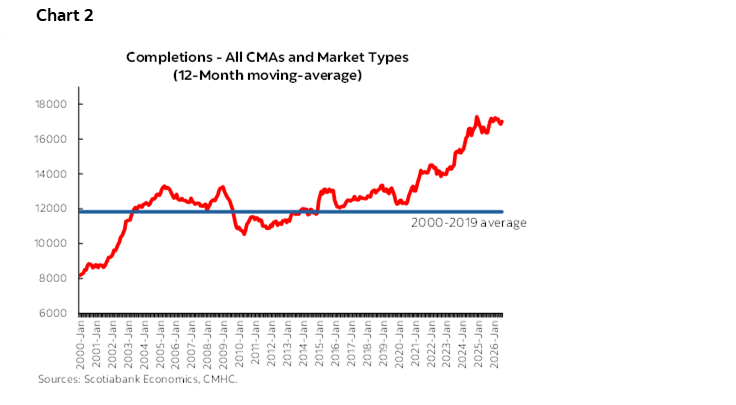
As in previous months, we still assess national housing market conditions as relatively soft due to a combination of weaker-than-normal demand on one hand, largely linked to the ongoing global trade and geopolitical tensions which are weighing on the global and domestic economies, and a relatively firm sustained pace of supply on the other hand. To assess the latter, we also need to account for the dynamics of new housing supply in addition to what is suggested by the sales-to-new listings ratio and months of inventory for the resale market as these indicators only provide a partial view of housing supply. Indeed, housing starts in Canada have significantly exceeded their pre-pandemic pace for over 5 years now (chart 1), which resulted in a significantly higher than average level of new dwellings entering the housing market (chart 2; shown for Census Metropolitan Areas). This additional and material supply of new units contributed to sustained downward pressure on the MLS HPI over the last several years alongside the weak demand cycle. We nevertheless assume that housing demand will strengthen in coming months with improving economic and income conditions, eventually leading to an upward trend in the national MLS HPI.
DISCLAIMER
This report has been prepared by Scotiabank Economics as a resource for the clients of Scotiabank. Opinions, estimates and projections contained herein are our own as of the date hereof and are subject to change without notice. The information and opinions contained herein have been compiled or arrived at from sources believed reliable but no representation or warranty, express or implied, is made as to their accuracy or completeness. Neither Scotiabank nor any of its officers, directors, partners, employees or affiliates accepts any liability whatsoever for any direct or consequential loss arising from any use of this report or its contents.
These reports are provided to you for informational purposes only. This report is not, and is not constructed as, an offer to sell or solicitation of any offer to buy any financial instrument, nor shall this report be construed as an opinion as to whether you should enter into any swap or trading strategy involving a swap or any other transaction. The information contained in this report is not intended to be, and does not constitute, a recommendation of a swap or trading strategy involving a swap within the meaning of U.S. Commodity Futures Trading Commission Regulation 23.434 and Appendix A thereto. This material is not intended to be individually tailored to your needs or characteristics and should not be viewed as a “call to action” or suggestion that you enter into a swap or trading strategy involving a swap or any other transaction. Scotiabank may engage in transactions in a manner inconsistent with the views discussed this report and may have positions, or be in the process of acquiring or disposing of positions, referred to in this report.
Scotiabank, its affiliates and any of their respective officers, directors and employees may from time to time take positions in currencies, act as managers, co-managers or underwriters of a public offering or act as principals or agents, deal in, own or act as market makers or advisors, brokers or commercial and/or investment bankers in relation to securities or related derivatives. As a result of these actions, Scotiabank may receive remuneration. All Scotiabank products and services are subject to the terms of applicable agreements and local regulations. Officers, directors and employees of Scotiabank and its affiliates may serve as directors of corporations.
Any securities discussed in this report may not be suitable for all investors. Scotiabank recommends that investors independently evaluate any issuer and security discussed in this report, and consult with any advisors they deem necessary prior to making any investment.
This report and all information, opinions and conclusions contained in it are protected by copyright. This information may not be reproduced without the prior express written consent of Scotiabank.
™ Trademark of The Bank of Nova Scotia. Used under license, where applicable.
Scotiabank, together with “Global Banking and Markets”, is a marketing name for the global corporate and investment banking and capital markets businesses of The Bank of Nova Scotia and certain of its affiliates in the countries where they operate, including; Scotiabank Europe plc; Scotiabank (Ireland) Designated Activity Company; Scotiabank Inverlat S.A., Institución de Banca Múltiple, Grupo Financiero Scotiabank Inverlat, Scotia Inverlat Casa de Bolsa, S.A. de C.V., Grupo Financiero Scotiabank Inverlat, Scotia Inverlat Derivados S.A. de C.V. – all members of the Scotiabank group and authorized users of the Scotiabank mark. The Bank of Nova Scotia is incorporated in Canada with limited liability and is authorised and regulated by the Office of the Superintendent of Financial Institutions Canada. The Bank of Nova Scotia is authorized by the UK Prudential Regulation Authority and is subject to regulation by the UK Financial Conduct Authority and limited regulation by the UK Prudential Regulation Authority. Details about the extent of The Bank of Nova Scotia's regulation by the UK Prudential Regulation Authority are available from us on request. Scotiabank Europe plc is authorized by the UK Prudential Regulation Authority and regulated by the UK Financial Conduct Authority and the UK Prudential Regulation Authority.
Scotiabank Inverlat, S.A., Scotia Inverlat Casa de Bolsa, S.A. de C.V, Grupo Financiero Scotiabank Inverlat, and Scotia Inverlat Derivados, S.A. de C.V., are each authorized and regulated by the Mexican financial authorities.
Not all products and services are offered in all jurisdictions. Services described are available in jurisdictions where permitted by law.