CANADA HOUSING MARKET: EXISTING HOME SALES INCREASED IN APRIL, BUT TOO SOON TO SHOUT ‘RECOVERY’
SUMMARY
Housing sales increased nationally in April after five months of consecutive declines. But both indicators of market conditions we report suggest still-soft conditions nationally. The MLS HPI for all markets continued to decline in April.
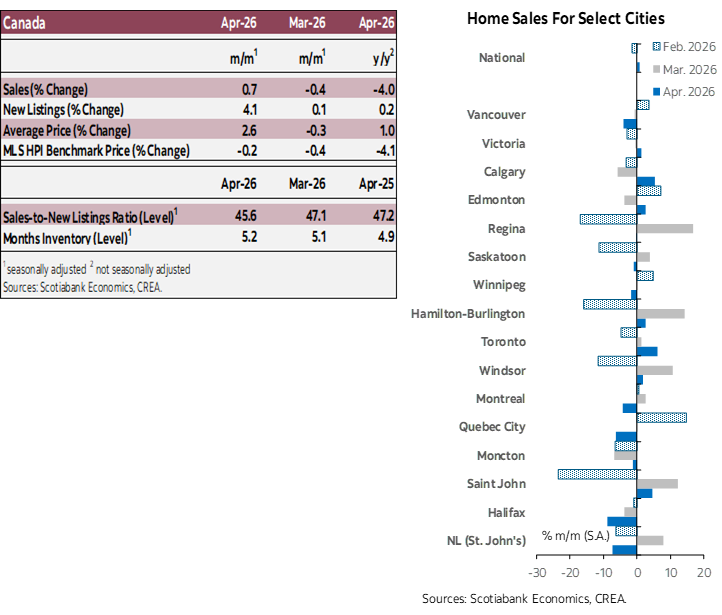
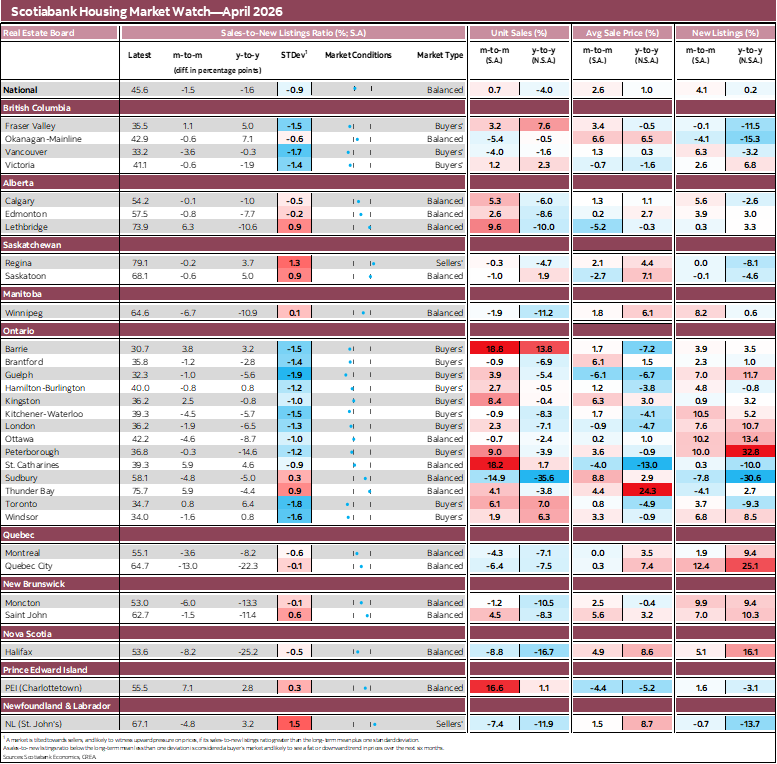
The number of housing sales (in units) increased 0.7% (sa) from March to April, its first monthly rise since October 2025. Sales increased in 17 of the 31 markets we track from March to April, with the strongest increases posted in Barrie (18.8%), St. Catharines (18.2%) and Charlottetown (PEI; 16.6%). National sales declined -4% (nsa) over the 12-month period ending in April 2026.
In April, national new listings posted a 4.1% (sa) monthly increase with above ¾ of the local markets we track contributing to this rise, with at least 10% increases observed for Quebec City (12.4%), Kitchener-Waterloo (10.5%), Ottawa (10.2%) and Peterborough (10%). New listings also edged up 0.2% (nsa) nationally over the 12-month period ending with April.
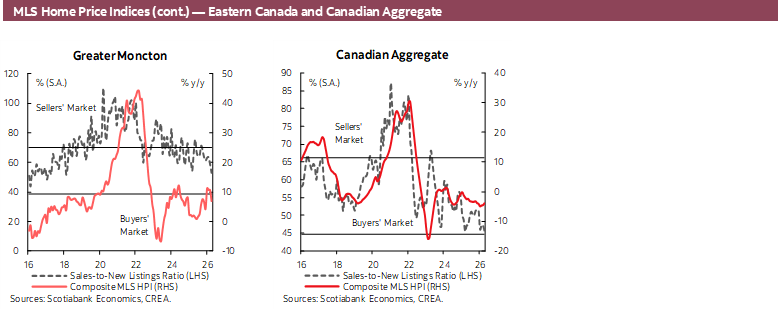
With new listings increasing at a faster pace than sales from March to April, the national sales-to new listings ratio (SNLR) was pushed down to 45.6% (sa). This figure is close to our estimated lower bound for the balanced conditions’ range (estimated at 44.7%), and very close to its lowest print since early 2009, when Canada was in a recession. Nearly ¾ of the monitored local markets have seen their SLNR declined from March to April.
Months of inventory, the other indicator of housing market conditions we track, edged up (eased) from 5.1 in March to 5.2 months in April (sa figures), now exactly at its pre-pandemic long-term average for the national market. As for previous reports, months of inventory were above their long-term average in British Columbia and Ontario (by respectively 2 and 1.9 months), while below average in all other provinces. Largest posted negative differences from their long-term average in April were observed for Newfoundland and Labrador (-5.4 months) and Prince Edward Island (-5 months).
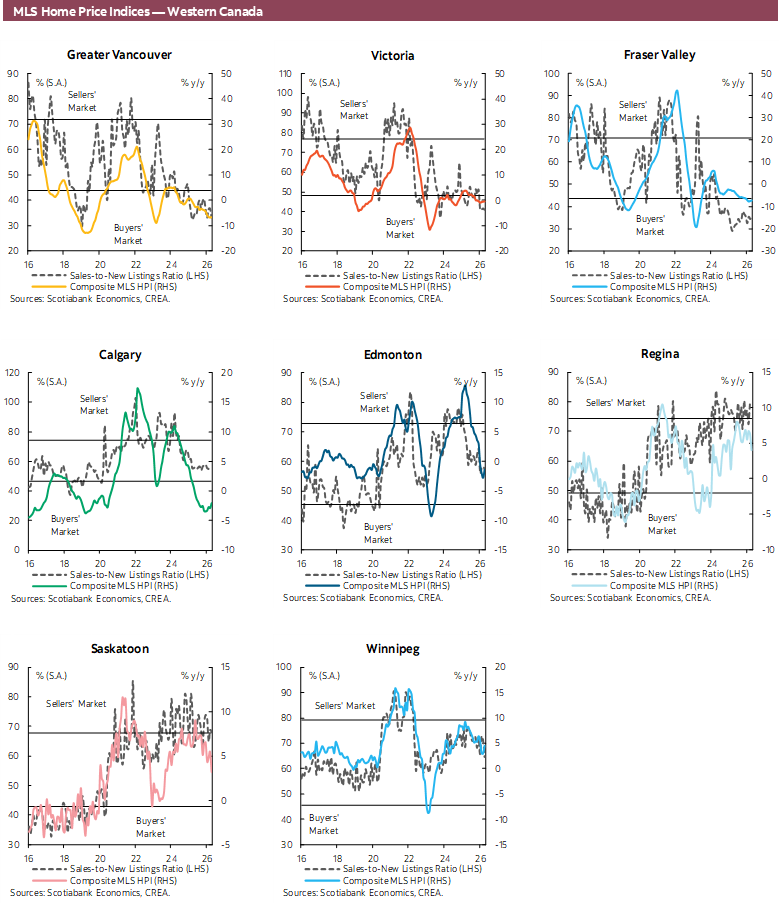
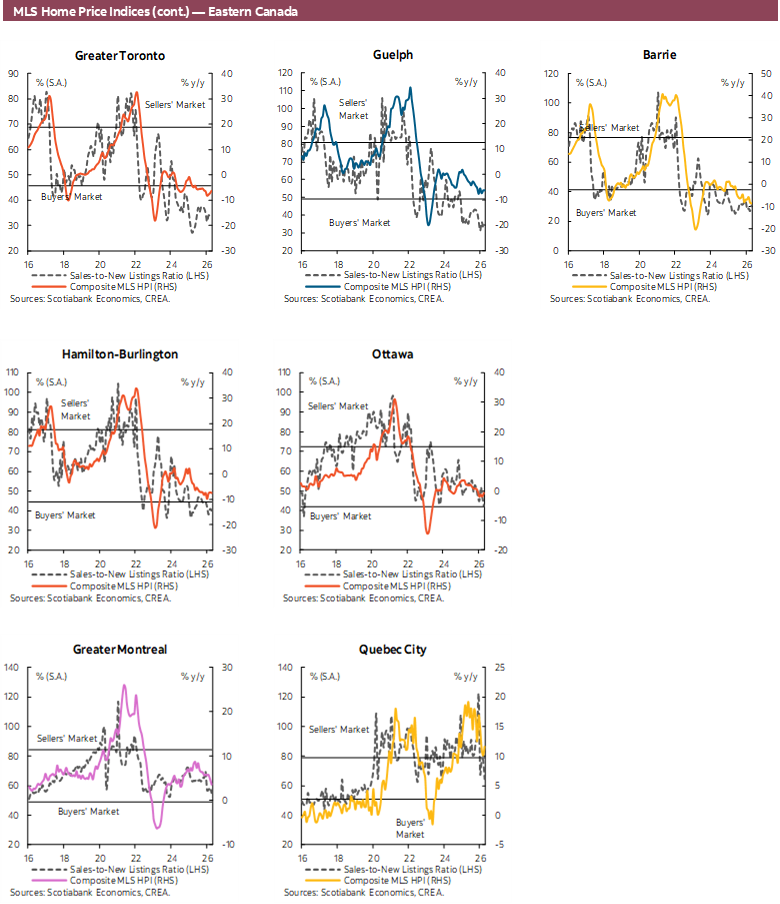
The MLS House Price Index (HPI) continued to decline nationally in April, edging down by -0.2% (sa) from its March level. Over this period, the index for apartments declined by -0.8% but edged up 0.1% for 2-storey units. Over the 12-month period ending in April, the national MLS HPI declined 4.1% (nsa) with, again this month, all unit-types contributing to this annual decline.
This house price index has been on a downward trend since the Bank of Canada started its monetary policy tightening cycle in March 2022, reflecting soft housing market conditions. Over this period, downward pressures on housing demand initially came from the increase in interest rates and the resulting softening in economic and income conditions. These downward pressures were followed by the rise in global trade frictions implemented by the United States since early 2025 and by slower population growth due to tighter immigration policy in Canada. The sharp rise in newly completed but unoccupied units we reported in previous reports also contributed to soften the housing resale market by providing additional options to potential buyers.
IMPLICATIONS
The good news this month is that national housing sales (in units) increased in April, but it is clearly too soon to claim they are on a recovery path. National housing conditions are still soft as reflected by its sales-to-new listings ratio that has been hovering in the lower half of the range for balanced markets conditions for most of the period since March 2022. Moreover, the downward trend in the national MLS HPI since early 2022—which continued in each month so far in 2026—adds support to our call of weak market conditions nationally. We can reasonably say that the national housing market is still too weak to support a sustained rise in house prices, and that housing sales would have been weaker without that trend decline in house prices as reflected by the MLS HPI.
We still expect housing market conditions to start improving sustainably near the end of this year and in 2027 as the headwinds from ongoing trade frictions and recent geopolitical events wane, which will improve confidence and expected income conditions for potential buyers.
DISCLAIMER
This report has been prepared by Scotiabank Economics as a resource for the clients of Scotiabank. Opinions, estimates and projections contained herein are our own as of the date hereof and are subject to change without notice. The information and opinions contained herein have been compiled or arrived at from sources believed reliable but no representation or warranty, express or implied, is made as to their accuracy or completeness. Neither Scotiabank nor any of its officers, directors, partners, employees or affiliates accepts any liability whatsoever for any direct or consequential loss arising from any use of this report or its contents.
These reports are provided to you for informational purposes only. This report is not, and is not constructed as, an offer to sell or solicitation of any offer to buy any financial instrument, nor shall this report be construed as an opinion as to whether you should enter into any swap or trading strategy involving a swap or any other transaction. The information contained in this report is not intended to be, and does not constitute, a recommendation of a swap or trading strategy involving a swap within the meaning of U.S. Commodity Futures Trading Commission Regulation 23.434 and Appendix A thereto. This material is not intended to be individually tailored to your needs or characteristics and should not be viewed as a “call to action” or suggestion that you enter into a swap or trading strategy involving a swap or any other transaction. Scotiabank may engage in transactions in a manner inconsistent with the views discussed this report and may have positions, or be in the process of acquiring or disposing of positions, referred to in this report.
Scotiabank, its affiliates and any of their respective officers, directors and employees may from time to time take positions in currencies, act as managers, co-managers or underwriters of a public offering or act as principals or agents, deal in, own or act as market makers or advisors, brokers or commercial and/or investment bankers in relation to securities or related derivatives. As a result of these actions, Scotiabank may receive remuneration. All Scotiabank products and services are subject to the terms of applicable agreements and local regulations. Officers, directors and employees of Scotiabank and its affiliates may serve as directors of corporations.
Any securities discussed in this report may not be suitable for all investors. Scotiabank recommends that investors independently evaluate any issuer and security discussed in this report, and consult with any advisors they deem necessary prior to making any investment.
This report and all information, opinions and conclusions contained in it are protected by copyright. This information may not be reproduced without the prior express written consent of Scotiabank.
™ Trademark of The Bank of Nova Scotia. Used under license, where applicable.
Scotiabank, together with “Global Banking and Markets”, is a marketing name for the global corporate and investment banking and capital markets businesses of The Bank of Nova Scotia and certain of its affiliates in the countries where they operate, including; Scotiabank Europe plc; Scotiabank (Ireland) Designated Activity Company; Scotiabank Inverlat S.A., Institución de Banca Múltiple, Grupo Financiero Scotiabank Inverlat, Scotia Inverlat Casa de Bolsa, S.A. de C.V., Grupo Financiero Scotiabank Inverlat, Scotia Inverlat Derivados S.A. de C.V. – all members of the Scotiabank group and authorized users of the Scotiabank mark. The Bank of Nova Scotia is incorporated in Canada with limited liability and is authorised and regulated by the Office of the Superintendent of Financial Institutions Canada. The Bank of Nova Scotia is authorized by the UK Prudential Regulation Authority and is subject to regulation by the UK Financial Conduct Authority and limited regulation by the UK Prudential Regulation Authority. Details about the extent of The Bank of Nova Scotia's regulation by the UK Prudential Regulation Authority are available from us on request. Scotiabank Europe plc is authorized by the UK Prudential Regulation Authority and regulated by the UK Financial Conduct Authority and the UK Prudential Regulation Authority.
Scotiabank Inverlat, S.A., Scotia Inverlat Casa de Bolsa, S.A. de C.V, Grupo Financiero Scotiabank Inverlat, and Scotia Inverlat Derivados, S.A. de C.V., are each authorized and regulated by the Mexican financial authorities.
Not all products and services are offered in all jurisdictions. Services described are available in jurisdictions where permitted by law.