Next Week's Risk Dashboard
- Canadian immigration—Facts Vs. Fiction
- Downside risk to Canadian jobs?
- Spin the wheel on US payrolls, wages
- How tight are US credit conditions becoming?
- Will the Bank of England downshift?
- RBA: Hike or Hold?
- A mixed case for the Bank of Thailand
- Brazil could be the next LatAm central bank to ease
- BanRep won’t
- Global earnings pose elevated market risk
- Global macro reports
Chart of the Week
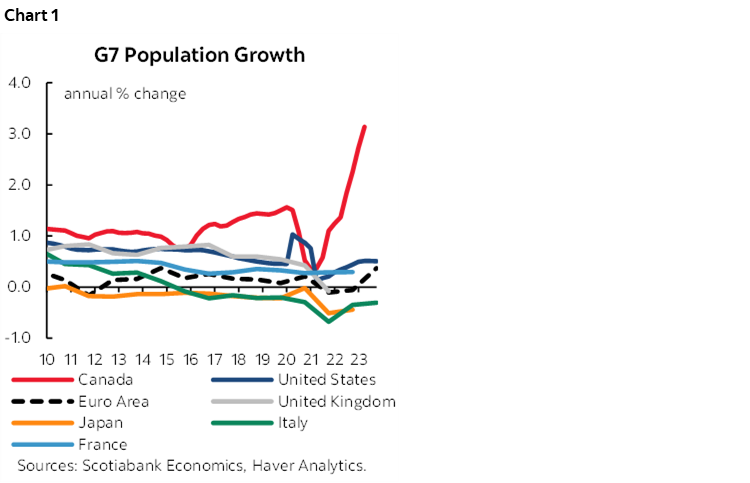
Countries around the world are monitoring the Canadian immigration experiment with a keen eye on how it evolves with implications for labour markets, growth, monetary policy and financial markets. After all, Canada is registering world-beating population growth (chart 1). It’s a bold experiment designed to attract the best and brightest and address labour shortages. If the experiment succeeds, then perhaps it will raise competition for global talent as other countries seek to emulate its approach. If it does not, then it could serve as a caution to governments elsewhere or it may result in adjusting efforts to drive more successful outcomes.
The evidence may turn out to be more positive in future, but at least to this point the narrative that immigration is driving jobs and GDP is more hype based upon spurious correlations than substance.
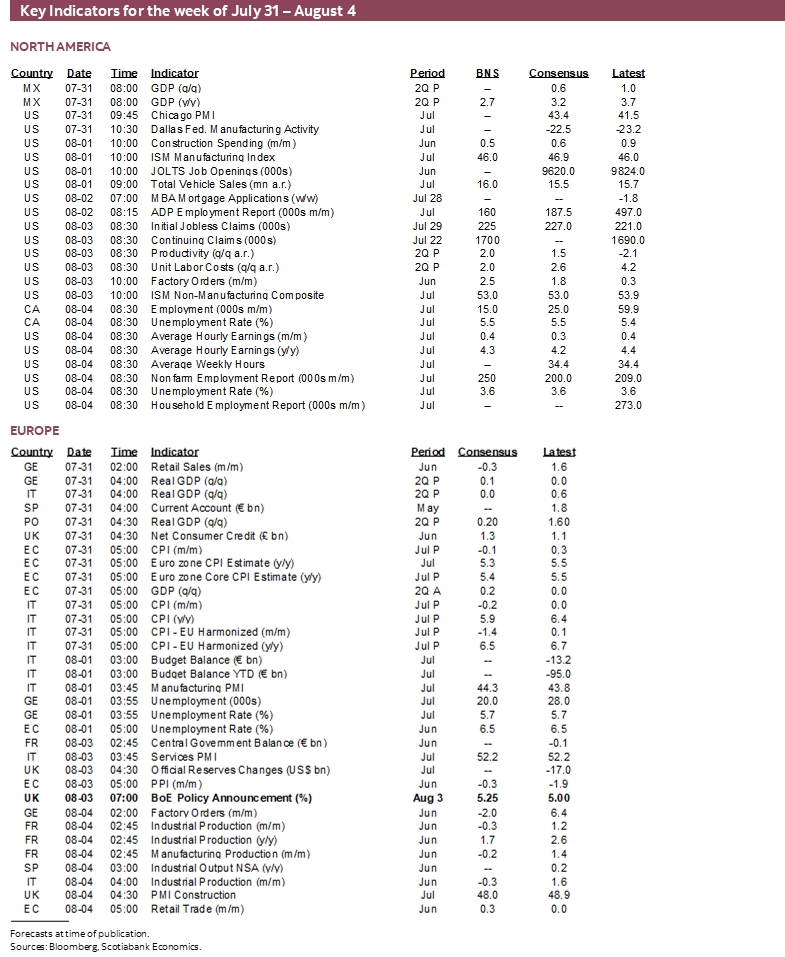
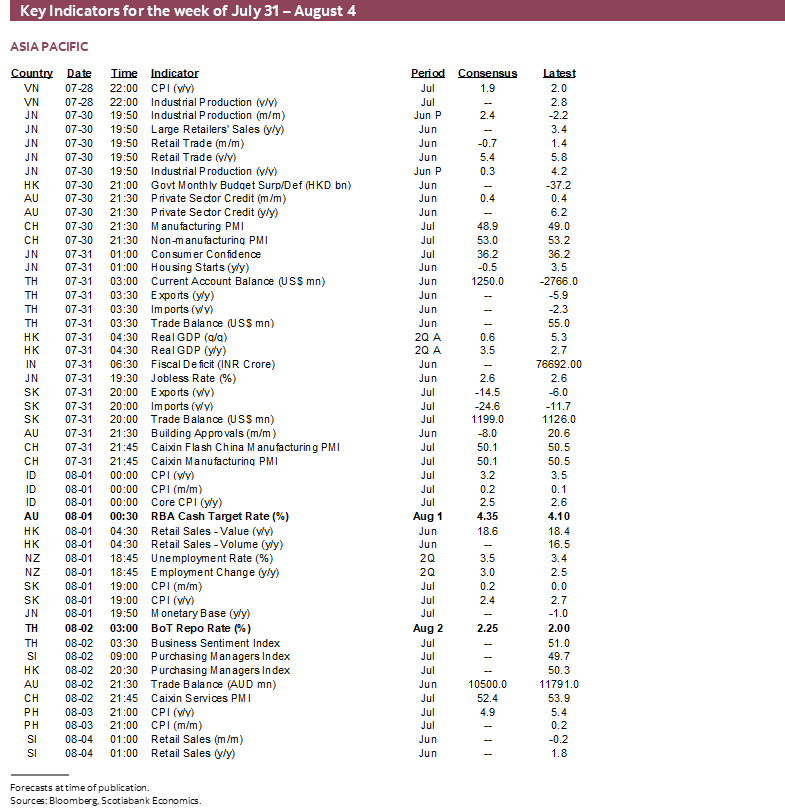
Enter the week’s primary focus upon job market readings out of the US, Canada and New Zealand, with other key focal points including a wave of key global earnings reports plus several central bank decisions. Some central banks are expected to hike by an uncertain amount (BoE), some might hike or hold (RBA, BoT), some may cut (Brazil) and some will stay put (BanRep). The saving grace to this week’s developments is that markets then enter the dog days of August as central bankers and market participants cram in vacations.
CANADIAN JOBS AND WAGES—WHO’S FILLING ALL OF THOSE JOBS?
Canada updates employment and wage figures for July on Friday. It will be one of two labour market updates before the Bank of Canada’s next policy decision on September 6th. I’ve gone with another gain of 15k but not for reasons that have become commonly offered within consensus.
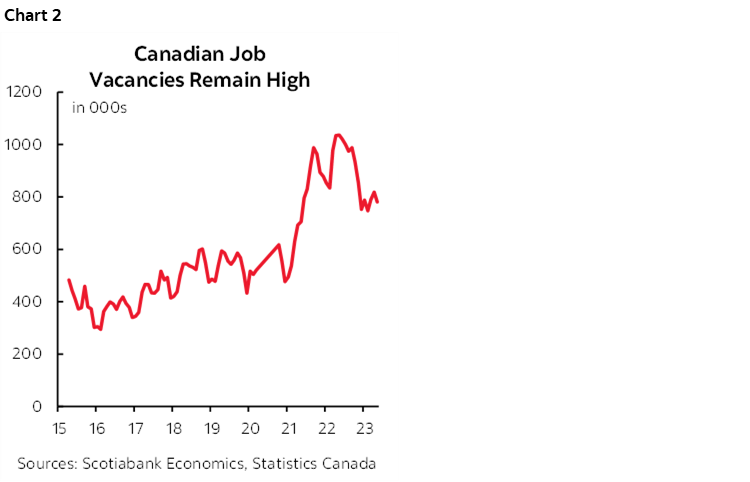
There still exists a high number of job vacancies (chart 2) in a resilient economy and they are likely to continue to be filled on a trend basis. The large prior gain that was significantly due to the reversal of prior temporary hits may be tough to repeat particularly as shocks such as the strike at BC ports rippled through the economy.
The question at hand, however, is who’s filling them and it’s not who you may have come to believe. With the world watching the great Canadian immigration experiment, it is vital to look at the facts.
A popular theory is that Canada’s jobs juggernaut has been driven by a surge of immigration over 2022–23. After all, population, employment, and GDP have all gone up and so therefore population’s large 1.05 million rise last year and this year’s ongoing gains must have driven the other two series in a cause-and-effect sense, right?
Data from Statistics Canada does not support this view. In fact, it strongly suggests that the correlations are spurious in nature.
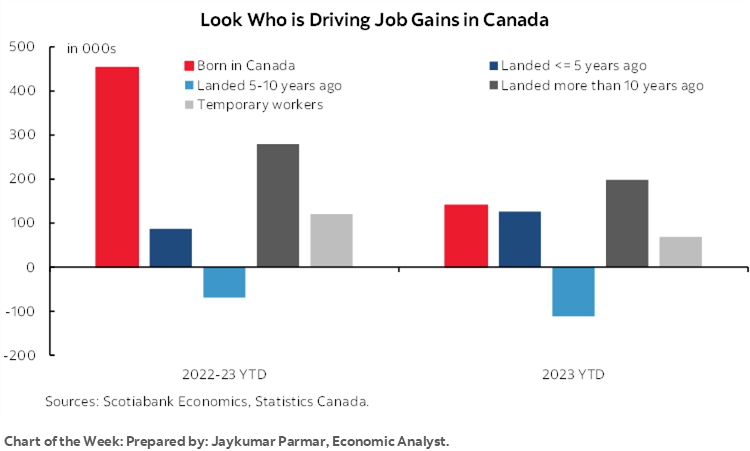
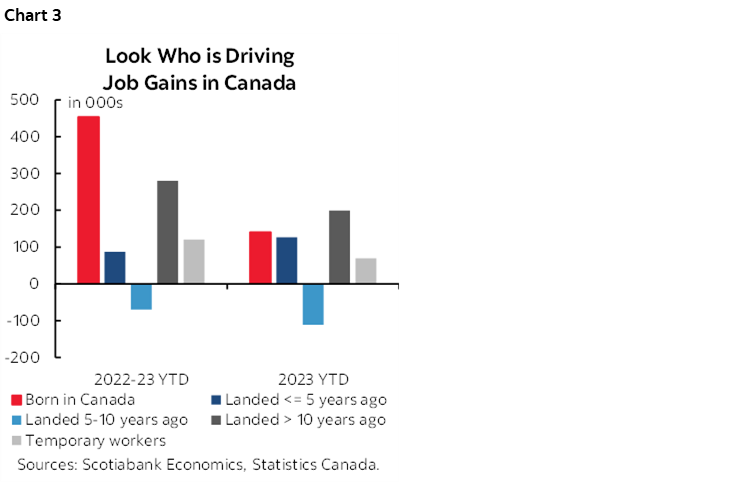
Enter chart 3 using data behind this Statistics Canada link. Since the end of 2021 through to June 2023—the period over which the implementation of more aggressive immigration policies changed markedly—84% of all employment gains in Canada have gone either to those born in Canada (52%) or to longstanding landed immigrants (aka permanent residents) who have been here for 10 or more years (32%). About 14% of total employment growth over this period went to temporary residents. The remaining 2% of employment gains was split between landed immigrants who have been in Canada for under 5 years (10%) and a loss of jobs for landed immigrants in Canada who have been here for between 5–10 years (-8%).
Unfortunately, the data doesn’t break down the recently landed immigrant category to a finer degree than five years and under. While it’s theoretically possible that folks who became landed immigrants over the past 1–2 years may account for all of this 10% share of total employment gains, it’s more likely that they account for a single digit share of total job growth over all of 2022–23ytd.
What about more recent trends, say, focused upon just 2023? Here the data gets a little more mixed but arrives at the same broad conclusion. 80% of all job growth year-to-date in 2023 has been driven by folks born in Canada (33%) or landed immigrants who have been here for 10+ years (47%). Landed immigrants who have been here for <= 5 years have accounted for a larger share of employment gains this year (30%) versus the 2022–2023ytd period (10%), but with two big caveats. First is that we can’t tell how many of these folks became landed immigrants very recently during which most of the immigration surge occurred, versus five years ago, but it’s reasonable to assume that some fraction of this 30% share arrived only recently. Second, the gains by the <=5 year landed immigrant category or employment have been offset by job losses for landed immigrants 5–10 years ago. Also note that temporary foreign workers have accounted for a stable 16% of employment growth this year versus 14% for all of 2022 and 2023 to date.
Regardless, the 2023-to-date story arrives at the similar conclusion that the vast majority of employment gains have not gone to recent immigrants. I can offer several potential implications.
- A key implication is that if employment growth is not being driven by fresh arrivals and their conversion to landed immigrant status, then by extension the diversified drivers of overall economic growth are probably not being driven by fresh arrivals. This stands in stark contrast to the popular understanding of what’s going on in the Canadian economy and labour force.
- A second key implication is that we need to be careful when evaluating the possible implications for labour supply, employment and wage growth. Surging immigration may be adding to labour supply, but not so much to employment. Yet. That could happen over time and immigration has always been an important and welcome source of strength in the Canadian economy and general society.
- A third key implication is that if a surge of immigration may take years to absorb in full employment, then it could offer a highly beneficial longer-run effect for GDP growth on a very slow fuse. Just not as soon as one might be thinking.
- A fourth key implication is that perhaps immigration should not be blamed for poor Canadian productivity growth. If recent arrivals are not the ones securing most of the jobs, then by definition it’s not their output per hour worked that may be dragging down overall productivity. For that, it seems, we need to look at the output per hour of folks who have been born in the country or residing within it for many years. One of the very likely causes for that is the shamefully low investment rate in this country.
- A fifth key implication is that if immigration is not driving the employment gains, then perhaps we shouldn’t count upon it to keep employment growth going for as long as high immigration targets are maintained. We need to pay more attention to the drivers of employment in other categories including questions like how much higher can the participation rate go for those born in Canada and for long time landed immigrants.
- A sixth key implication is that this evidence leans toward taking a flexible, dynamic approach to immigration policy lest unhealthy imbalances arise.
- A seventh implication is that in order for a sustained, buoyant outlook for new home construction to be delivered to maximum effect including the average value-added to the different types of housing that may be built, then Canada had better find a way of securing employment for new arrivals. Fast.
- An eighth key implication involves asking why all of this has been the case. We know that Canada has long been challenged to successfully integrate new arrivals to their fullest potential and this note won’t re-hash possible reasons for this versus, say, a piece I wrote two decades ago on barriers to new arrivals and the new to leverage Canada’s diversity advantage more effectively to drive growth in the 21st Century. At the margin, however, perhaps part of the challenge may be the forms of immigration being sought which is the next focus.
Landed immigrant employment by education status has seen most of the job growth among those with a university degree followed by those with a post-secondary certificate or diploma and with little employment growth for those with lower levels of formal education (here). That’s wonderful to the economy in many ways, but a dynamic labour force needs a variety of individuals with all manner of backgrounds. I’m partial to university education having done three degrees and a professional designation many years ago now. I’m also fully aware that you wouldn’t want me to wire your new home, to brick it, to install all the plumbing, to run a drill press, to drive a combine, to fix your car, to work deep in a mine shaft, to work on an ocean-based oil platform, or to do countless other occupations in fields that are struggling to find workers and that may or may not be filled by the types of workers Canada is seeking to attract.
You might also be thinking there may be a natural hemispheric focus to Canadian employment by country source of immigration that is somewhat like the US. After all, Canada operates within a continental and hemispheric block for trade in goods, services and capital, so why not labour? Not so. There have been fewer jobs this year for landed immigrants from the US and Mexico, the rest of Latin America and Europe. Landed immigrants from Asia and Africa have seen all of the gains (here).
The point to this evidence is that we need to understand the nature of employment gains in order to have a better understanding of how the labour market is changing, how immigration may or may not be impacting the pool of employed individuals, and how Canada’s immigration programs are achieving success or whether there is room for improvement.
It’s also key to the outlook for the Bank of Canada. If Canada is seeing a surge of immigration that is expanding the labour supply and being readily absorbed in employment markets, then this could lift potential GDP growth in disinflationary fashion and perhaps while restraining wage pressures. If, instead, the employment market is tightening because it is drawing in more born in Canada workers and landed immigrants who have been in the country for many years while putting in a disappointing performance on integrating new arrivals, then that’s something that should matter very much so to the Bank of Canada and in the opposite direction to the hypothetical consequences.
US NONFARM AND WAGES—IT’S MORE ABOUT THE CLEANUP
Federal Reserve Chair Powell made it very clear that the FOMC is extremely data dependent as it plots the long path ahead toward the next decision on September 20th. This week will kickstart the top shelf readings that will help to inform these next steps and with a series of releases focused upon the health of the US labour market.
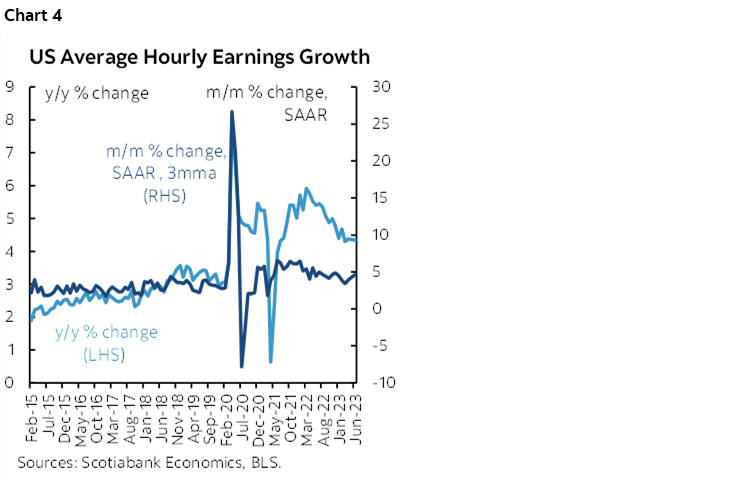
Key will be Friday’s nonfarm payrolls report and wages for the month of July. I’ve gone with a guesstimated gain of 250k and an unchanged unemployment rate of 3.6% with wage growth pegged at another 0.4% m/m SA nonannualized gain. That should keep trend wage growth running at a healthy clip that is expected to remain above the rate of inflation and drive real wage gains (chart 4).
At the time of writing, consensus is a little more pessimistic, but not terribly so especially considering the ginormous +/-120k 90% confidence band around payroll changes. The median consensus estimate is for a gain of 200k with estimates ranging from 150k to 270k. The anyone’s guess reflected in the so-called Bloomberg whisper number is for a gain of 188k.
I’m usually of the mindset that focuses more upon the clean-up in terms of implications to be drawn once we see the numbers, rather than trying to fake precision over the magnitude of the change. That said, the longstanding bias has been for consensus to underestimate payroll gains, except for last month.
Advance indicators are of little help, and many of them are as yet unavailable until this coming week. We know that initial jobless claims fell by about 30k or so between nonfarm reference periods in July over June. We also know that consumers signalled that more jobs were available in July, given that the Conference Board’s ‘jobs plentiful’ gauge edged higher. Missing so far are measures like NFIB small business hiring plans for July, JOLTS job vacancies for June, ADP private payrolls for July, Challenger and Gray layoffs during July, and employment measures within ISM-services and ISM-manufacturing.
All that said, these various measures weren’t terribly helpful the prior month. They collectively signalled strong upside risk to nonfarm payrolls that then landed at a not too shabby 209k. Watch for possible revisions.
CENTRAL BANKS—HIKES, HOLDS AND CUTS
Five central banks will deliver policy decisions over this coming week. They will probably have more of an effect on local markets than global markets relative to the effects of decisions by the Fed, ECB and the Bank of Japan’s recent relaxation of its yield curve control. That’s not assured, however, given the outsize influence of past decisions by central banks like the RBA and BoC that have been taken by markets to be indicative of a global central bank bias toward further tightening. The focus early in the week will be more skewed toward evidence on US credit conditions.
The Fed’s Credit Survey
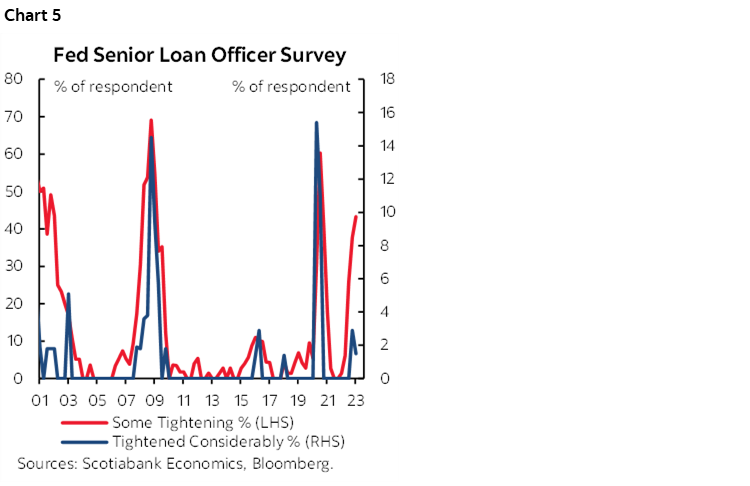
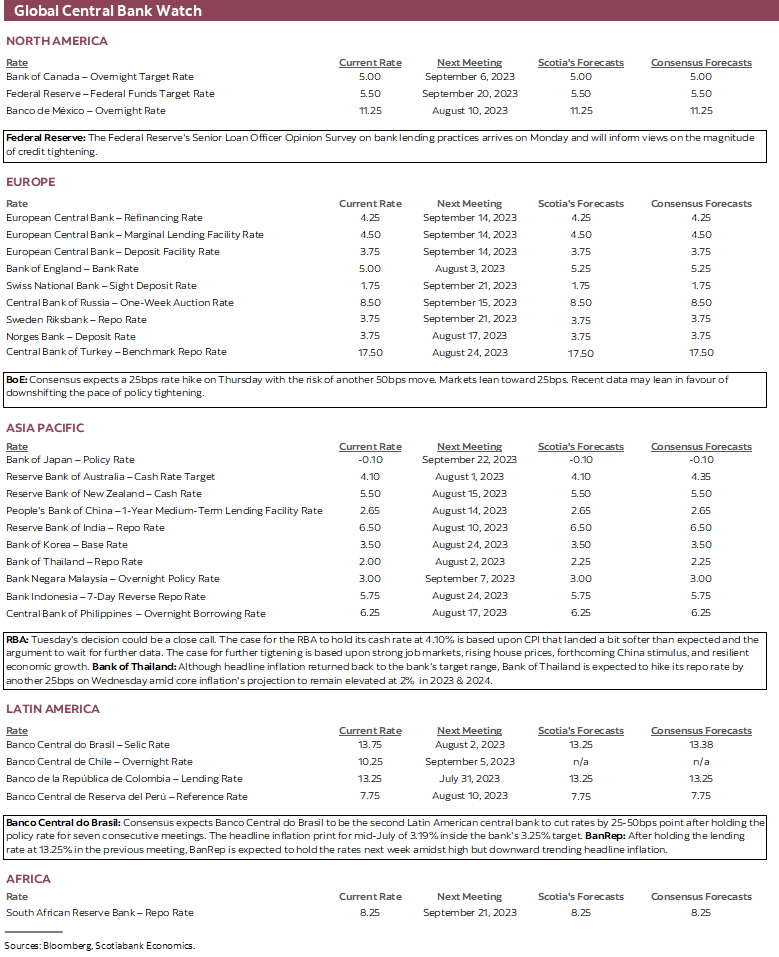
The Federal Reserve’s Senior Loan Officer Opinion Survey on bank lending practices will kick off the week when July’s quarterly report arrives on Monday. The prior edition showed modest evidence of tightening loan standards (chart 5). This one will offer a fresher but still inadequately lagging take given a sample period over the back half of June. Still, the prior survey’s sample period covered late March until early April and may have been too soon to evaluate the impact of the pressures across US regional banks and some European banks during March and over subsequent months. Much of that worry has since stabilized. The FOMC has cautioned that it expects tightening credit standards to weigh on growth going forward, although the opposite could be said by pointing to other measures such as equity markets.
Bank of England—Recent Data Leans Toward Downshifting
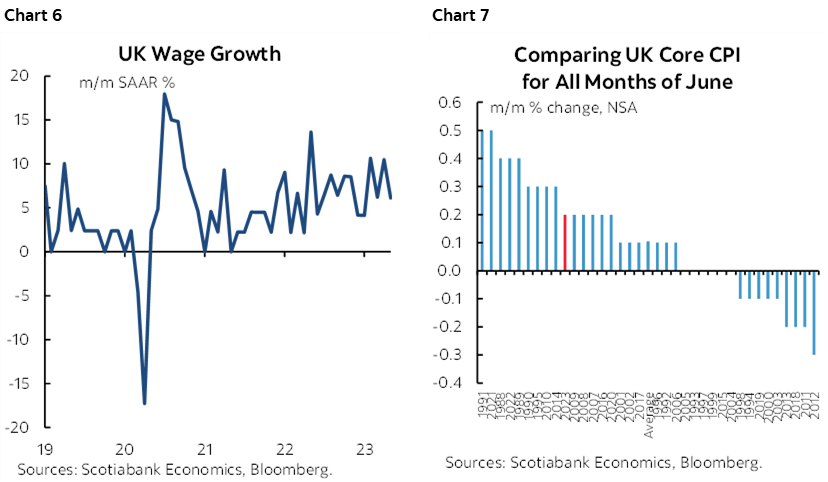
Thursday’s decision is expected to bring out a 25bps hike with 50bps risk. Three quarters of forecasters expect a 25bps hike while the remainder expects 50. Markets are fully priced for 25bps and a little more. There may be only minority appetite for following up June’s 50bps hike with another one of the same size. For one thing, though lagging, May’s total employment figures posted a 36k m/m drop and fresher payroll figures showed a modest 9k drop in June. Wage growth has nevertheless held firm at 7.3% y/y and the trend gains in month-over-month wage hikes has remained elevated (chart 6). Also key is the MPC’s assessment of recent evidence on inflation. The pattern this year has been to register hotter than seasonally normal gains in core CPI inflation compared to like months in history. While that continued in the latest readings for June, the overshoot of seasonal norms was nowhere nearly as large as in several other months (chart 7).
Reserve Bank of Australia—Should I Hike or Should I Hold Now
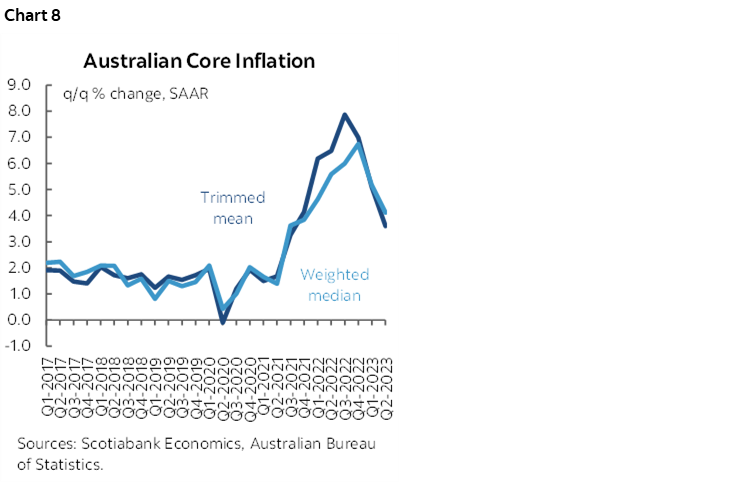
Tuesday’s decision will be a close call. If they hike there will be trouble, if they don’t there may be double. Just over half of consensus thinks that the RBA will hike by another 25bps while just under half think it will hold. Markets are less convinced that another hike may be delivered with only a small probability of a 25bps move priced in. What dampened market conviction that another hike may be delivered was the fact that Q2 CPI was weaker than expected and compared to the recent trend in terms of headline and core measures like trimmed mean and weighted median CPI (chart 8). What could instead favour further tightening is still resilient economic growth, four consecutive months of rising house prices, movement by China to add modest stimulus to its economy, still elevated coal prices and ongoing job growth.
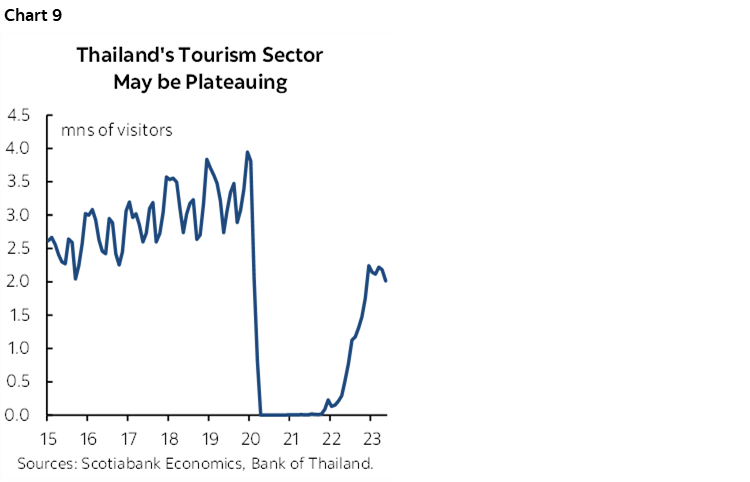
Bank of Thailand—A Mixed Case for Hiking
Another 25bps hike is expected from the BoT on Wednesday. Despite recently soft inflation, the BoT expects higher inflation to be coming. Among the key growth drivers is evidence that the recovery in tourism may be stabilizing at levels of activity below pre-pandemic norms (chart 9).
Banco Central do Brasil—Adding to the LatAm Experiment
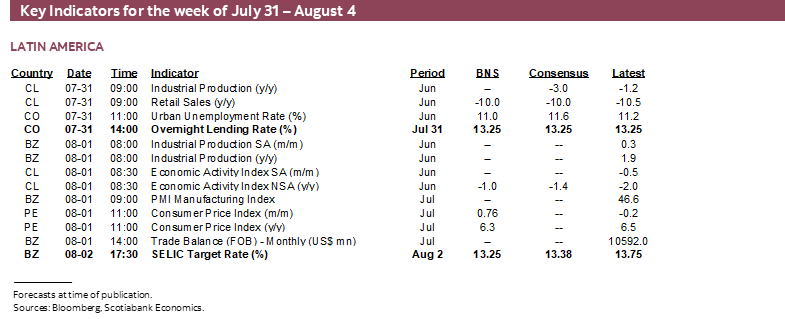
Latin American central banks were among the first to tighten and aggressively so. They are emerging to be among the first to ease. We saw that this past week when Chile’s central bank cut by a large-than-expected 100bps. LatAm central banks have a long history of periods marked by high and volatile inflation and so the region may serve as an experiment for central bankers to watch elsewhere.
Next to cut could be Brazil’s central bank. Most within consensus expect the Selic rate to be cut by 25–50bps on Wednesday. Inflation fell back to 3.2% y/y in June brought it in line with the 3 ¼% inflation target. This isn’t just due to year-ago base effects either, as this June’s small month-over-month dip was among the weakest months of June on record.
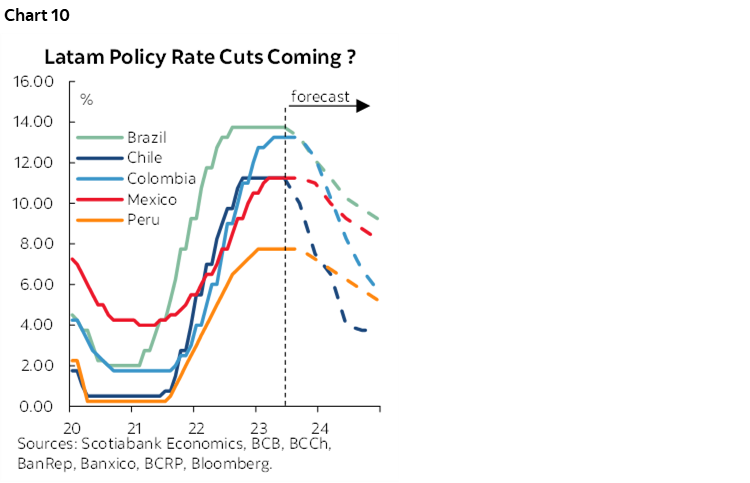
Banco Central de la Republica de Colombia—Inflation Remains Too High
BanRep is universally expected to remain on hold at 13.25% on Monday. Core inflation continued to run at an 11.6% y/y rate in June and so guidance toward policy easing is unlikely at this point. We expect BanRep to move toward an easing bias late this year into next year and join a regional easing bias (chart 10).
GLOBAL MACRO—EARNINGS TO DOMINATE
A smattering of other global macroeconomic reports will probably be overshadowed by global earnings reports.
Canada will primarily focus upon Friday’s labour market readings, but earnings will also factor into the market picture. Seventy-six TSX-listed firms will release earnings reports including names like Shopify, BCE, SNC-Lavalin, Bombardier, Magna, and several utilities. Banks report toward the end of the month.
In addition to nonfarm payrolls and wages, the US calendar will face high earnings risk. A total of 165 S&P500 firms will release earnings estimates and guidance including key names like Apple’s hefty weight in the index, plus Amazon, Lowes, Caterpillar, Merck, Pfizer, Starbucks, and Moderna.
US macro data will be mainly focused upon several job market readings throughout the week in the lead-up to nonfarm payrolls, but a few other readings will include ISM-manufacturing (Tuesday) and ISM-services (Thursday). Q2 labour productivity could jump by about 2% q/q SAAR on Thursday as a partial mitigation of the effects of rising employment costs that should net out to a gain in unit labour costs of about 2% q/q SAAR. Tuesday’s vehicle sales during July could rise toward 16 million at an annualized rate for a 2% m/m increase.
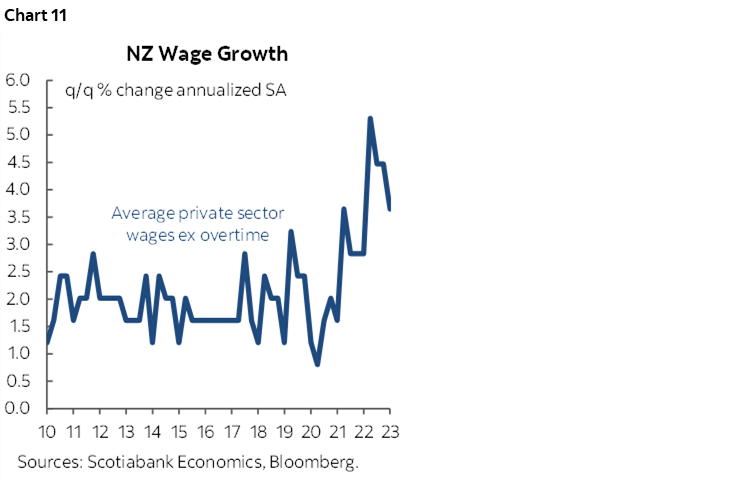
Asia-Pacific markets face a light overall calendar of releases but more of the emphasis may be upon the continued debate over China’s guidance toward policy easing. Key macro highlights will include Tuesday’s Q2 jobs and wages that may inform whether wage pressures in New Zealand are easing (chart 11), China’s private PMIs for July over the first half of the week, inflation readings from Indonesia and South Korea (Tuesday) plus the Philippines, HK GDP (Monday), India’s PMIs (Tuesday, Thursday) and Australian retail sales (Wednesday).
The European fundamentals calendar may be largely anticlimactic with the ECB out of the way for now and after several countries released CPI and GDP estimates toward the end of this past week. The Eurozone tallies for inflation and Q2 GDP kick off the week, and watch core CPI’s month-over-month readings for evidence on whether gains remain seasonally hotter than usual or have recently cooled. Other European highlights will include German unemployment (Tuesday), exports (Thursday) and factory orders (Friday).
Mexico releases Q2 GDP on Monday and a seventh straight gain is expected to be registered with annualized q/q growth landing around 3½%.
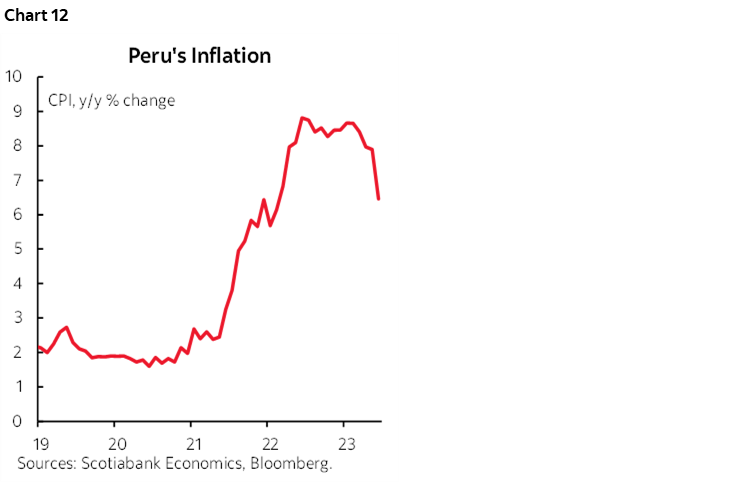
Peru’s CPI inflation for July (Tuesday) could continue to post an ongoing deceleration from the peak rate (chart 12).


DISCLAIMER
This report has been prepared by Scotiabank Economics as a resource for the clients of Scotiabank. Opinions, estimates and projections contained herein are our own as of the date hereof and are subject to change without notice. The information and opinions contained herein have been compiled or arrived at from sources believed reliable but no representation or warranty, express or implied, is made as to their accuracy or completeness. Neither Scotiabank nor any of its officers, directors, partners, employees or affiliates accepts any liability whatsoever for any direct or consequential loss arising from any use of this report or its contents.
These reports are provided to you for informational purposes only. This report is not, and is not constructed as, an offer to sell or solicitation of any offer to buy any financial instrument, nor shall this report be construed as an opinion as to whether you should enter into any swap or trading strategy involving a swap or any other transaction. The information contained in this report is not intended to be, and does not constitute, a recommendation of a swap or trading strategy involving a swap within the meaning of U.S. Commodity Futures Trading Commission Regulation 23.434 and Appendix A thereto. This material is not intended to be individually tailored to your needs or characteristics and should not be viewed as a “call to action” or suggestion that you enter into a swap or trading strategy involving a swap or any other transaction. Scotiabank may engage in transactions in a manner inconsistent with the views discussed this report and may have positions, or be in the process of acquiring or disposing of positions, referred to in this report.
Scotiabank, its affiliates and any of their respective officers, directors and employees may from time to time take positions in currencies, act as managers, co-managers or underwriters of a public offering or act as principals or agents, deal in, own or act as market makers or advisors, brokers or commercial and/or investment bankers in relation to securities or related derivatives. As a result of these actions, Scotiabank may receive remuneration. All Scotiabank products and services are subject to the terms of applicable agreements and local regulations. Officers, directors and employees of Scotiabank and its affiliates may serve as directors of corporations.
Any securities discussed in this report may not be suitable for all investors. Scotiabank recommends that investors independently evaluate any issuer and security discussed in this report, and consult with any advisors they deem necessary prior to making any investment.
This report and all information, opinions and conclusions contained in it are protected by copyright. This information may not be reproduced without the prior express written consent of Scotiabank.
™ Trademark of The Bank of Nova Scotia. Used under license, where applicable.
Scotiabank, together with “Global Banking and Markets”, is a marketing name for the global corporate and investment banking and capital markets businesses of The Bank of Nova Scotia and certain of its affiliates in the countries where they operate, including; Scotiabank Europe plc; Scotiabank (Ireland) Designated Activity Company; Scotiabank Inverlat S.A., Institución de Banca Múltiple, Grupo Financiero Scotiabank Inverlat, Scotia Inverlat Casa de Bolsa, S.A. de C.V., Grupo Financiero Scotiabank Inverlat, Scotia Inverlat Derivados S.A. de C.V. – all members of the Scotiabank group and authorized users of the Scotiabank mark. The Bank of Nova Scotia is incorporated in Canada with limited liability and is authorised and regulated by the Office of the Superintendent of Financial Institutions Canada. The Bank of Nova Scotia is authorized by the UK Prudential Regulation Authority and is subject to regulation by the UK Financial Conduct Authority and limited regulation by the UK Prudential Regulation Authority. Details about the extent of The Bank of Nova Scotia's regulation by the UK Prudential Regulation Authority are available from us on request. Scotiabank Europe plc is authorized by the UK Prudential Regulation Authority and regulated by the UK Financial Conduct Authority and the UK Prudential Regulation Authority.
Scotiabank Inverlat, S.A., Scotia Inverlat Casa de Bolsa, S.A. de C.V, Grupo Financiero Scotiabank Inverlat, and Scotia Inverlat Derivados, S.A. de C.V., are each authorized and regulated by the Mexican financial authorities.
Not all products and services are offered in all jurisdictions. Services described are available in jurisdictions where permitted by law.