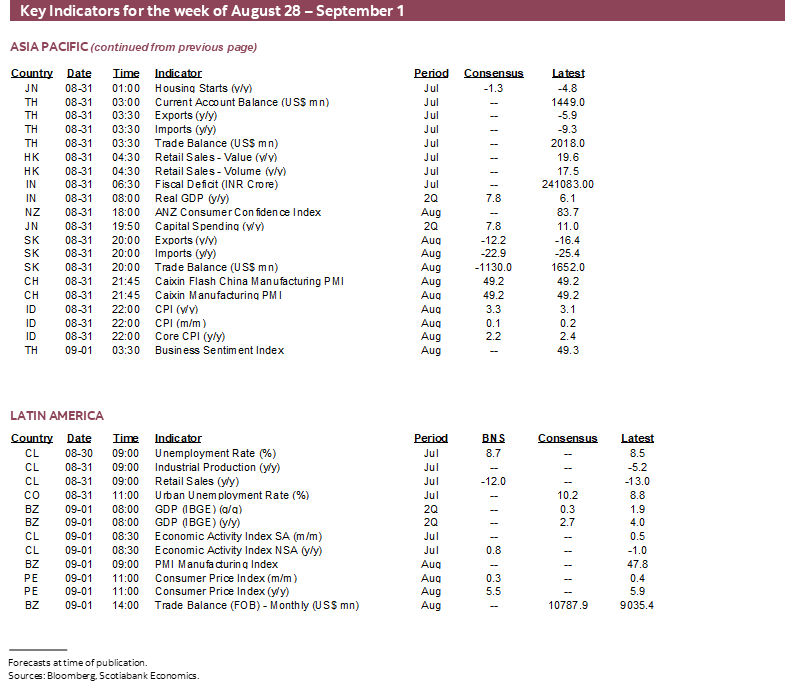
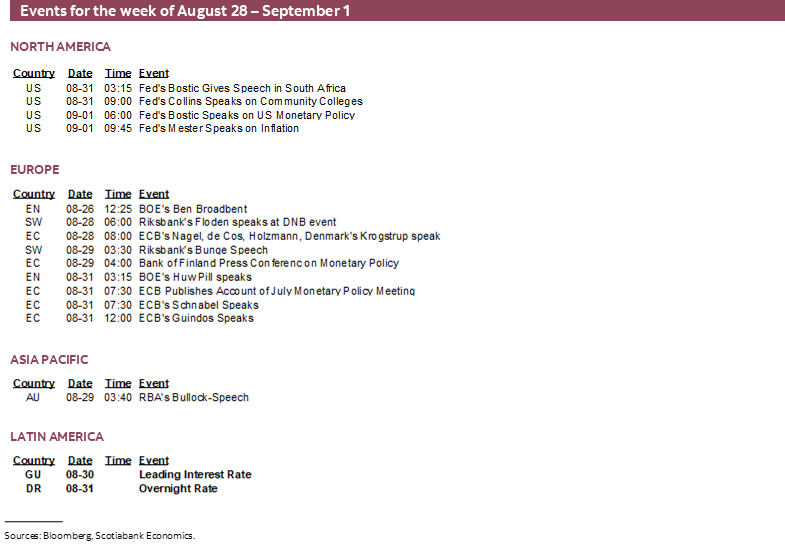
Next Week's Risk Dashboard
- Uh oh it’s September in the markets!
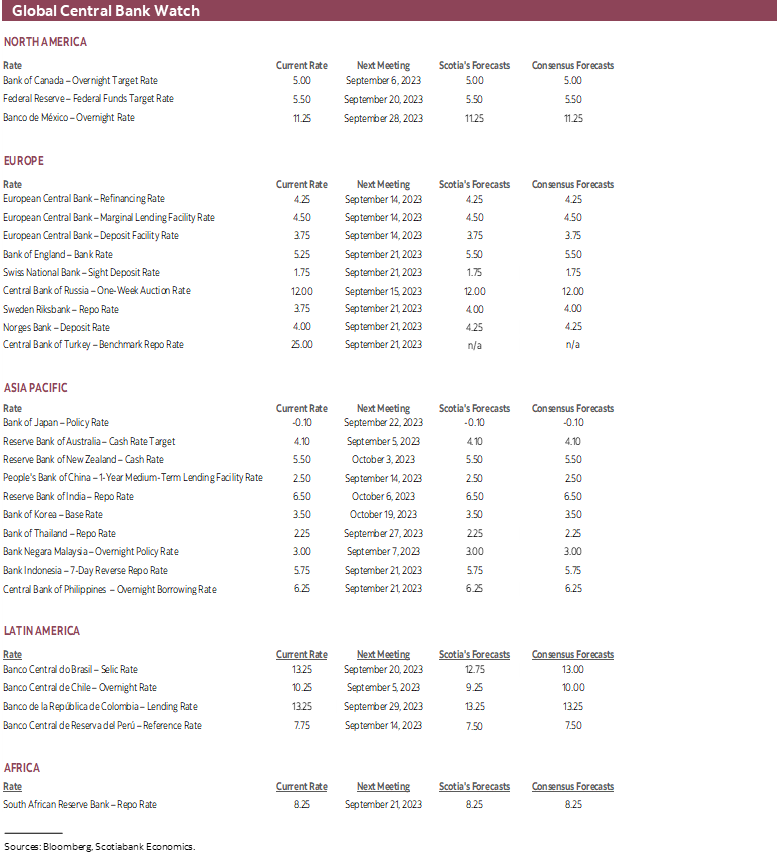
- Setting the stage for September’s central bank decisions
- Nonfarm payrolls and wages to inform the FOMC’s next move
- China’s PMIs: Is bad news already priced in?
- Eurozone core CPI may up ECB hike pricing
- Challenging the common BoC narrative
- Canadian GDP weighed down by transitory shocks
- Canadian bank earnings season continues
- Australian CPI unlikely to impact RBA’s coming decision
- A heavy week for US macro reports
Chart of the Week
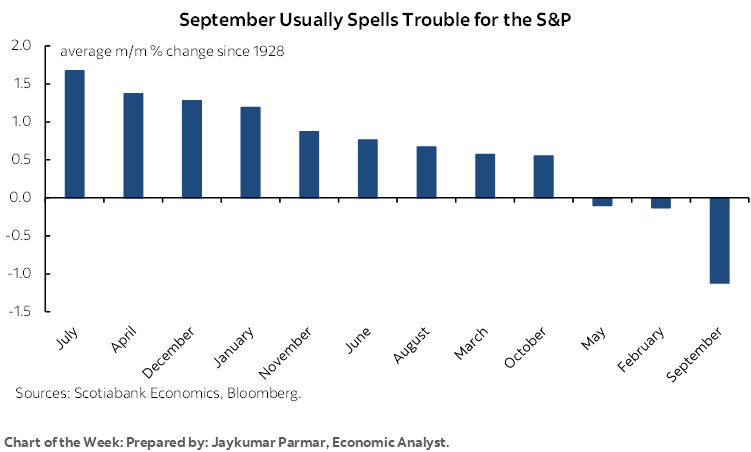
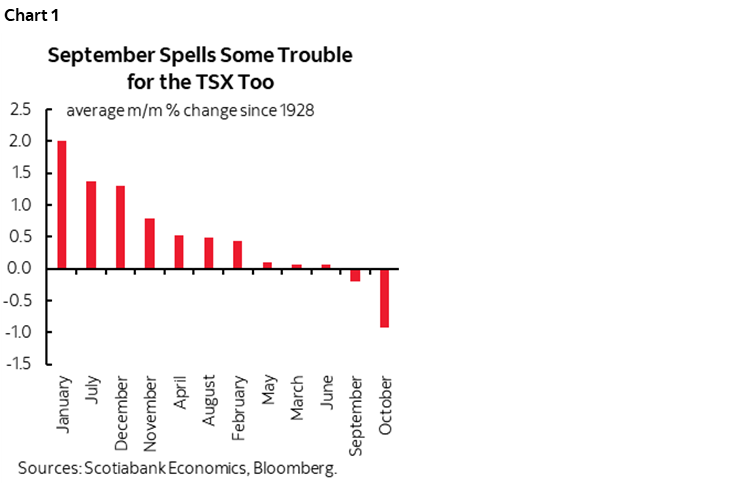
As the calendar transitions to September, most seasoned markets professionals need no reminders of the so-called September effect on risk appetite. The cover chart shows monthly returns on the S&P500 since 1928 and chart 1 does likewise for the TSX where September tends to be the second worst month behind October. It’s a frankly lousy month on average at least for passive investing, but averages don’t necessarily translate into reality each year. This week’s developments could inform how the transition unfolds this year.
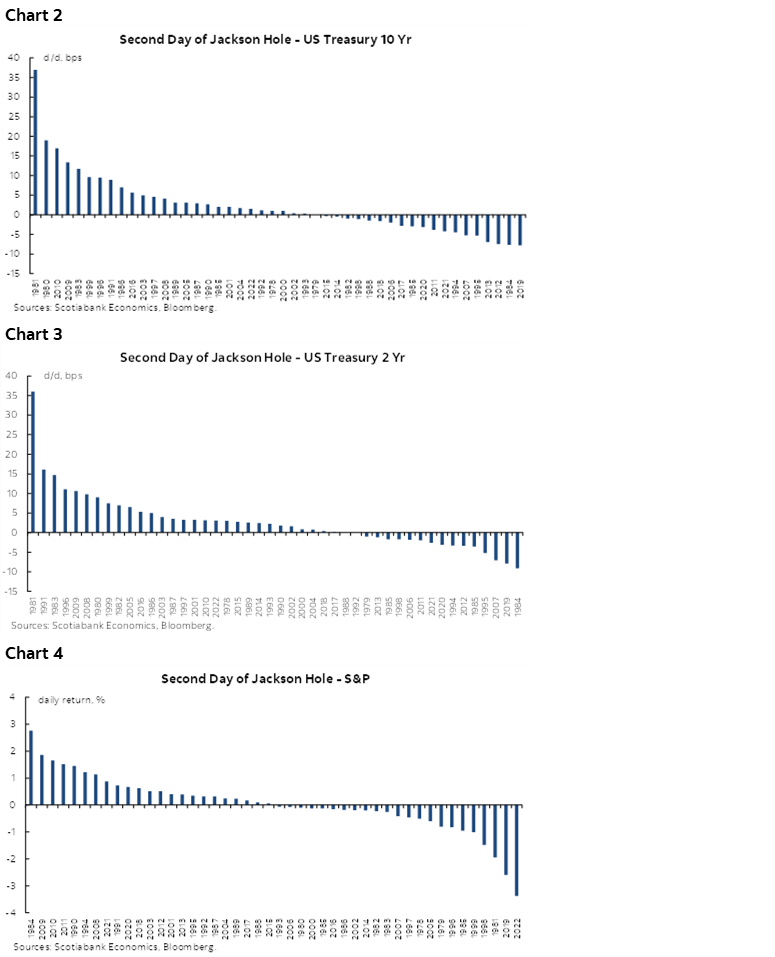
While no global central banks will be delivering policy decisions this week, the aftermath of the second day of the Jackson Hole symposium could well offer market effects into Monday as in the past (charts 2–4, next page). BoJ Governor Ueda’s participation as a co-panelist with BoE Deputy Governor Broadbent on Saturday could be one example of the risk, plus whatever comments various central bankers offer from the sidelines. UK markets will have to catch up after a long weekend.
More important, however, is that this week’s developments could materially inform the subsequent round of policy decisions by the RBA on the 5th, the BoC on the 6th, the ECB on the 14th, the Federal Reserve on the 20th, the BoE on the 21st and the Bank of Japan on the 22nd. A number of key reports from US payrolls and wages to Eurozone inflation, Canadian GDP to Chinese PMIs and inflation reports from Australia and Peru are among the examples of a heavy line-up of fundamentals this week. Toss in the aftermath of Fed Chair Powell’s and ECB President Lagarde’s essentially data dependent messages and the continuation of the Canadian bank earnings season and the transition toward flipping the calendar over to September could be a lively one overall. Caution is the word of the week and beyond.
Caution, however, cuts both ways when it comes to policy risks and to that effect I’ll offer more of my thinking on the Bank of Canada in this publication.
US NONFARM TO INFORM FOMC’S SEPTEMBER MOVE
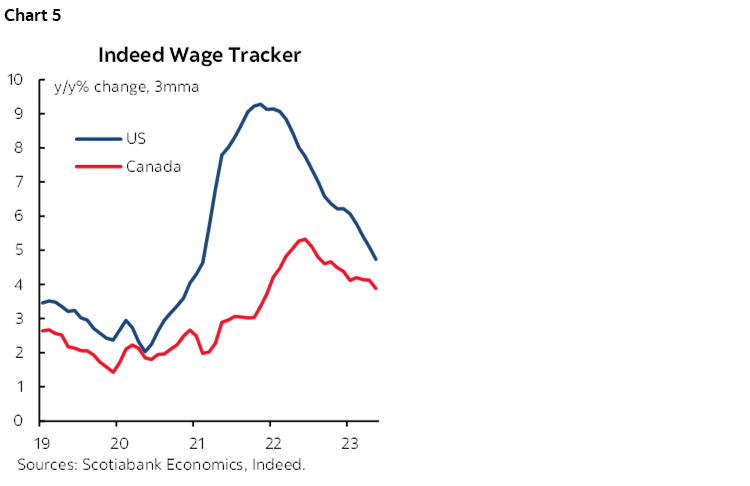
August payrolls and wages are due out on Friday. I’ve guesstimated a rise of 200k with wage growth of 0.3% m/m SA. Wages being offered in job postings have seen slowing trend growth, but may not be indicative of actual wages or pressures for all workers at the margin (chart 5).
At the time of writing, estimates lie from a low of about 100k to a high of 230k with a clustering in the 150–180k range and a median call for 165k. Bloomberg’s ‘whisper’ number—a composite of random submissions—is no different at about 170k.
The week will reveal more indicators that could help inform nonfarm payroll estimates, to the modest extent to which they ever prove to be useful. JOLTS job openings during July arrive on Tuesday. ADP private payrolls will be updated for August the next day. Challenger job cuts during August will be released on Thursday.
Throughout it all, always remember that the 90% confidence interval around estimated nonfarm payroll changes is +/- 130k and it seems to increase every other time that I check it. That’s roughly the geographical width of the continental United States. The figures are more about the clean-up and drawing inferences than feigning precision around the forecasts.
To that effect, payrolls and wages will be one important step along the data dependent path to the FOMC’s September 20th decision, along with other key reports like PCE inflation for July and CPI inflation for August.
GLOBAL MACRO—NERD HEAVEN
There will be a number of other key global economic indicators that will serve to inform expectations for September’s round of central bank decisions and the health of the Chinese economy. I’ll highlight key ones and write about the others during the week.
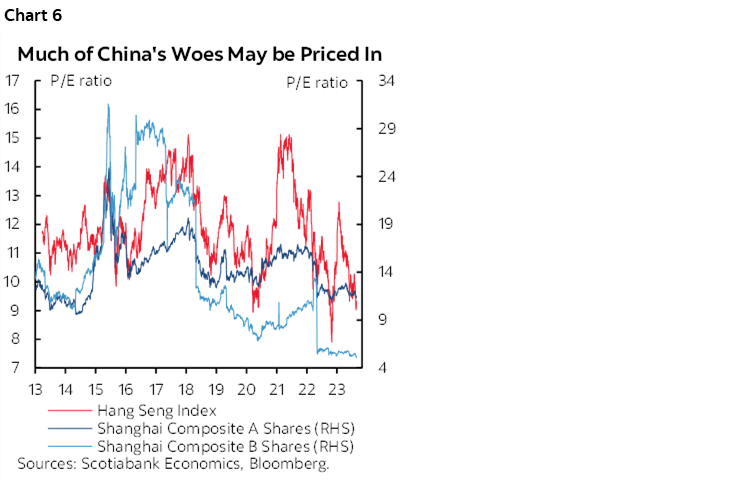
Are China’s Economic Woes Priced In?
China reports another round of purchasing managers’ indices that will inform growth downsides through August on Wednesday (state PMIs) and Thursday (private manufacturing PMI). There is no shortage of bearish China coverage, but key is how much of this is priced in. I’d say probably a lot of it by now and especially if my reflation views into 2024 prove correct, barring extreme developments such as flaring geopolitical risk or policy measures such as capital controls. Price-earnings ratios are toward multi-year lows on the Hang Seng and Shanghai composite indices (chart 6).
Eurozone Inflation to Inform the ECB’s Next Move
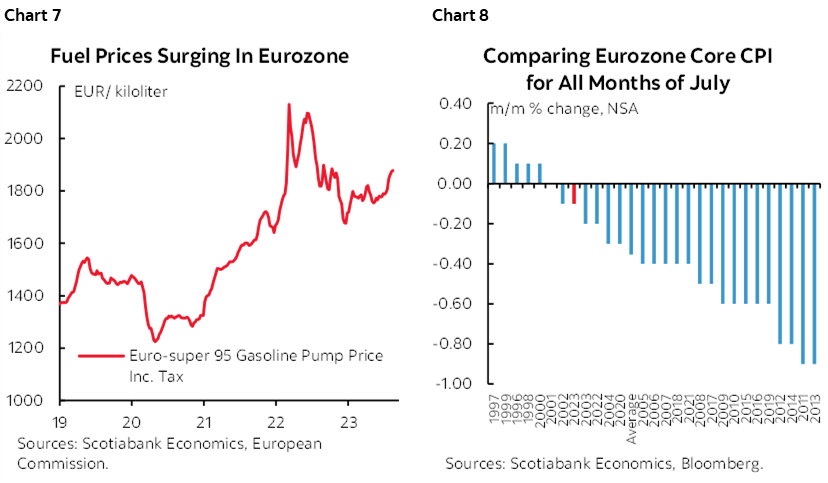
Eurozone CPI inflation during August (Thursday) is expected to post a firm headline gain but the main focus will be upon core ex-food and energy. A roughly 4% m/m NSA rise in fuel prices should contribute a significant part of the 0.3–0.6% m/m range of consensus estimates (chart 7). Key, however, will be whether the general pattern of hotter than seasonally usual increases in core inflation that has prevailed throughout much of this year will continue in July (chart 8). If so, then it could lean toward guidance from ECB officials such as Holzmann, Nagel and Kazaks that counsel against pausing at the September 14th decision and in favour of a data dependent hike. CPI updates from Spain on Tuesday and Germany on Wednesday could inform risks to the expectations, while France and Italy release on Thursday.
Other inflation readings will also surface. Australia updates CPI for July on Tuesday evening (ET) ahead of the RBA’s expected hold on September 5th. New RBA Governor Michele Bullock will speak hours earlier and also faces the sticky situation presented by fighting inflation and counselling workers to behave responsibly, while its staff just rejected a proposed pay increase of 4% this year, 3.5% next year and 3% in 2025. The RBA’s own staff could be viewed as either a) seeking to make up for a real wage cut to date, and/or b) signalling low faith in durably hitting the RBA’s 2–3% inflation target.
Peru updates CPI inflation for August on Friday and Indonesia reports the day before.
A heavy line-up of other US releases will include the following:
- Consumer confidence (Tuesday): August’s reading might have softened. July’s somewhat softer payrolls report, higher gas prices, and volatile markets that pushed the 30-year fixed mortgage rate to about a 23-year high are among the motivating considerations.
- ISM-manufacturing (Friday): August’s reading is expected to continue to indicate that the manufacturing sector is in contraction for a 10th consecutive month. Hard data has been much more mixed. Manufacturing output has risen in three out of seven months so far this year, been little changed in two others, and fell in May and June before it jumped higher in July. Watch supply chain signals and both price and hiring signals. The more important (because of its weight) ISM-services reading won’t be out until the following week.
- Income and spending (Thursday): August’s release is expected to post strong growth in consumption as services get added to the earlier release that showed a 1% m/m SA gain in the retail sales control group. When coupled with income growth that is expected to be around the recent 0.3–0.4% trend pace, the result will probably push the personal saving rate lower than the prior month’s 4.3%.
- PCE inflation (Thursday): August’s release is forecast to largely follow the prior CPI figures with a mild headline PCE increase of 0.2% that could push the year-over-year rate back up above 3% and the core PCE inflation measure up by a similar amount that could halt the deceleration since late last year.
- Vehicle sales (Friday): August’s tally is forecast to pull back to about 15.3 million units at a seasonally adjusted and annualized pace for a nearly 3% m/m SA decline. That could knock about ½% m/m SA off of retail sales growth in isolation of all other effects. Industry guidance that serves as input to the BLS’s CPI figures also indicates that new vehicle prices were up by about 1% m/m SA and used vehicle prices were up by 1.5% m/m SA. If true, then the combined weighted contribution to August CPI from vehicle prices could be on the order of about 0.1% m/m SA.
- Q2 GDP-r (Wednesday): The second attempt at estimating Q2 GDP growth is not expected to result in material revisions to the first estimate of 2.4% q/q SAAR. The greater focus is upon momentum into Q3 that appears to be yet again driving upward forecast revisions.
Construction readings: Here we’ll get a trio of releases. Repeat sale home prices during June are expected to rise another 1% m/m SA or so (Tuesday). Pending home sales during July could soften as mortgage rates climbed (Wednesday). Construction spending during July is forecast to post another solid gain (Friday).
CANADA’S ECONOMY—T..T…T…TRANSITORY?
The much-maligned term in the subheading might be apropos when it comes to describing what is likely to be a soft set of GDP figures this week. We’ll have to carefully dissect the figures, focus upon measures beneath the headline, and apply judgement toward guidance offered by Statistics Canada in order to understand the degree to which expected softness is genuine, versus impacted by temporary shocks that could reverse over 2023H2. The figures will therefore be about much more than reacting to the headline estimate if the goal is to really understand what’s happening to the Canadian economy of late while drawing potential implications for the Bank of Canada and financial markets. The common narrative is that activity readings have soured, therefore the BoC should cease its hiking cycle; what follows will argue that transitory factors explain another soft patch and should be looked through in favour of focusing upon wage and price pressures.
Estimates for June, July and Q2
Canada will update monthly GDP from the production side of the accounts for June with details and offer a preliminary estimate for July sans details on Friday. Revisions are possible to prior months as well. Statistics Canada will also update Q2 GDP figures with details for the expenditure side of the accounts. The overall set of readings will give us a better sense of momentum into Q3 as an added benefit.
I’ve estimated a small dip in June of -0.1% m/m followed by a mild gain of 0.2% in July. Statistics Canada had previously guided back on July 28th that June GDP was tracking a -0.2% decline and markets have digested further releases since then. We know that hours worked were a touch higher (+0.1% m/m) which matters since GDP is an identity defined as hours times labour productivity. Housing starts surged by about 41% m/m and were aided by volatile multiples. Services related to the Spring housing market probably posted gains as well, alongside broader services. Retail, wholesale and manufacturing appeared to be weaker. A simple regression equation of GDP against these readings loosely helps to inform the estimate notwithstanding the fact GDP measures value added versus the volume readings that are being used. It usually performs decently.
For July, the early readings indicate that growth may have gone back into the black. Hours worked were up a touch, flash estimates for nominal readings lean toward gains in wholesale trade, manufacturing and retail, but housing starts slipped 10% and existing home sales were slightly lower. Services like air travel remained buoyant.
Q2 GDP growth using the monthly production-side GDP accounts looks like it is tracking at about 1¼% q/q SAAR. That rests upon the above estimate for June and no revisions that are nevertheless always possible. Barring revisions, and if the June and July estimates are in the right general ballpark, then Q3 GDP using the monthly figures could have about 1.0% q/q SAAR growth baked in assuming August and September are flat only to avoid slanting judgement beyond the limited information we have on Q3 so far. There could therefore be either upside or downside risk to Q3 tracking going forward as new information is considered.
Q2 GDP growth using expenditure-based accounts looks like it is tracking around 1% q/q annualized growth but with fairly wide margins around this one. By comparison, the Bank of Canada had forecast growth of 1½% in each of Q2 and Q3 in its Monetary Policy Report in late July. Their forecast process would have unfolded in the weeks before publication of the MPR and so when combined with the developments over the month since then it isn’t clear if they still stand by this estimate. There has been no communication from the BoC during August.
Focus on What’s Under the Hood
Forecasting Q2 GDP using the expenditure-based accounts also involves estimating inventory- and net trade contributions to growth, whereas monthly GDP from the production side of the accounts does not directly consider such influences and only captures indirect effects of supply chain management on the output of goods and services. Over time, the two concepts follow each other reasonably closely across quarters, but can deviate significantly in some quarters.
One reason for such deviations could resurface this time as it is likely to be important to control for these inventory and net trade effects. A key number is going to be final domestic demand that adds up consumption, investment in housing and business investment, and government spending. In other words, it excludes net trade and inventories. I think that may be key because while transitory shocks may disrupt each of the components of GDP, they may have particularly disruptive effects on inventories and trade that may not be reflective of what’s really going on in the economy. Looking at FDD may give a better sense of activity during Q2.
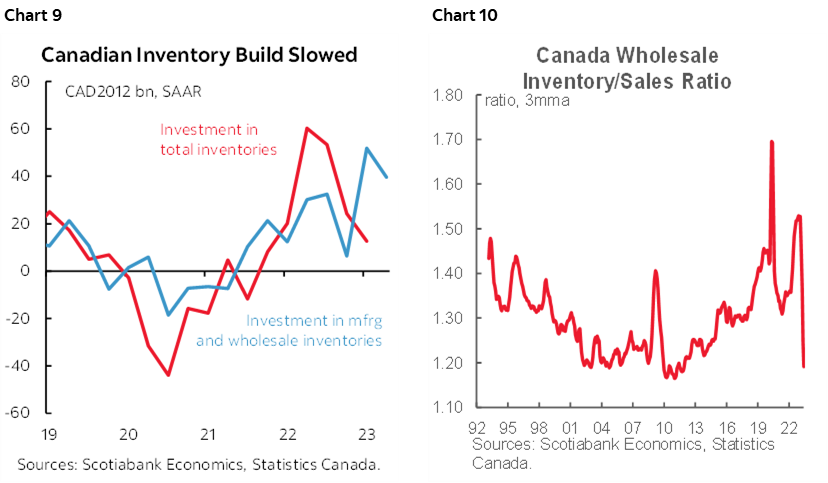
Inventories may have been a significant drag on GDP growth based on limited tracking. We know that the pace of the wholesale sector’s inventory accumulation meaningfully decelerated and that there was little change in the manufacturing sector’s pace of inventory investment (chart 9). I think much of this deceleration can be explained by two things. One is that wholesale inventories surged in Q1 after disruptions weighed on inventories in Q1 and so this overshoot was followed by softening in Q2 that should be smoothed. Another is that the port strike across west coast ports and the flooding that hit Halifax and surrounding rail lines probably impaired the arrival of goods in transit that drove weaker inventory accumulation. You could argue that the pace of inventory deceleration was undesired because wholesale sales were strong in Q2, flash guidance for July points to a 1.4% m/m nominal rise, and the sector’s inventory-to-sales ratio fell abruptly and sharply (chart 10).
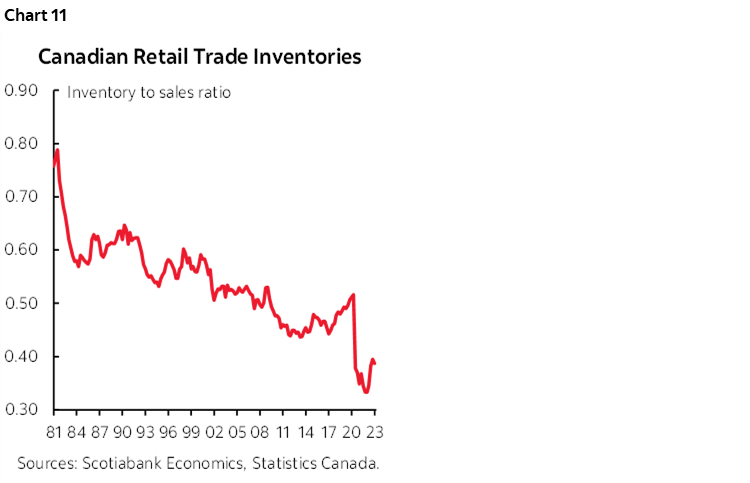
We can’t tell the retail side of the picture where monthly inventories are not available. Retail inventories were lean going into Q1 (chart 11) but the volume of retail sales was softer in Q2.
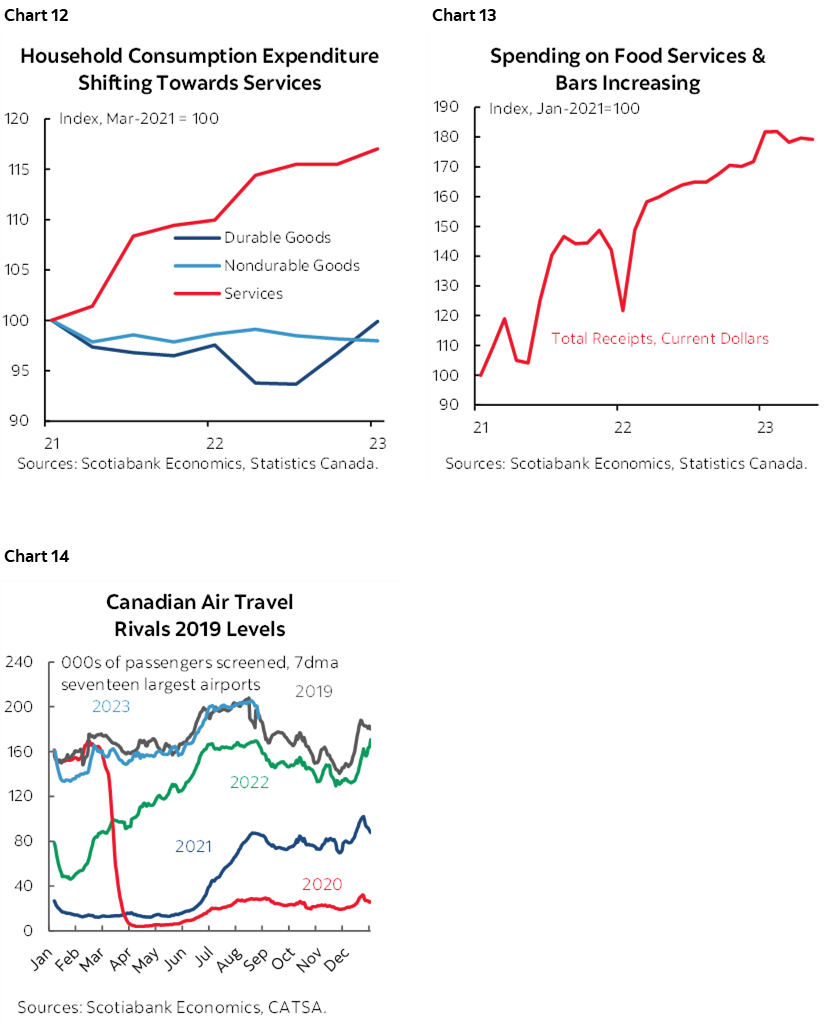
On the latter point, the retail figures suggest a soft consumer during Q2, but they don’t include any of the services that Canadians have been consuming. As argued here, services consumption has been leading the consumer sector’s growth for a while now (chart 12), but hard estimates for Q2 are difficult to provide. Figures like spending at restaurants and bars that is not included in retail sales and only go up to May (chart 13) plus fresh airport passenger data (chart 14) are among the limited readings that suggest that services spending probably added to GDP growth in Q2.
Net trade, however, is likely to be a significant drag on GDP growth. Volumes fell by 2.8% q/q SAAR for exports and increased by 1.2% q/q SAAR for imports, both of which will serve as drags on GDP growth including higher imports that leak out of GDP accounting. Here too the figures were probably significantly affected by the B.C. port strike and to a much lesser extent the flooding on the east coast that impacted the Halifax port and rail service. Much of a net trade drag on GDP could be made up in subsequent quarters as these effects reverse.
We also know that key sectors like petrochemicals were disrupted by wildfires and see that in the accelerating decline in oil exports by rail to the US. Wildfires probably knocked several tenths of a percentage point off of GDP growth per month by disrupting activity in several sectors such as petrochemicals and tourism. July was wetter than normal. There were other disruptive effects such as strikes and with more strike risk ahead including in sectors like autos and education.
I think that after controlling for all of these shocks, the economy probably easily grew by 2–2½% in Q2 and maybe more. Net trade is a transitory shock and if the US economy continues to post consensus-beating growth in Q3 as seems likely then trade could be more of a source of growth than just a reversal of temporary drag effects.
The volatility of Canadian GDP growth since 2022Q4 suggests that rolling shocks should be smoothed in favour of looking at trend growth that is not yet underperforming potential GDP growth and hence not yet opening up disinflationary economic slack.
It's my view that the BoC and markets should look through these effects and focus instead upon factors highlighted in the next section. If they do not, then both the BoC and markets may repeat the same issue in January when markets dovishly reacted to GDP tracking and the BoC hit pause, only to swing around more hawkishly as rebound evidence unfolded. The economy had come off a flat Q4 (-0.1% q/q SAAR) due to transitory shocks that especially hit the end of Q4 like pipeline spills south of the border that hit Canadian production, two train derailments, worse than usual weather that impacted December travel, and the biggest inventory drag on GDP growth in over four decades. The economy shook off those shocks and grew by 3.1% in Q1. The same scenario may be unfolding now.
What the BoC Has Said it is Focused Upon
All of that said, of course the BoC does not directly target GDP. GDP growth serves as a loose guide through an output gap framework of thinking to what might happen to future inflation after long and variable lags, but that’s only one influence upon inflation.
It may be more likely this time for the BoC to look through Q2 GDP and stick to emphasizing what Governor Macklem has said he is most focused upon.
Recall, for instance, here when he said:
“Inflation expectations have to come down further, services price inflation and wage growth need to moderate, and corporate pricing behaviour has to normalize.”
He then said this in July:
“We need to see demand growth slow, wage pressures moderate and corporate pricing behaviour normalize. We will also need to see near-term inflation expectations and measures of core inflation come down further.”
What has happened to these variables that Macklem has explicitly pointed to as factors guiding their decisions?
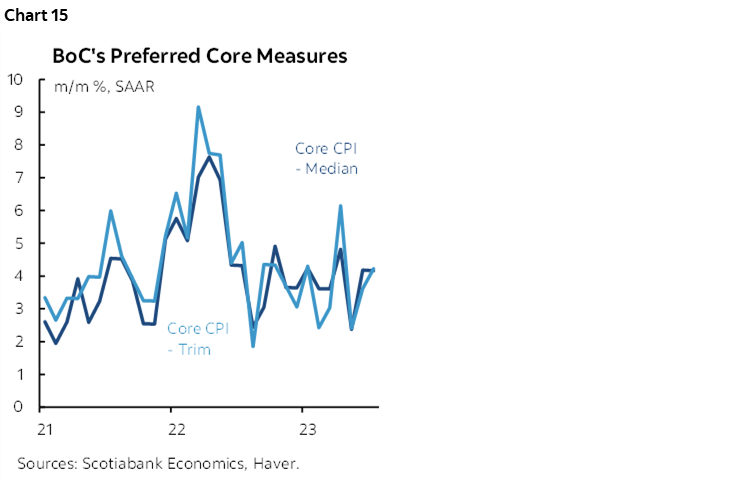
1. Core inflation measures remain hot with trend growth in weighted median and trimmed mean CPI still running at around 4¼% m/m SAAR (chart 15). Mortgage interest is affecting headline CPI, but not these core measures that exclude it and that indicate still hot underlying inflation marked by substantial breadth.
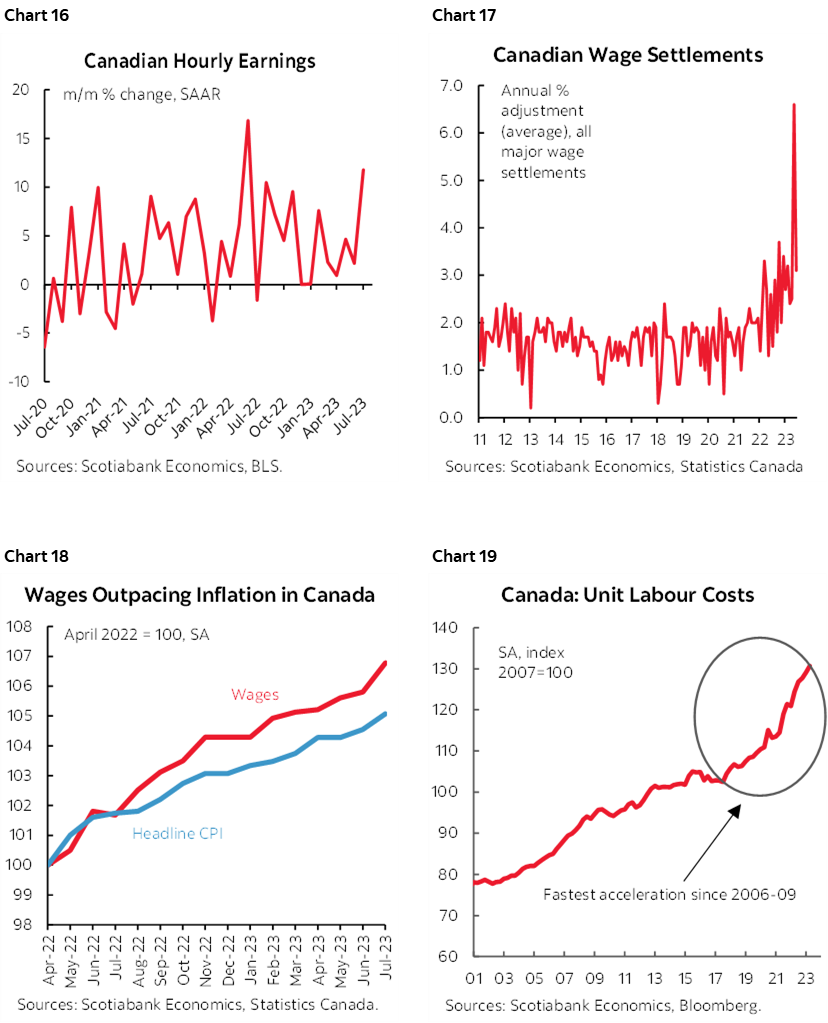
2. Wage pressures have accelerated and productivity remains weak as the surge in unit labour costs since 2017 continues (charts 16, 17, 18, 19). There may be more forthcoming pressure due to collective bargaining efforts including in key sectors like autos and education. A 30% unionization rate is eclipsed only by Italy and Belgium among reasonable peer group comparators. IMF research points to evidence that aggressive settlements can spill over into other parts of the labour market in countries with high unionization rates and at full employment, both of which describe Canada.
3. It’s unclear how the BoC’s reaction function may respond to indicators of demand growth. The arguments provided earlier in this note would suggest they should look through the headline GDP figures and examine the details while retaining cautious optimism into Q3. They may opt instead to sit out and wait for cautious optimism to become data reality which in my opinion may not be the best way to proceed. The few zillion economists at the BoC should be in a better position with better access to information to parse through the trend and transitory effects by combining models with in-quarter bottom-up discipline.
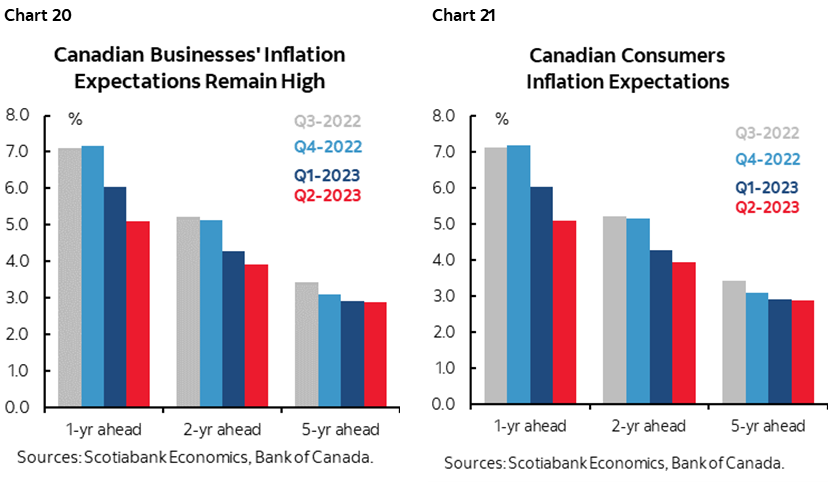
4. We won’t get fresh measures of inflation expectations until just before the October 25th MPR and policy decision when the BoC updates its surveys on October 16th. Still, the surveys that were released on June 30th indicated that businesses and consumers have a tough time believing that the BoC will hit its 2% inflation target over coming years (charts 20, 21). The BoC could opt to wait and see what the next batch of surveys indicate.
What it Could All Come Down to
In all, there is substantial risk that the BoC hikes again on September 6th and a slight bias toward a hold may be further informed by GDP figures. A totally silent BoC for an extended stretch since the last decision in July doesn’t help matters. Fresher evidence on the arguments provided above may keep the door open to hiking in October or a subsequent meeting.
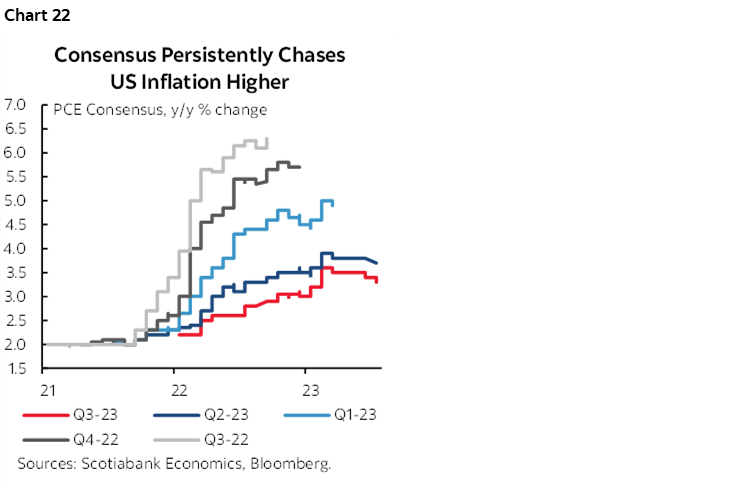
At the heart of the matter that lies beyond fundamentals are two considerations. One is the view that policy will turn more restrictive in real rate terms as expected inflation falls and therefore the BoC should stop hiking and perhaps be prepared to pivot toward a neutral-dovish stance. The problem with this view is that its proponents ignore the track record on inflation forecasting during the pandemic. The track record has been so awful that banking upon a rising real policy rate as expected inflation falls implies that the profession can forecast inflation. Chart 22 shows that it has been thoroughly unable to do so as consensus forecasts have routinely chased inflation higher. Ergo, one shouldn’t have much confidence in projecting the real policy rate!
The other is managing the belly of the curve which entails a delicate balancing act beyond a central bank’s prime influence upon the shorter-term end of the curve.
I think the BoC is probably pleased that, whether through luck and external developments or good policy (or both), their influence has been exerted further up the curve into the belly and the key 5-year portion given its importance to the mortgage market. The yield fell to around 2.75% early in the year following the BoC’s January pause that in my opinion misread the Q4 soft patch in the economy and the likely Q2 rebound, and then again at the low back in March when US banks were blowing up. It now stands at over 4%. The 5-year bond took its time in shaking off the US regional banking developments and was trading around 3% straight through to about mid-May. This combination of external shocks and the BoC’s market mismanagement earlier in the year contributed toward igniting the Spring housing market alongside the other policy missteps that include poor execution of immigration policy by the Federal government. The market wasn’t listening to the BoC’s subsequent communications that kept the door open to further tightening and leaned against premature rate cuts.
With the five-year at about 4% now, the BoC can perhaps take some satisfaction that the market is now listening, but with a strong caveat. It’s listening because it is pricing a decent chance at another rate hike over coming meetings. It’s listening because it has pushed off modest rate cut pricing into 2024H2 and beyond. That could be enough to give the BoC confidence to pause in September and perhaps beyond—and risk courting a renewed chicken-and-egg challenge.
Now let’s say the BoC whiffs in September. Maybe it whiffs again in October. The strong likelihood would be that the market declares the BoC’s tightening cycle is done regardless of whatever the BoC says. Markets being markets could then motivate yet another violent positioning swing into the front-end through the belly and start assuming that the clear signal they are done means cuts are coming sooner than priced. That could motivate the 5-year to rally back to, say, 3% again? Maybe lower?
The best tool to prevent this is to continue to lean toward intermittent rate hikes until you absolutely have clarity that inflation risk has been reduced. I don’t think we’re there yet as inflation risk is still pointed higher. There has been no progress toward creating durable disinflationary slack in the economy. The labour market remains very tight and is generating wage gains well above inflation and productivity benchmarks.
The BoC should not overestimate its sustained control and influence further up the curve in the same way its forecasts tried to do at the July meeting when I wrote this piece. Consistency is required. Difficulties with forecasts alongside persistent upside risks to inflation and inflation expectations merits a continued hawkish bias—and the willingness to deliver. We are still very much in an environment whereby bond markets are on tenterhooks that require disciplined management by central banks willing to do whatever they have to in order to stay the course toward conquering inflation. If they don’t, then don’t complain when bond markets act accordingly.
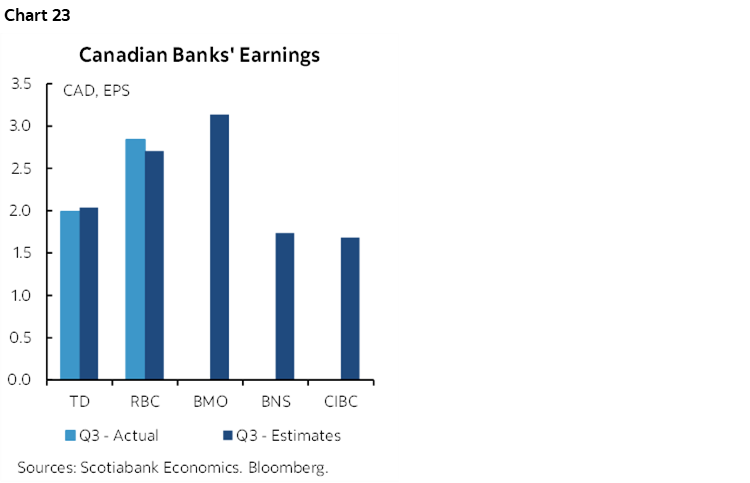
CDN BANK EARNINGS—TIEBREAKERS NEEDED
Canada’s fiscal Q3 bank earnings season continues this week. After two banks posted a beat and a miss this past week, the season will continue on Tuesday when BNS, my employer, releases along with BMO. National Bank follows on Wednesday. CIBC and Laurentian will release Thursday and then Canadian Western Bank updates on Friday. Chart 23 shows expectations.

DISCLAIMER
This report has been prepared by Scotiabank Economics as a resource for the clients of Scotiabank. Opinions, estimates and projections contained herein are our own as of the date hereof and are subject to change without notice. The information and opinions contained herein have been compiled or arrived at from sources believed reliable but no representation or warranty, express or implied, is made as to their accuracy or completeness. Neither Scotiabank nor any of its officers, directors, partners, employees or affiliates accepts any liability whatsoever for any direct or consequential loss arising from any use of this report or its contents.
These reports are provided to you for informational purposes only. This report is not, and is not constructed as, an offer to sell or solicitation of any offer to buy any financial instrument, nor shall this report be construed as an opinion as to whether you should enter into any swap or trading strategy involving a swap or any other transaction. The information contained in this report is not intended to be, and does not constitute, a recommendation of a swap or trading strategy involving a swap within the meaning of U.S. Commodity Futures Trading Commission Regulation 23.434 and Appendix A thereto. This material is not intended to be individually tailored to your needs or characteristics and should not be viewed as a “call to action” or suggestion that you enter into a swap or trading strategy involving a swap or any other transaction. Scotiabank may engage in transactions in a manner inconsistent with the views discussed this report and may have positions, or be in the process of acquiring or disposing of positions, referred to in this report.
Scotiabank, its affiliates and any of their respective officers, directors and employees may from time to time take positions in currencies, act as managers, co-managers or underwriters of a public offering or act as principals or agents, deal in, own or act as market makers or advisors, brokers or commercial and/or investment bankers in relation to securities or related derivatives. As a result of these actions, Scotiabank may receive remuneration. All Scotiabank products and services are subject to the terms of applicable agreements and local regulations. Officers, directors and employees of Scotiabank and its affiliates may serve as directors of corporations.
Any securities discussed in this report may not be suitable for all investors. Scotiabank recommends that investors independently evaluate any issuer and security discussed in this report, and consult with any advisors they deem necessary prior to making any investment.
This report and all information, opinions and conclusions contained in it are protected by copyright. This information may not be reproduced without the prior express written consent of Scotiabank.
™ Trademark of The Bank of Nova Scotia. Used under license, where applicable.
Scotiabank, together with “Global Banking and Markets”, is a marketing name for the global corporate and investment banking and capital markets businesses of The Bank of Nova Scotia and certain of its affiliates in the countries where they operate, including; Scotiabank Europe plc; Scotiabank (Ireland) Designated Activity Company; Scotiabank Inverlat S.A., Institución de Banca Múltiple, Grupo Financiero Scotiabank Inverlat, Scotia Inverlat Casa de Bolsa, S.A. de C.V., Grupo Financiero Scotiabank Inverlat, Scotia Inverlat Derivados S.A. de C.V. – all members of the Scotiabank group and authorized users of the Scotiabank mark. The Bank of Nova Scotia is incorporated in Canada with limited liability and is authorised and regulated by the Office of the Superintendent of Financial Institutions Canada. The Bank of Nova Scotia is authorized by the UK Prudential Regulation Authority and is subject to regulation by the UK Financial Conduct Authority and limited regulation by the UK Prudential Regulation Authority. Details about the extent of The Bank of Nova Scotia's regulation by the UK Prudential Regulation Authority are available from us on request. Scotiabank Europe plc is authorized by the UK Prudential Regulation Authority and regulated by the UK Financial Conduct Authority and the UK Prudential Regulation Authority.
Scotiabank Inverlat, S.A., Scotia Inverlat Casa de Bolsa, S.A. de C.V, Grupo Financiero Scotiabank Inverlat, and Scotia Inverlat Derivados, S.A. de C.V., are each authorized and regulated by the Mexican financial authorities.
Not all products and services are offered in all jurisdictions. Services described are available in jurisdictions where permitted by law.