

- Nonfarm payrolls were up 161k with positive revisions that beat estimates
- It was all due to a rather fishy SA factor…
- ...absent which payrolls would have been +15k and missed
- A new Trump-appointed BLS Commissioner should explain…
- ...and the Fed’s taskforces should weigh in
- Stalled yearly growth in payrolls remains a warning sign
- US nonfarm payrolls m/m 000s / UR %, SA, August:
- Actual: 162 / 4.1
- Scotia: 30 / 4.2
- Consensus: 55 / 4.1
- Prior: 21 / 4.1 (revised from –23 / 4.1)
It may be a one in a million coincidence. A strong beat by nonfarm payrolls was entirely due to an abrupt shift in the seasonal adjustment factor just as the new BLS Commissioner assumed his role. Colour me sceptical.
Charts 1 and 2 were instantly shared in internal chat rooms. They indicate that the seasonally unadjusted change in nonfarm payrolls was on the weak side of history for like months of August and in the ballpark of what I had estimated. That should have driven weak payrolls.
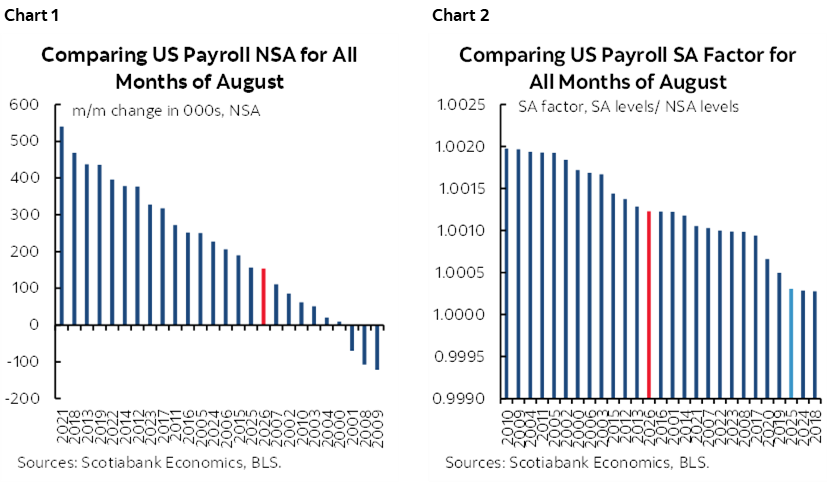
What I had not expected, however, was a very abrupt shift in the seasonal adjustment factor. All of a sudden the pattern that had been in place over the full prior decade toward low and falling seasonal adjustment factors applied to August payrolls swung toward being an historically average SA factor. This matters a great deal.
If, instead, we had stuck by the August SA factors from 2025 or 2024, then nonfarm payrolls would have only risen by 15k. The abrupt swing in the SA factor explained away what would have been a miss on nonfarm payrolls. The SA factor is not normally supposed to swing that abruptly given that it is calculated in a manner that applies a recency bias skewed to the experience over the most recent years.
There must be a public explanation here. And it must come from BLS Commissioner Brett Matsumoto (here). Mr. Matsumoto just took the reins at the BLS after the Senate confirmed his appointment by President Trump on August 7th—the day when the prior payrolls report was released—after a period of turmoil that ensued when Trump fired the former BLS Commissioner after weak numbers. This is the first payrolls report that Matsumoto presided over. Maybe there is a good explanation but I’m attaching a very low trust factor to these numbers until I hear one.
Recall that two of Chair Warsh’s five taskforces were mandated to look at data sources and to weigh in on developments surrounding productivity and jobs. These independence taskforces are supposed to be comprised of academics and experts in these areas. They should address very probing questions concerning BLS practices.
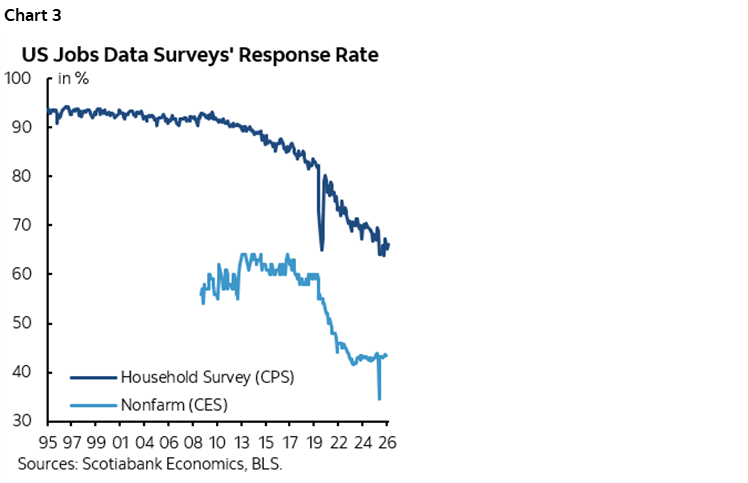
Another data quality dent is historic lows in survey response rates (chart 3).
This makes the rest of the coverage kind of moot, but here we go anyway.
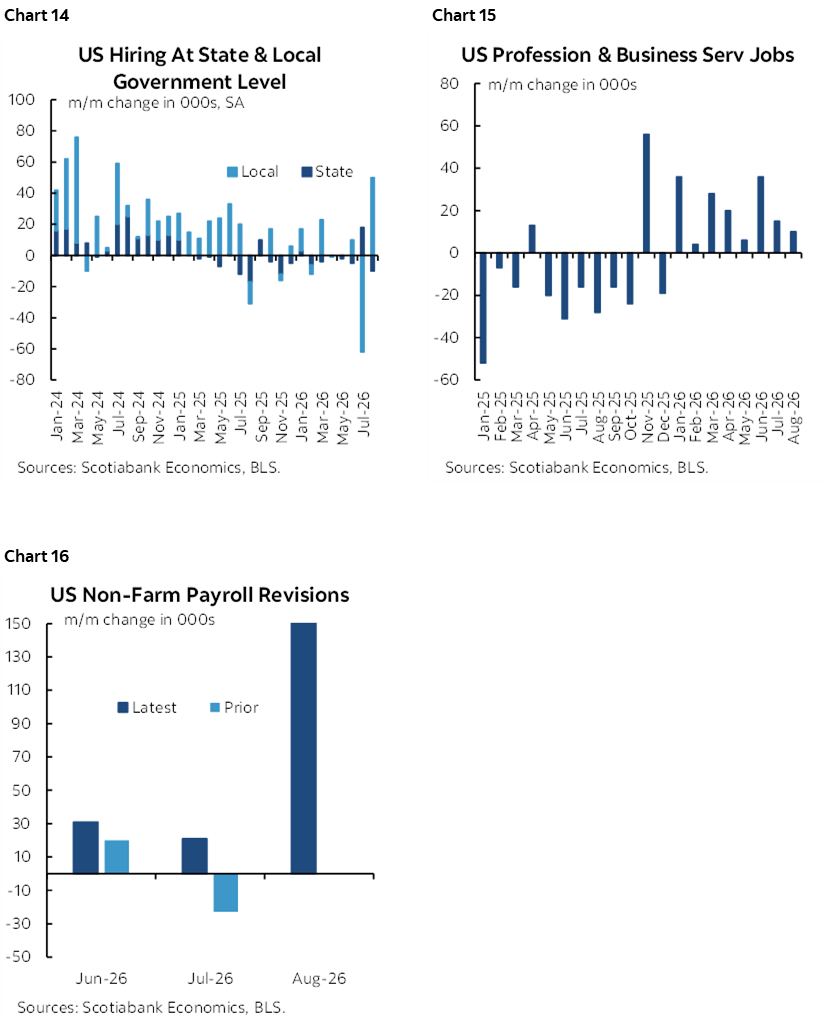
In addition to +161k payrolls, there were also upward revisions that carried July from –23k to +21k and also added 11k to June for a net two-month upward revision of 55k.
Most of the gain was in private payrolls (+127k) as government added 35k entirely at the state and local level (+40k). Federal workers fell by 5k.
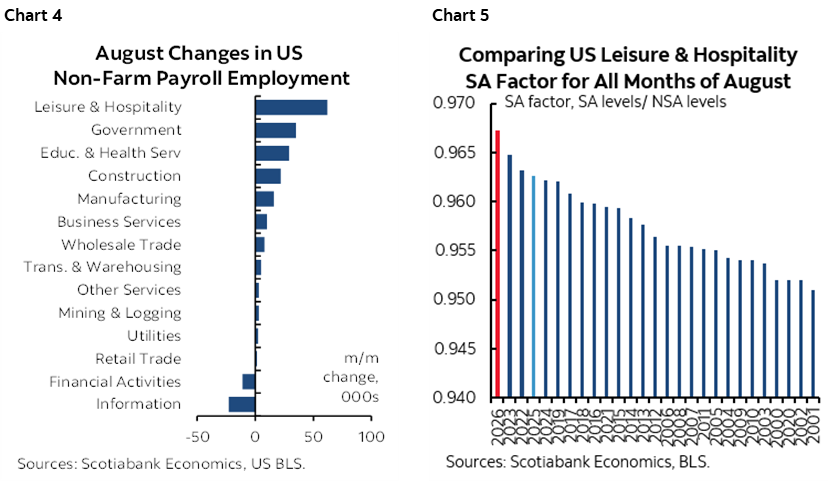
Chart 4 shows the sector breakdown and moderate breadth. I can’t explain the gain in leisure and hospitality when several readings we track suggest waning momentum in services, such as plunging number of airplane passengers. Chart 5 might be an attempt at explaining it because the BLS suddenly went to an unusually high SA factor for that sector. Education workers at local governments were up by 42k, almost fully reversing the prior month’s drop which is difficult to square with expiring funding and guidance from nationwide school boards especially just prior to the start of a new school year when contracts kick in.
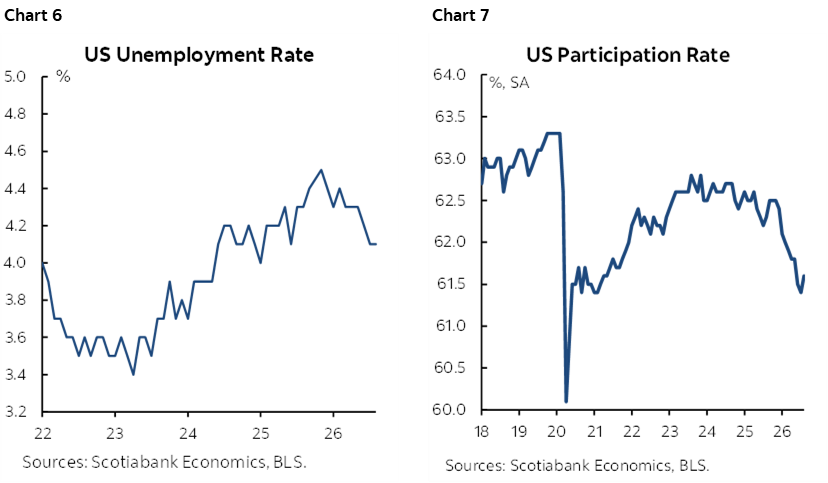
The unemployment rate held at 4.1% (chart 6) and is derived from the companion household survey that registered a 569k gain in employment (the biggest by far since January 2025) and a 683k rise in the labour force (also the biggest by far since January 2025). That arrested the declining trend in the participation rate at least for now (chart 7).
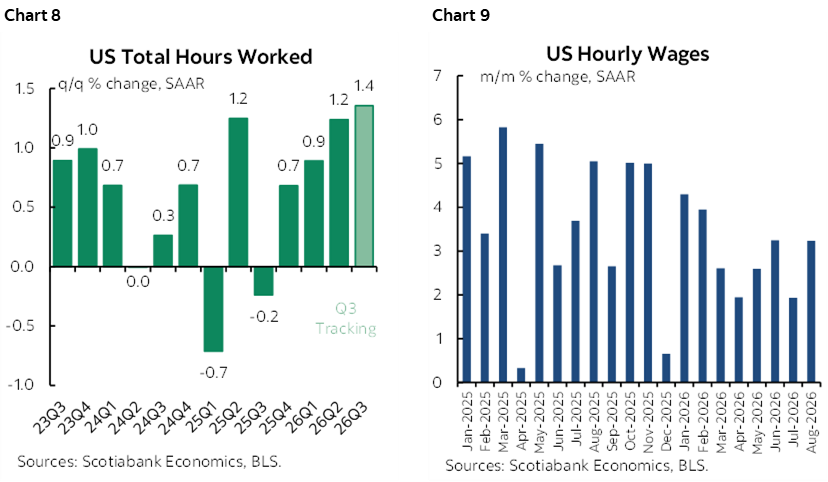
Hours worked are tracking a 1.4% q/q SAAR gain which is quickening but not quick (chart 8). Wage growth picked up to 3% m/m SAAR (chart 9).
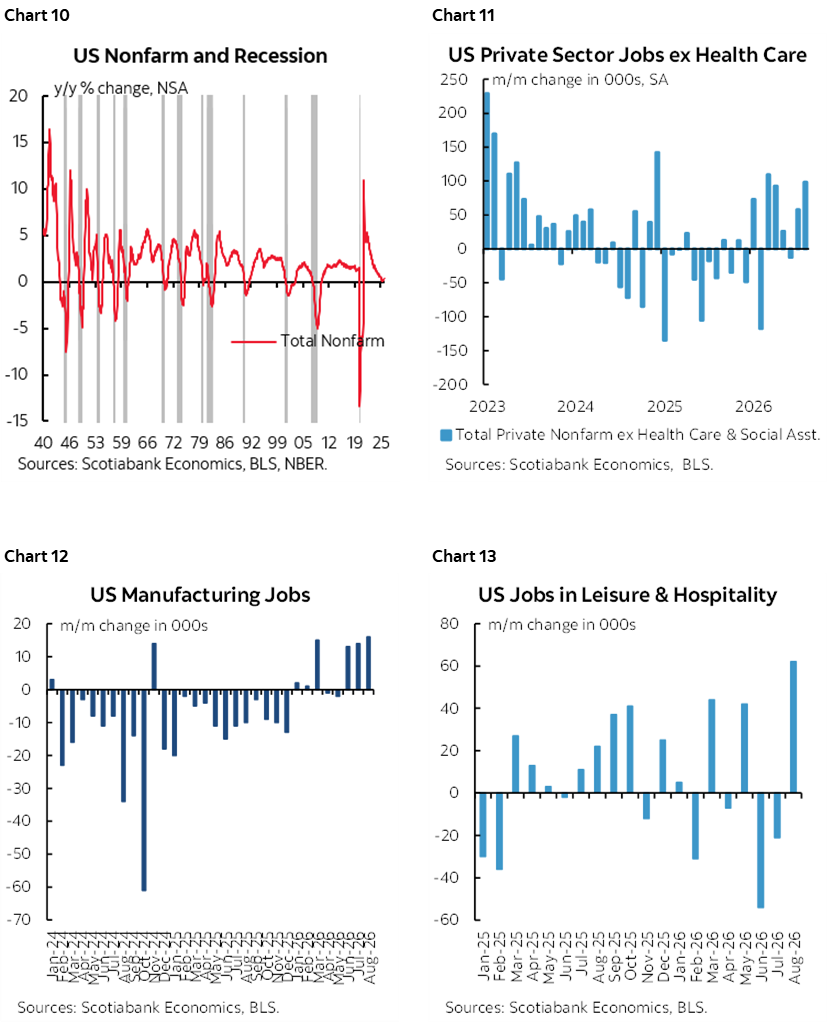
See the next page for other charts, particularly the first one that shows 0.4% q/q nonfarm payrolls is a warning sign on the health of the economy.
DISCLAIMER
This report has been prepared by Scotiabank Economics as a resource for the clients of Scotiabank. Opinions, estimates and projections contained herein are our own as of the date hereof and are subject to change without notice. The information and opinions contained herein have been compiled or arrived at from sources believed reliable but no representation or warranty, express or implied, is made as to their accuracy or completeness. Neither Scotiabank nor any of its officers, directors, partners, employees or affiliates accepts any liability whatsoever for any direct or consequential loss arising from any use of this report or its contents.
These reports are provided to you for informational purposes only. This report is not, and is not constructed as, an offer to sell or solicitation of any offer to buy any financial instrument, nor shall this report be construed as an opinion as to whether you should enter into any swap or trading strategy involving a swap or any other transaction. The information contained in this report is not intended to be, and does not constitute, a recommendation of a swap or trading strategy involving a swap within the meaning of U.S. Commodity Futures Trading Commission Regulation 23.434 and Appendix A thereto. This material is not intended to be individually tailored to your needs or characteristics and should not be viewed as a “call to action” or suggestion that you enter into a swap or trading strategy involving a swap or any other transaction. Scotiabank may engage in transactions in a manner inconsistent with the views discussed this report and may have positions, or be in the process of acquiring or disposing of positions, referred to in this report.
Scotiabank, its affiliates and any of their respective officers, directors and employees may from time to time take positions in currencies, act as managers, co-managers or underwriters of a public offering or act as principals or agents, deal in, own or act as market makers or advisors, brokers or commercial and/or investment bankers in relation to securities or related derivatives. As a result of these actions, Scotiabank may receive remuneration. All Scotiabank products and services are subject to the terms of applicable agreements and local regulations. Officers, directors and employees of Scotiabank and its affiliates may serve as directors of corporations.
Any securities discussed in this report may not be suitable for all investors. Scotiabank recommends that investors independently evaluate any issuer and security discussed in this report, and consult with any advisors they deem necessary prior to making any investment.
This report and all information, opinions and conclusions contained in it are protected by copyright. This information may not be reproduced without the prior express written consent of Scotiabank.
™ Trademark of The Bank of Nova Scotia. Used under license, where applicable.
Scotiabank, together with “Global Banking and Markets”, is a marketing name for the global corporate and investment banking and capital markets businesses of The Bank of Nova Scotia and certain of its affiliates in the countries where they operate, including; Scotiabank Europe plc; Scotiabank (Ireland) Designated Activity Company; Scotiabank Inverlat S.A., Institución de Banca Múltiple, Grupo Financiero Scotiabank Inverlat, Scotia Inverlat Casa de Bolsa, S.A. de C.V., Grupo Financiero Scotiabank Inverlat, Scotia Inverlat Derivados S.A. de C.V. – all members of the Scotiabank group and authorized users of the Scotiabank mark. The Bank of Nova Scotia is incorporated in Canada with limited liability and is authorised and regulated by the Office of the Superintendent of Financial Institutions Canada. The Bank of Nova Scotia is authorized by the UK Prudential Regulation Authority and is subject to regulation by the UK Financial Conduct Authority and limited regulation by the UK Prudential Regulation Authority. Details about the extent of The Bank of Nova Scotia's regulation by the UK Prudential Regulation Authority are available from us on request. Scotiabank Europe plc is authorized by the UK Prudential Regulation Authority and regulated by the UK Financial Conduct Authority and the UK Prudential Regulation Authority.
Scotiabank Inverlat, S.A., Scotia Inverlat Casa de Bolsa, S.A. de C.V, Grupo Financiero Scotiabank Inverlat, and Scotia Inverlat Derivados, S.A. de C.V., are each authorized and regulated by the Mexican financial authorities.
Not all products and services are offered in all jurisdictions. Services described are available in jurisdictions where permitted by law.