

- GDP grew by 3.3% with upward revisions and momentum into Q3
- Interest sensitives soared which leans hawkishly
- Exports are holding up very well despite Trump’s trade wars
- Multiple readings point to buoyant momentum into Q3
- Major projects suggestion: New tech for Statcan!!
- Canadian GDP, Q3, q/q SAAR, %:
- Actual: 3.3
- Scotia: 4.0
- Consensus: 3.4
- Prior: 0.3 (revised up from -0.1%)
- Canadian GDP, June, m/m SA, %:
- Actual: 0.3
- Scotia: 0.3
- Consensus: 0.2
- Prior: 0.3 (unrevised)
- July advance estimate: “essentially unchanged” (ie: likely –0.1 to +0.1)
Canada was the fastest growing economy in the G7 during the second quarter of this year and we think there is solid momentum into Q3. Underlying details are impressive including drivers and positive revisions. The broad takeaway is that with the kind of growth we’re seeing in the interest sensitive sectors, the last thing that the Bank of Canada would wish to do would be to throw kerosene onto the economy by cutting rates—in fact quite the opposite. That’s true even with the US having started a trade war that is frankly having minimal effect to date which is something we continue to expect.
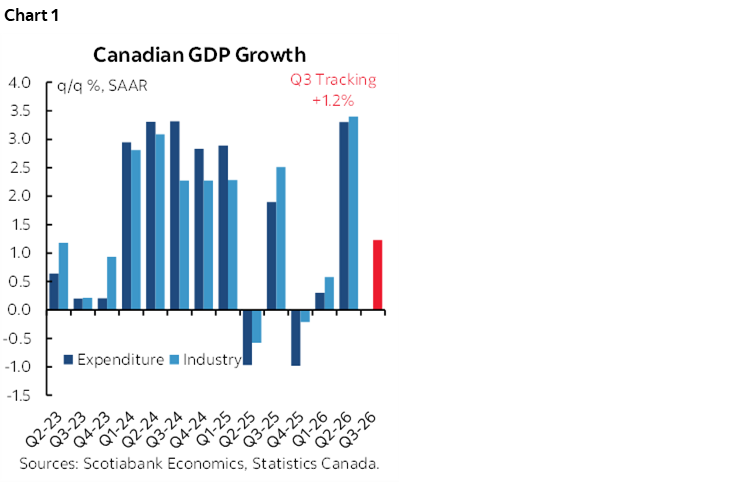
GDP was up by 3.3% q/q at a seasonally adjusted and annualized rate (SAAR). Chart 1. It would have come very close to my 4% estimate if not for upward revisions to Q1. The prior quarter was revised up from -0.1% q/q SAAR to +0.3%. That was still soft but removes the slight negative print and embarrasses the folks who tossed around the ‘r’ word.
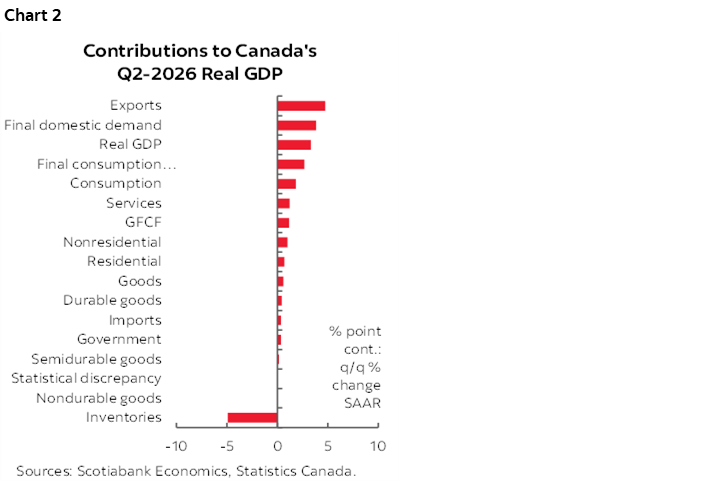
Contributions to Q2 GDP growth are shown in chart 2.
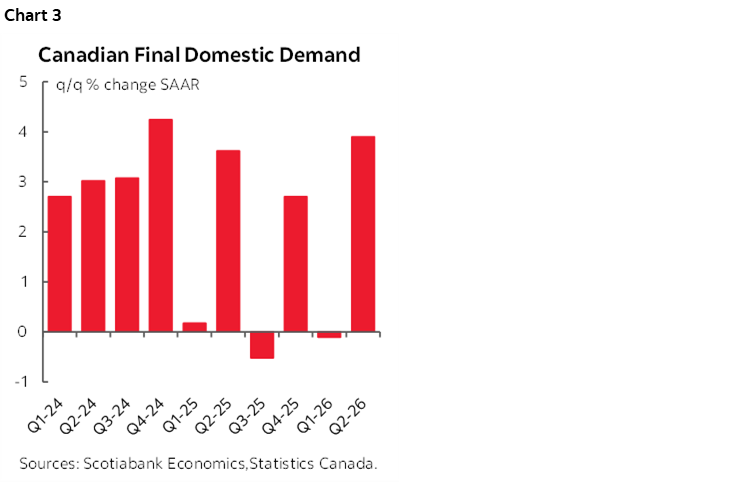
Final domestic demand adds up consumption plus investment plus government spending and hence excludes inventories and net trade. FDD soared by 3.9% for the quickest growth since 2024Q4 (chart 3).
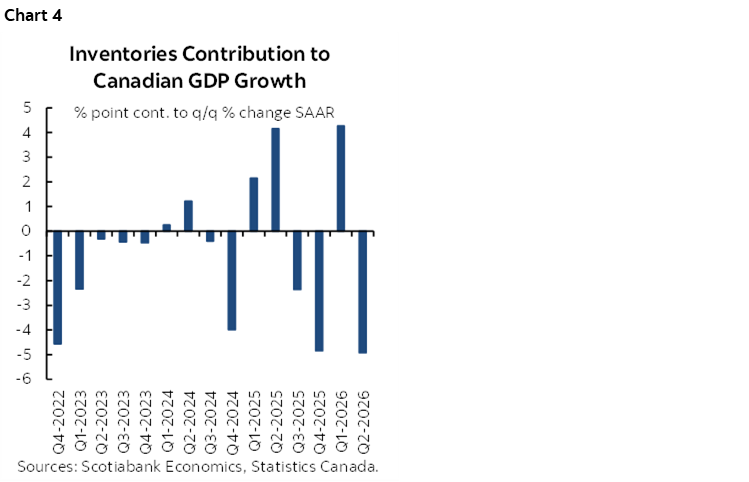
Inventories subtracted a whopping 4.9 percentage points from Q2 GDP after adding roughly 4% to Q1 GDP. You can't just take inventories out since they're connected with other components, but absent at least some of the inventory effect, we would have had an economy perhaps percentage points above the headline GDP number. My patented seesaw model derived from chart 4 has me thinking inventories could swing back to add multiple percentage points to Q3 GDP growth.
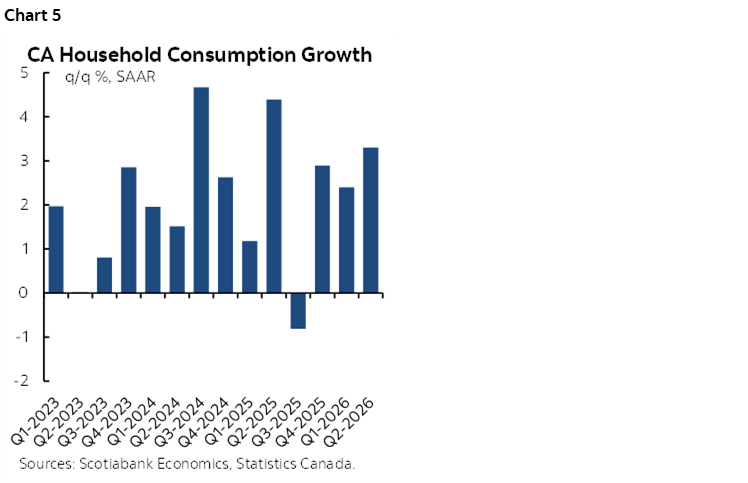
Consumer spending grew 3.5% q/q SAAR and was revised up in Q1. Chart 5. Consumption by households added a weighted 1.9 ppts to GDP in Q2. There has only been one weak quarter in the past five quarters during which the US started a trade war.
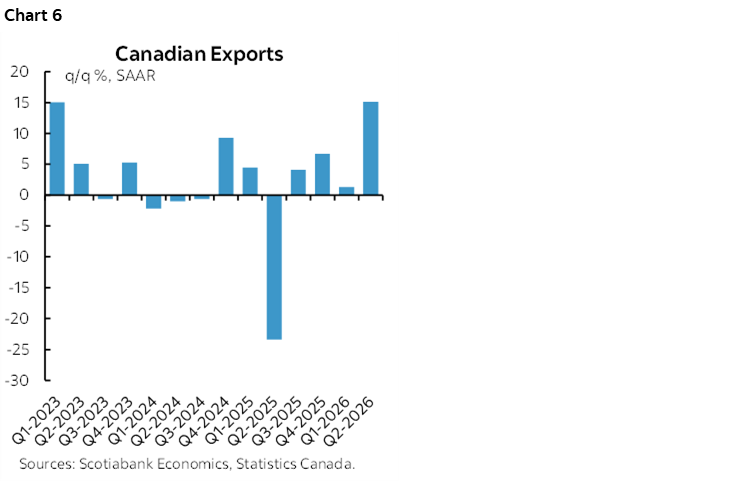
Exports are volatile but holding up. They were up by 15.1% q/q SAAR while imports were up 1.1%. Q4/Q1 into last year brought order front-running ahead of tariffs and then Q2 paid the price, followed by four consecutive gains. Repeat, there have been four consecutive gains in export volumes which covers 2025H2 and 2026H1 during which the US initiated trade war entered the picture (chart 6).
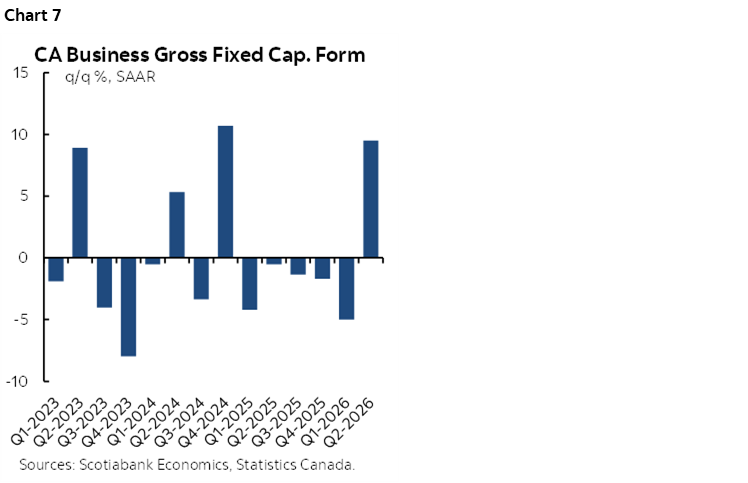
Investment grew by 9.5% q/q SAAR with nonresidential investment up 12.3% and residential/housing investment up 10.4%. These are incredibly strong numbers. The first investment gain in six quarters leads me to be cautious toward thinking that businesses are finally catching on (chart 7). Then again, if >100++ data centers come to fruition (many/most in Alberta) then perhaps it will continue.
Government investment was down again, -11% q/q SAAR in back-to-back declines but they follow a 25% gain in Q4. We’re going to keep getting very lumpy data on that line item for years to come as the government’s plans for major projects and investment start to flow through. Government consumption, however, was up 3.9% q/q SAAR after –0.1% in Q1.
There were no details provided for the July guidance in terms of numbers, only vague verbal guidance behind the 'essentially unchanged' remark:
"Increases in real estate and rental and leasing and professional, scientific and technical services were offset by decreases in retail trade and manufacturing. "
What about whether the economy can sustain momentum into Q3? Here are some points behind why I think it very well could:
- While very tentative, Q3 is looking like it is tracking at +1.3% q/q SAAR baked in so far. This is based upon Q2 figures and advance guidance for July while assuming August and September are flat to focus the math on the knowns. In other words, there is ongoing momentum in the economy that could improve or deteriorate over the remainder of the quarter.
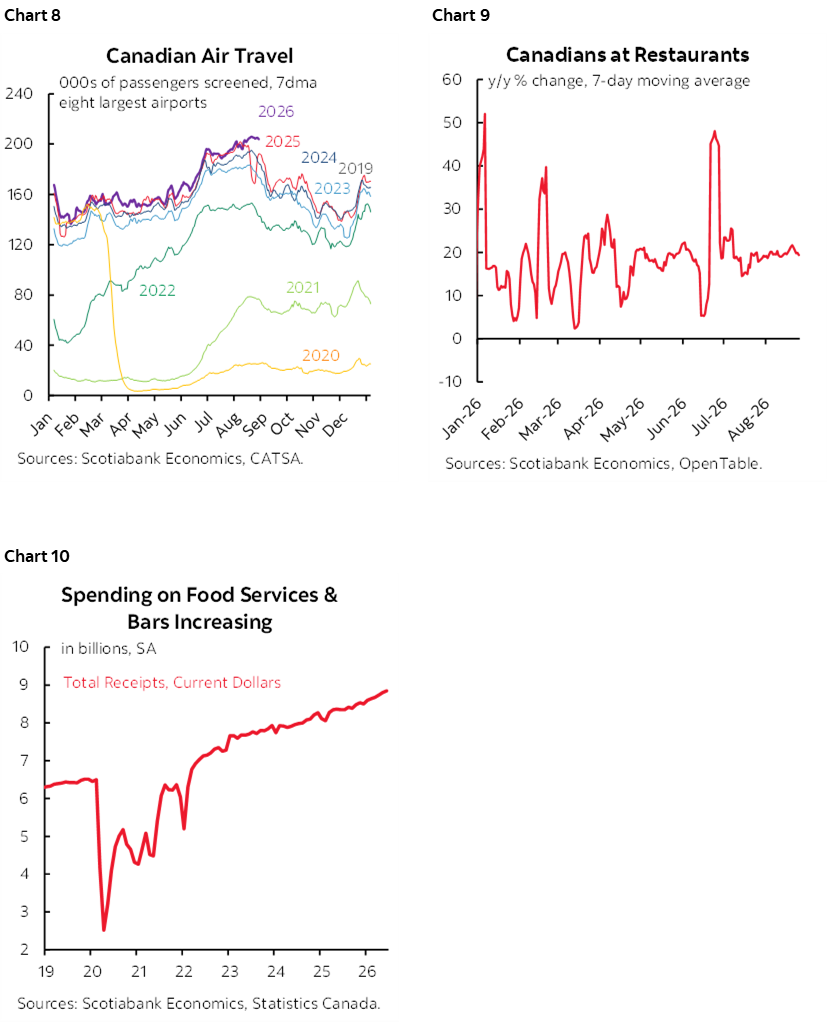
- Other readings point to buoyant household sector activity. Chart 8 shows that flights are….erm….soaring. So is activity at restaurants (charts 9, 10).
Last, someone needs to take charge and fix tech at Statcan. The site was down for an extended period starting right off the release.
Now onto Warsh’s speech.
DISCLAIMER
This report has been prepared by Scotiabank Economics as a resource for the clients of Scotiabank. Opinions, estimates and projections contained herein are our own as of the date hereof and are subject to change without notice. The information and opinions contained herein have been compiled or arrived at from sources believed reliable but no representation or warranty, express or implied, is made as to their accuracy or completeness. Neither Scotiabank nor any of its officers, directors, partners, employees or affiliates accepts any liability whatsoever for any direct or consequential loss arising from any use of this report or its contents.
These reports are provided to you for informational purposes only. This report is not, and is not constructed as, an offer to sell or solicitation of any offer to buy any financial instrument, nor shall this report be construed as an opinion as to whether you should enter into any swap or trading strategy involving a swap or any other transaction. The information contained in this report is not intended to be, and does not constitute, a recommendation of a swap or trading strategy involving a swap within the meaning of U.S. Commodity Futures Trading Commission Regulation 23.434 and Appendix A thereto. This material is not intended to be individually tailored to your needs or characteristics and should not be viewed as a “call to action” or suggestion that you enter into a swap or trading strategy involving a swap or any other transaction. Scotiabank may engage in transactions in a manner inconsistent with the views discussed this report and may have positions, or be in the process of acquiring or disposing of positions, referred to in this report.
Scotiabank, its affiliates and any of their respective officers, directors and employees may from time to time take positions in currencies, act as managers, co-managers or underwriters of a public offering or act as principals or agents, deal in, own or act as market makers or advisors, brokers or commercial and/or investment bankers in relation to securities or related derivatives. As a result of these actions, Scotiabank may receive remuneration. All Scotiabank products and services are subject to the terms of applicable agreements and local regulations. Officers, directors and employees of Scotiabank and its affiliates may serve as directors of corporations.
Any securities discussed in this report may not be suitable for all investors. Scotiabank recommends that investors independently evaluate any issuer and security discussed in this report, and consult with any advisors they deem necessary prior to making any investment.
This report and all information, opinions and conclusions contained in it are protected by copyright. This information may not be reproduced without the prior express written consent of Scotiabank.
™ Trademark of The Bank of Nova Scotia. Used under license, where applicable.
Scotiabank, together with “Global Banking and Markets”, is a marketing name for the global corporate and investment banking and capital markets businesses of The Bank of Nova Scotia and certain of its affiliates in the countries where they operate, including; Scotiabank Europe plc; Scotiabank (Ireland) Designated Activity Company; Scotiabank Inverlat S.A., Institución de Banca Múltiple, Grupo Financiero Scotiabank Inverlat, Scotia Inverlat Casa de Bolsa, S.A. de C.V., Grupo Financiero Scotiabank Inverlat, Scotia Inverlat Derivados S.A. de C.V. – all members of the Scotiabank group and authorized users of the Scotiabank mark. The Bank of Nova Scotia is incorporated in Canada with limited liability and is authorised and regulated by the Office of the Superintendent of Financial Institutions Canada. The Bank of Nova Scotia is authorized by the UK Prudential Regulation Authority and is subject to regulation by the UK Financial Conduct Authority and limited regulation by the UK Prudential Regulation Authority. Details about the extent of The Bank of Nova Scotia's regulation by the UK Prudential Regulation Authority are available from us on request. Scotiabank Europe plc is authorized by the UK Prudential Regulation Authority and regulated by the UK Financial Conduct Authority and the UK Prudential Regulation Authority.
Scotiabank Inverlat, S.A., Scotia Inverlat Casa de Bolsa, S.A. de C.V, Grupo Financiero Scotiabank Inverlat, and Scotia Inverlat Derivados, S.A. de C.V., are each authorized and regulated by the Mexican financial authorities.
Not all products and services are offered in all jurisdictions. Services described are available in jurisdictions where permitted by law.