

- Canada ‘lost’ 68k jobs last month…
- …and why I simply don’t believe the numbers…
- …which keeps us focused on inflation and inflation risk
- How BoC’s Macklem reads things next week may be key
- Canada jobs m/m 000s / UR %, SA, September:
- Actual: -68.3 / 6.5
- Scotia: 0.0 / 6.5
- Consensus: 10 / 6.5
- Prior: -41.7 / 6.4
Perhaps the analysts at Statistics Canada applied a little Thanksgiving humour here because is a turkey of a report. A summary is provided in chart 1.
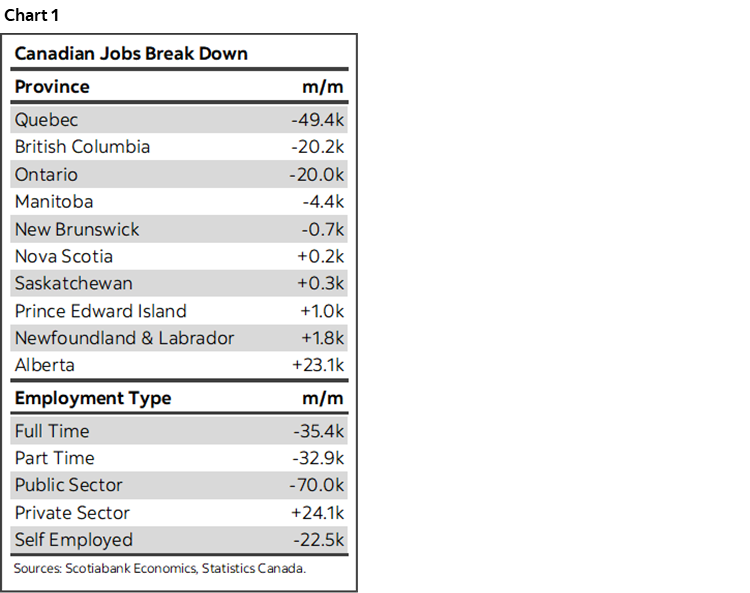
I simply refuse to believe that public sector jobs suddenly became the riskiest jobs on the planet—especially in Quebec, and during an election campaign no less! Yet that’s what Statistics Canada’s latest spin of the wheel on a small sample is asking us to believe.
Before turning to concerns, the headline numbers were bad. 68k jobs lost in September blew all forecasters away. The hit was split almost evenly between full-time (-35k) and part-time (-33k) spots. 110,000 jobs have been lost in the past two months.
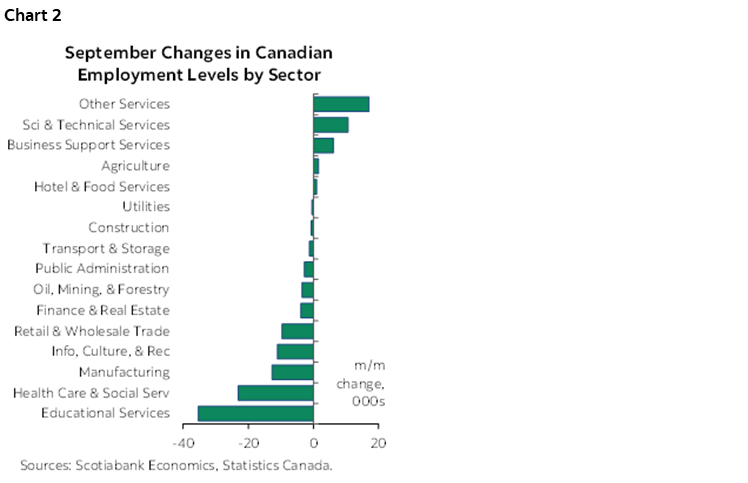
Chart 2 shows the sector breakdown. Almost all of the job loss was in the public sector.
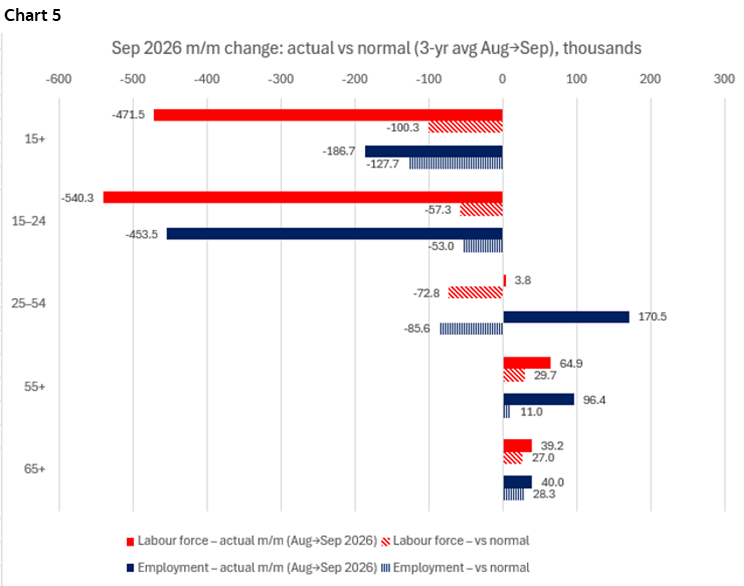
Youths 15-24 lost the most (-48k) followed by women 25–54 (-28k) as men 25–54 saw no change (0.3k) and those aged 55+ gained 7k entirely among women. (+19k).
The unemployment rate matched expectations by increasing a tick to 6.5%. It only increased a bit because the offset was that the labour force shrank by 53k m/m SA. The labour force has shrunk by 90k over two months despite the fact that population aged 15+ increased by 43k. Of that drop in the labour force, about 60k was due to youths aged 25-54. That may suggest a seasonal adjustment challenge on the timing of the school year transition.
The labour force shrinkage was primarily driven by two things that suggest a heavy role played by the supply side of the labour force in driving the jobs weakness: those who did not want work, and sickies. While seasonally unadjusted, Statcan provides a breakdown of the reasons behind why people were not looking for work by month (here). This September brought forward the third biggest increase in the number of people not in the labour force because they were not searching for work when comparing like months of September (chart 3). There was also the second highest jump in those not in the labour force due to sickness on record comparing like months of September again because it is not seasonally adjusted at source (chart 4). Having flown and been in many client meetings shaking hands with folks I can confirm there are a lot of sick folks out there!
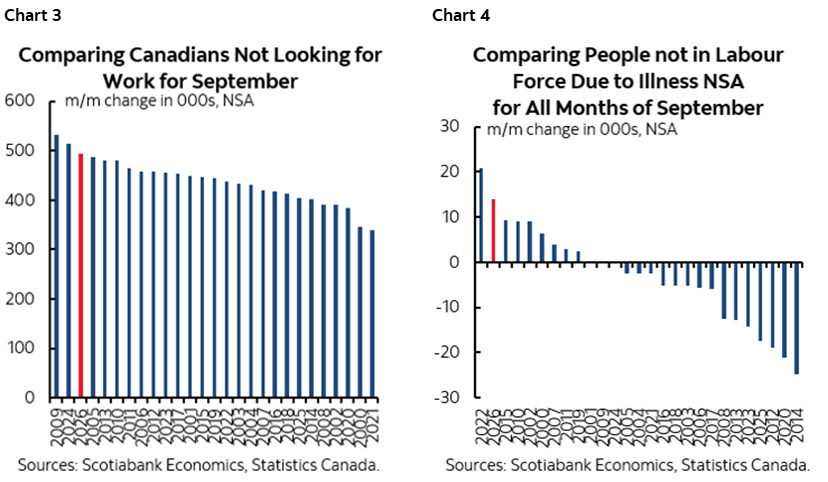
Chart 5 further emphasizes the supply side point—there were deeply unusual contractions in the labour force
Public sector payrolls shrank by 70k jobs while private sector payroll positions increased by 24k. The lost jobs in the public sector were not so much in public administration (-2.8k) versus concentrated within the 35k fewer education sector jobs and 23k fewer jobs in health care and social assistance.
I drew on AI tools to estimate that the sum total of job cut announcements across nationwide school boards and hospitals over recent months has been about 2½ thousand—nowhere close to the 58k lost education and health jobs according to Statcan’s report.
To be sure, the rest of the report wasn’t great, but the net job reduction outside of health, education and the civil service came to about -7k in September and primarily due to self-employed positions that are often marred by low quality data.
What frankly surprises me somewhat here is that the weakness wasn’t concentrated in sectors directly affected by the escalation of bilateral tariff wars, or at least not very much. I didn’t’ expect much of that, but certainly didn’t see signs of a mass culling of public sector workers.
So what gives? Always be careful toward sampling risk. Recall that the 100,000 or so respondents each month represent about ½% of total employment and the total size of the labour force in Canada. It’s a small sample with high margin of error.
The supply side may indicate a problem having more to do with reports of worker shortages in health care and education.
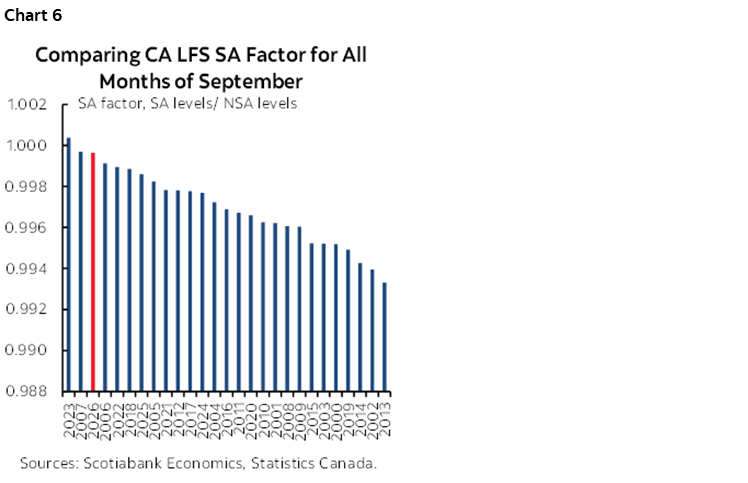
While a higher than usual seasonal adjustment factor was applied this month, the seasonally unadjusted change in employment was relatively large upon comparing like months of September since this is NSA data (charts 5, 6).
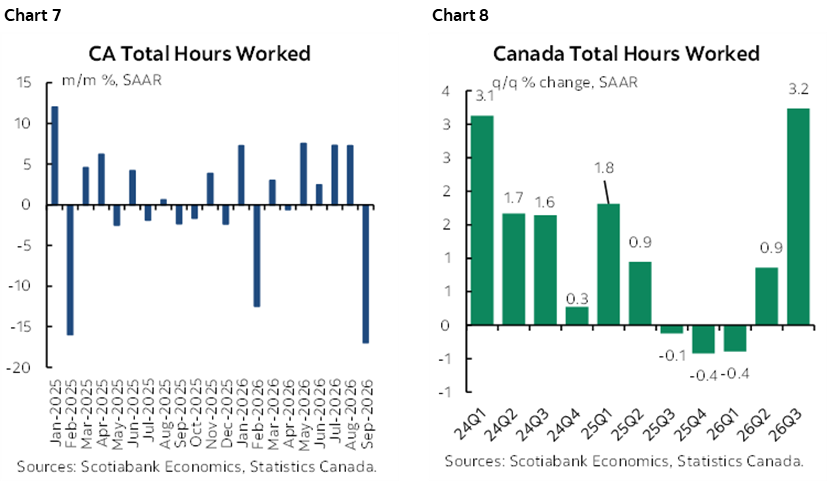
Hours worked also fell sharply in September (chart 7) but were up sharply in Q3 overall (chart 8). That leans toward downside risk in September GDP pending activity readings, but solid upside to Q3 GDP overall since GDP is hours times labour productivity with the latter determined heavily by activity readings.
Wages picked up a bit to 4.7% m/m SAAR in September, reversing much of the prior drop.
See other charts on the next page.
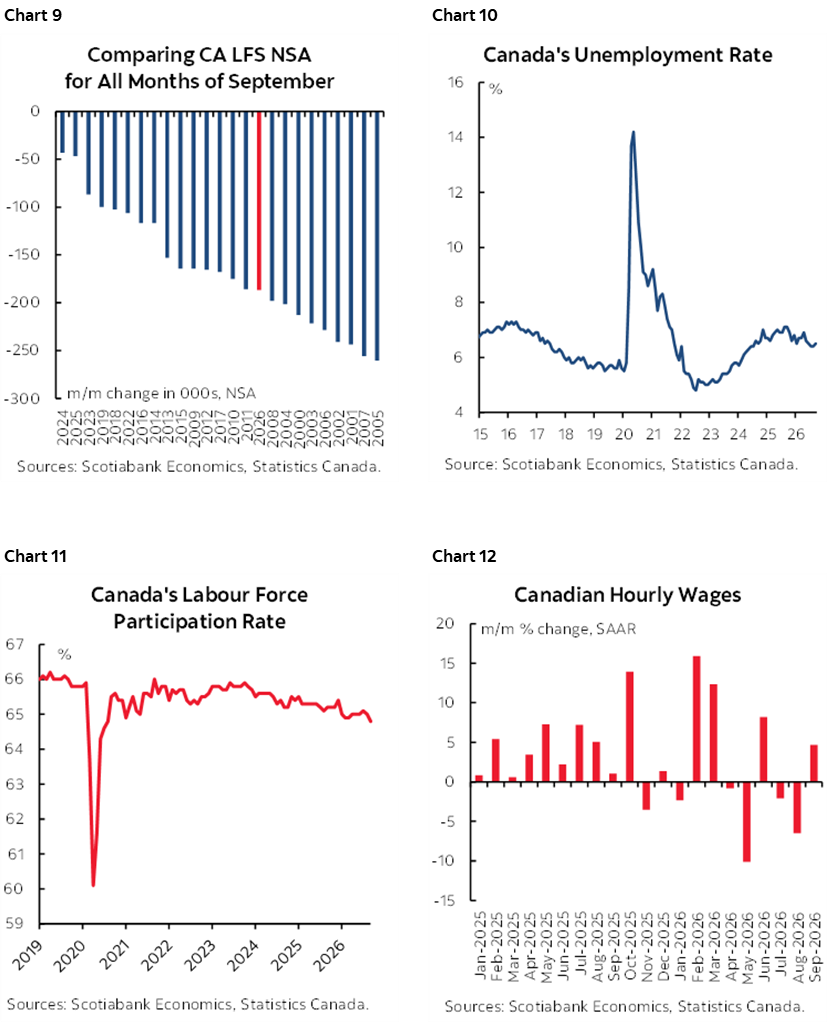
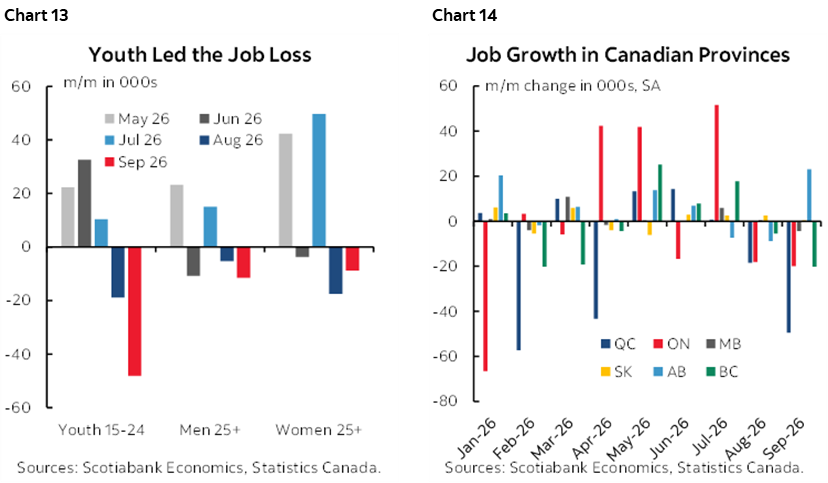
I believe that the BoC should fade this report and remain focused upon its inflation mandate. Core CPI m/m SAAR has been running at 3%+ for four months and all measures of inflation are about on or above their 2% target in y/y or m/m SAAR terms. Inflation expectations are sure to rise when we get the BoC’s surveys in two weeks. The output gap is closing fairly rapidly this year. Fiscal policy and commodity effects are likely to propel growth sharply forward. In all, there is legitimate reason to be concerned about inflation risk. Let’s see what Governor Macklem says next week. Macklem is a notorious dove and so he may seize upon these numbers as cause for patience, but if he leans more heavily toward inflation concerns as we believe he should then today’s dovish market reaction may be vulnerable.
DISCLAIMER
This report has been prepared by Scotiabank Economics as a resource for the clients of Scotiabank. Opinions, estimates and projections contained herein are our own as of the date hereof and are subject to change without notice. The information and opinions contained herein have been compiled or arrived at from sources believed reliable but no representation or warranty, express or implied, is made as to their accuracy or completeness. Neither Scotiabank nor any of its officers, directors, partners, employees or affiliates accepts any liability whatsoever for any direct or consequential loss arising from any use of this report or its contents.
These reports are provided to you for informational purposes only. This report is not, and is not constructed as, an offer to sell or solicitation of any offer to buy any financial instrument, nor shall this report be construed as an opinion as to whether you should enter into any swap or trading strategy involving a swap or any other transaction. The information contained in this report is not intended to be, and does not constitute, a recommendation of a swap or trading strategy involving a swap within the meaning of U.S. Commodity Futures Trading Commission Regulation 23.434 and Appendix A thereto. This material is not intended to be individually tailored to your needs or characteristics and should not be viewed as a “call to action” or suggestion that you enter into a swap or trading strategy involving a swap or any other transaction. Scotiabank may engage in transactions in a manner inconsistent with the views discussed this report and may have positions, or be in the process of acquiring or disposing of positions, referred to in this report.
Scotiabank, its affiliates and any of their respective officers, directors and employees may from time to time take positions in currencies, act as managers, co-managers or underwriters of a public offering or act as principals or agents, deal in, own or act as market makers or advisors, brokers or commercial and/or investment bankers in relation to securities or related derivatives. As a result of these actions, Scotiabank may receive remuneration. All Scotiabank products and services are subject to the terms of applicable agreements and local regulations. Officers, directors and employees of Scotiabank and its affiliates may serve as directors of corporations.
Any securities discussed in this report may not be suitable for all investors. Scotiabank recommends that investors independently evaluate any issuer and security discussed in this report, and consult with any advisors they deem necessary prior to making any investment.
This report and all information, opinions and conclusions contained in it are protected by copyright. This information may not be reproduced without the prior express written consent of Scotiabank.
™ Trademark of The Bank of Nova Scotia. Used under license, where applicable.
Scotiabank, together with “Global Banking and Markets”, is a marketing name for the global corporate and investment banking and capital markets businesses of The Bank of Nova Scotia and certain of its affiliates in the countries where they operate, including; Scotiabank Europe plc; Scotiabank (Ireland) Designated Activity Company; Scotiabank Inverlat S.A., Institución de Banca Múltiple, Grupo Financiero Scotiabank Inverlat, Scotia Inverlat Casa de Bolsa, S.A. de C.V., Grupo Financiero Scotiabank Inverlat, Scotia Inverlat Derivados S.A. de C.V. – all members of the Scotiabank group and authorized users of the Scotiabank mark. The Bank of Nova Scotia is incorporated in Canada with limited liability and is authorised and regulated by the Office of the Superintendent of Financial Institutions Canada. The Bank of Nova Scotia is authorized by the UK Prudential Regulation Authority and is subject to regulation by the UK Financial Conduct Authority and limited regulation by the UK Prudential Regulation Authority. Details about the extent of The Bank of Nova Scotia's regulation by the UK Prudential Regulation Authority are available from us on request. Scotiabank Europe plc is authorized by the UK Prudential Regulation Authority and regulated by the UK Financial Conduct Authority and the UK Prudential Regulation Authority.
Scotiabank Inverlat, S.A., Scotia Inverlat Casa de Bolsa, S.A. de C.V, Grupo Financiero Scotiabank Inverlat, and Scotia Inverlat Derivados, S.A. de C.V., are each authorized and regulated by the Mexican financial authorities.
Not all products and services are offered in all jurisdictions. Services described are available in jurisdictions where permitted by law.