- Canada added a modest number of jobs in line with expectations
- The details were soft
- Wage growth cooled, but the trend remains hot
- Public sector hiring has run amok
- Markets are leaning toward a BoC cut in April...
- ...that would embolden governments to spend more during Budget season...
- ...and light up the Spring housing market yet again...
- ....making sustainable achievement of 2% inflation nearly impossible
- Canada jobs m/m 000 / UR %, SA:
- Actual: 17.5 / 5.7
- Consensus: 25 / 5.6
- Scotia:15 / 5.6
- Prior: 63.8 / 5.5
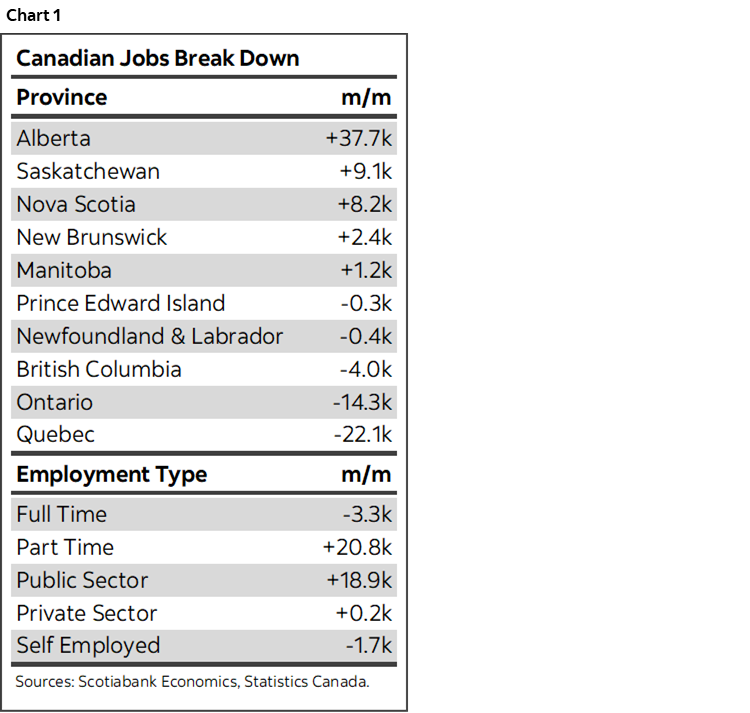
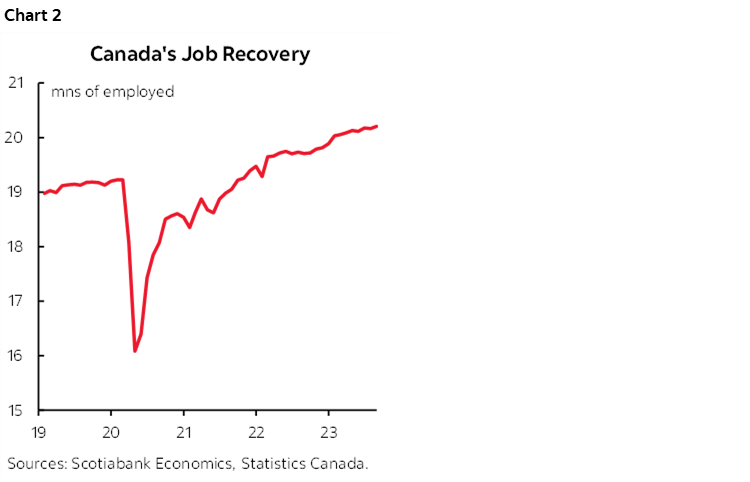
Canada’s job market cooled across a variety of readings, but hardly turned in an awful performance last month. I think markets are mispricing the Bank of Canada in the wake of it all and would lean against such expectations. Chart 1 provides some details. Chart 2 shows that the level of employment remains very high.
BET AGAINST MARKET PRICING FOR THE BANK OF CANADA
Given the market response you’d have thought that both countries shed a ginormous number of jobs to justify the kind of moves we’re seeing on the back of the results. US yields are down by around 13–15bps across the curve, and most of Canada’s curve is down 11–14–15bps. Fed fund futures added an extra 17bps to easing bets by the end of next year.
Canadian OIS markets are now leaning toward a rate cut as soon as the April 2023 MPR after a 10bps drop in contract pricing for that month’s meeting with a full cut by June.
We’ll see, but just as the way up in bond yields was likely an overshoot as I’ve tended to argue, I think the way down in BoC meeting pricing is getting exaggerated in the opposite direction by becoming too richly priced in favour of nearer term easing.
For the BoC to cut by April would mean setting up such expectations with clearer guidance on the path between now and then. That path would probably have to be set up by the BoC in advance which would mean further rallies in yields through to the key 5-year benchmark that drives much of the mortgage market on top of the rally of over 60bps since the peak in early October.
Setting up and delivering cuts on that timeline would embolden governments to spend more in their Winter budgets on the assumption that interest expense would be looking more favourable. More spending means more inflation induced by fiscal policy when free spending governments don’t need that signal.
Such action by the BoC would also light up the Spring housing market once more in which case the BoC would make the same mistake they made with the premature pause last January, only bigger this time. Immigration remains excessive amid very little supply and we want to ignite interest-sensitive demand on top of it all?
The net effects would reignite inflationary pressures and either stop cuts in their tracks earlier than otherwise if delivered too early, or motivate a return to tightening along a volatile path. In fact, I’m of the view that if markets continue to move this way then tha easing of financial conditions could prompt the BoC to poke markets in the eye with another hike as a reminder they won’t be pushed before we have much clearer signs that inflation is coming down in line with target. At a very minimum, I just can’t see the BoC cutting in line with market pricing at this moment.
DETAILS
Canada added about 18k jobs last month which was in line with my guess of 15k and a little lower than the median consensus estimate of 25k. Given that the 95% confidence interval around the estimate if +/-57k all we can say is that 95 times out of 100 in repeated sampling of the job market through the Labour Force Survey we would have seen it spit out a number somewhere between a drop of 39k and a rise of 75k. Therefore everyone was right, after considering the noise factor.
All of the gain was in part-time jobs (+20.8k) as full-time jobs were little changed (-3.3k).
Goods sectors added 7.5k while services added 10k.
Public sector payrolls were up by 19k while private sector payrolls were flat.
Self-employed jobs were flat (-1.7k).
The unemployment rate ticked higher to 5.7% from 5.5% because the labour force expanded by 58k and hence in excess of job growth. The participation rate held steady at 65.6% indicating a still-tight job market (chart 3).
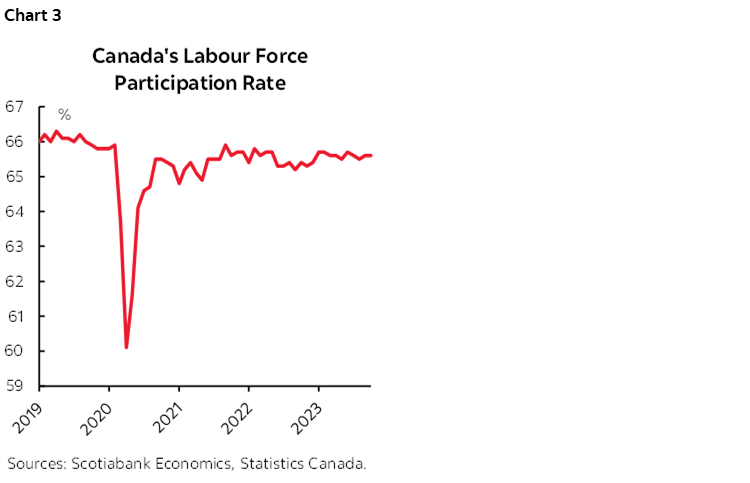
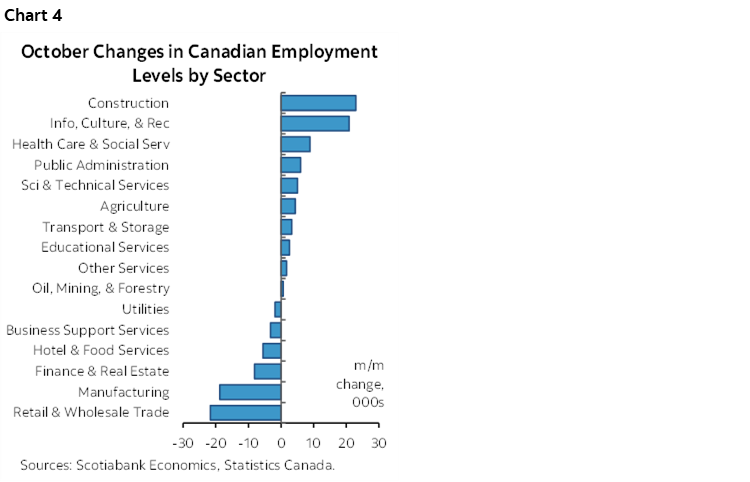
Chart 4 shows the breakdown of jobs created by sector. The main upsides included a 23k rise in construction jobs and 21k more in info/culture/recreation sectors. The main downsides were in retail/wholesale that shed 22k jobs and 19k fewer manufacturing jobs.
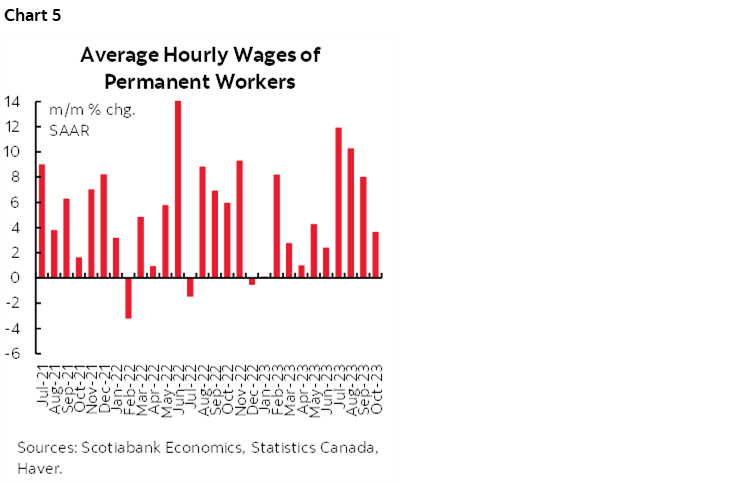
Wage growth decelerated but remains hot on a trend basis. Wage growth eased to 3.7% m/m SAAR in October which remains almost double the BoC’s 2% target. It follows gains of 12% in July, 10.3% in August and 8% in September (chart 5). The three-month smoothed moving average is 7.3%.
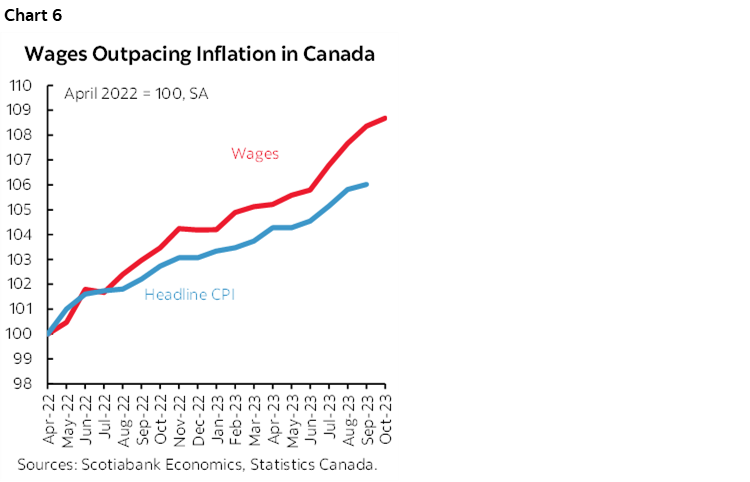
Trend wage growth continues to vastly outpace trend inflation (chart 6), let alone awful Canadian productivity.
Hours worked stalled in October (0% m/m SA). This follows a dip of 0.2% m/m in September. Hours are tracking no growth (0.2% q/q SAAR) in Q4 (chart 7).
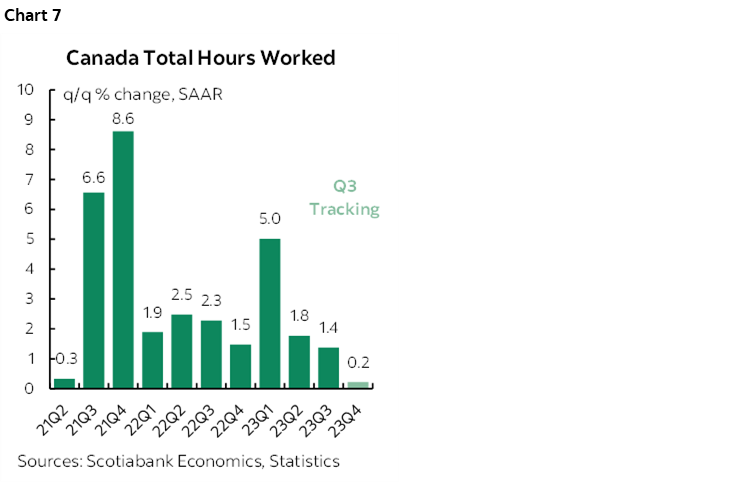
It’s early in terms of tracking Q4, but barring a surge in Canadian productivity which seems a stretch, the weakness in hours suggests that Q4 GDP could be tracking little change over Q3. This is because GDP is an identity defined as hours worked in aggregate times labour productivity with the latter defined as output per hour worked.
OTHER OBSERVATIONS
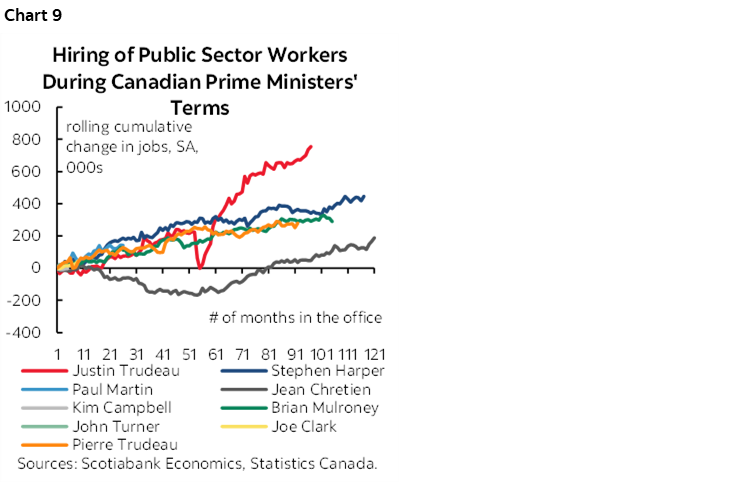
I cannot believe the extent to which governments have allowed public sector payrolls to become so bloated and this month’s report fans that view.
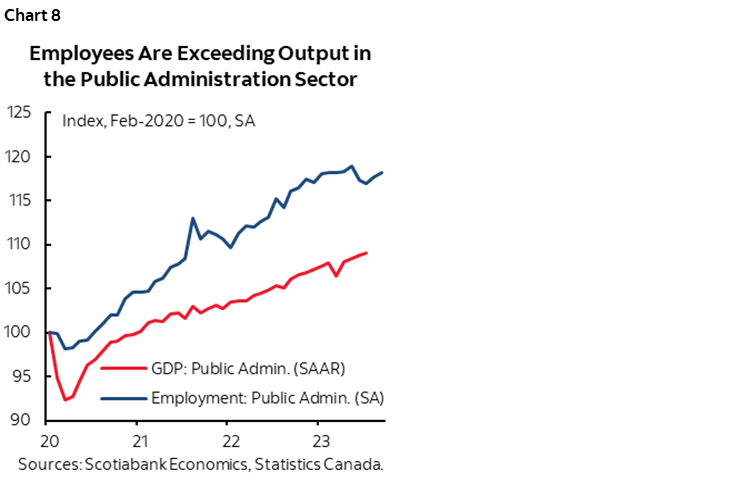
Given that public sector employment drove the gain this month, it might be worth revisiting the productivity connection. See chart 8. Civil service employment has soared far in excess of output measured in the GDP accounts.
Public sector employment across all levels of government continues to skyrocket in unprecedented ways compared to prior times (chart 9).
That’s also true of just the public administration component (chart 10).
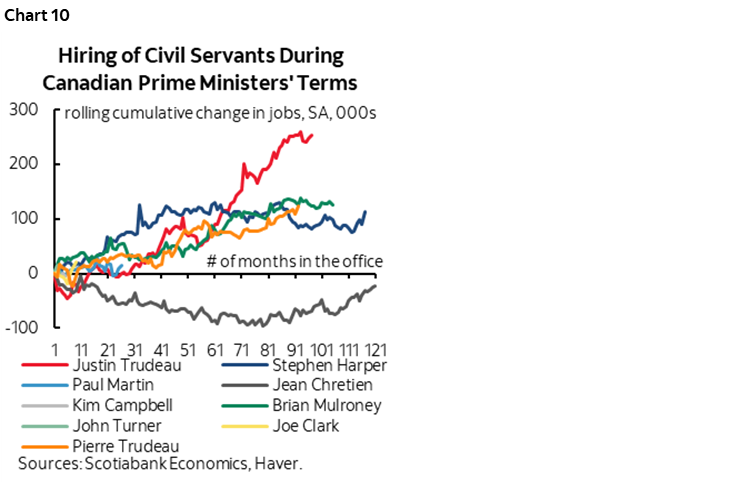
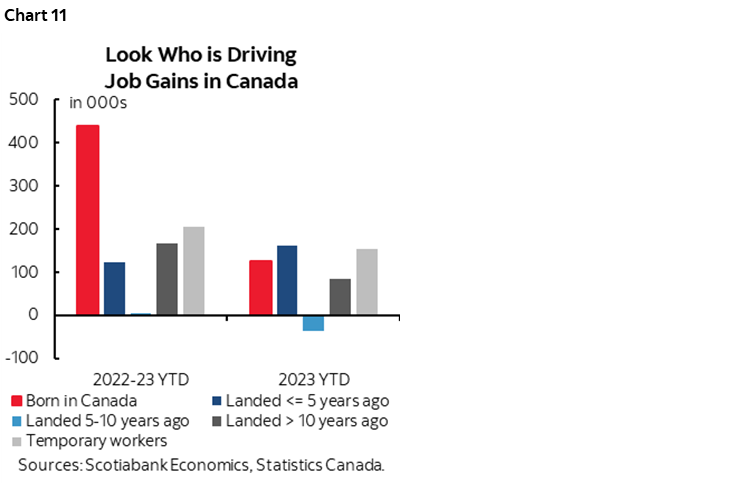
Chart 11 updates the breakdown of job growth by immigration status. There are wide confidence bands around the overall estimates of job growth and probably even wider ones around the breakdowns. Nevertheless, this year is looking to be somewhat more balanced in terms of job growth among those born in Canada and various categories of immigration compared to the whole 2022–23 period during which immigration surged.
DISCLAIMER
This report has been prepared by Scotiabank Economics as a resource for the clients of Scotiabank. Opinions, estimates and projections contained herein are our own as of the date hereof and are subject to change without notice. The information and opinions contained herein have been compiled or arrived at from sources believed reliable but no representation or warranty, express or implied, is made as to their accuracy or completeness. Neither Scotiabank nor any of its officers, directors, partners, employees or affiliates accepts any liability whatsoever for any direct or consequential loss arising from any use of this report or its contents.
These reports are provided to you for informational purposes only. This report is not, and is not constructed as, an offer to sell or solicitation of any offer to buy any financial instrument, nor shall this report be construed as an opinion as to whether you should enter into any swap or trading strategy involving a swap or any other transaction. The information contained in this report is not intended to be, and does not constitute, a recommendation of a swap or trading strategy involving a swap within the meaning of U.S. Commodity Futures Trading Commission Regulation 23.434 and Appendix A thereto. This material is not intended to be individually tailored to your needs or characteristics and should not be viewed as a “call to action” or suggestion that you enter into a swap or trading strategy involving a swap or any other transaction. Scotiabank may engage in transactions in a manner inconsistent with the views discussed this report and may have positions, or be in the process of acquiring or disposing of positions, referred to in this report.
Scotiabank, its affiliates and any of their respective officers, directors and employees may from time to time take positions in currencies, act as managers, co-managers or underwriters of a public offering or act as principals or agents, deal in, own or act as market makers or advisors, brokers or commercial and/or investment bankers in relation to securities or related derivatives. As a result of these actions, Scotiabank may receive remuneration. All Scotiabank products and services are subject to the terms of applicable agreements and local regulations. Officers, directors and employees of Scotiabank and its affiliates may serve as directors of corporations.
Any securities discussed in this report may not be suitable for all investors. Scotiabank recommends that investors independently evaluate any issuer and security discussed in this report, and consult with any advisors they deem necessary prior to making any investment.
This report and all information, opinions and conclusions contained in it are protected by copyright. This information may not be reproduced without the prior express written consent of Scotiabank.
™ Trademark of The Bank of Nova Scotia. Used under license, where applicable.
Scotiabank, together with “Global Banking and Markets”, is a marketing name for the global corporate and investment banking and capital markets businesses of The Bank of Nova Scotia and certain of its affiliates in the countries where they operate, including; Scotiabank Europe plc; Scotiabank (Ireland) Designated Activity Company; Scotiabank Inverlat S.A., Institución de Banca Múltiple, Grupo Financiero Scotiabank Inverlat, Scotia Inverlat Casa de Bolsa, S.A. de C.V., Grupo Financiero Scotiabank Inverlat, Scotia Inverlat Derivados S.A. de C.V. – all members of the Scotiabank group and authorized users of the Scotiabank mark. The Bank of Nova Scotia is incorporated in Canada with limited liability and is authorised and regulated by the Office of the Superintendent of Financial Institutions Canada. The Bank of Nova Scotia is authorized by the UK Prudential Regulation Authority and is subject to regulation by the UK Financial Conduct Authority and limited regulation by the UK Prudential Regulation Authority. Details about the extent of The Bank of Nova Scotia's regulation by the UK Prudential Regulation Authority are available from us on request. Scotiabank Europe plc is authorized by the UK Prudential Regulation Authority and regulated by the UK Financial Conduct Authority and the UK Prudential Regulation Authority.
Scotiabank Inverlat, S.A., Scotia Inverlat Casa de Bolsa, S.A. de C.V, Grupo Financiero Scotiabank Inverlat, and Scotia Inverlat Derivados, S.A. de C.V., are each authorized and regulated by the Mexican financial authorities.
Not all products and services are offered in all jurisdictions. Services described are available in jurisdictions where permitted by law.