- Canada heaped on explosive job growth with solid details
- It’s the report the BoC has been dreaming about…
- ...as it fits the narrative of a Spring and Summer rebound
- Markets added to BoC hike pricing, CAD slipped as USD strength dominated
- Canadian jobs m/m 000s / UR %, SA, May:
- Actual: 87.8 / 6.6
- Scotia: 25 / 6.9
- Consensus: 10 / 6.9
- Prior: -17.7 / 6.9
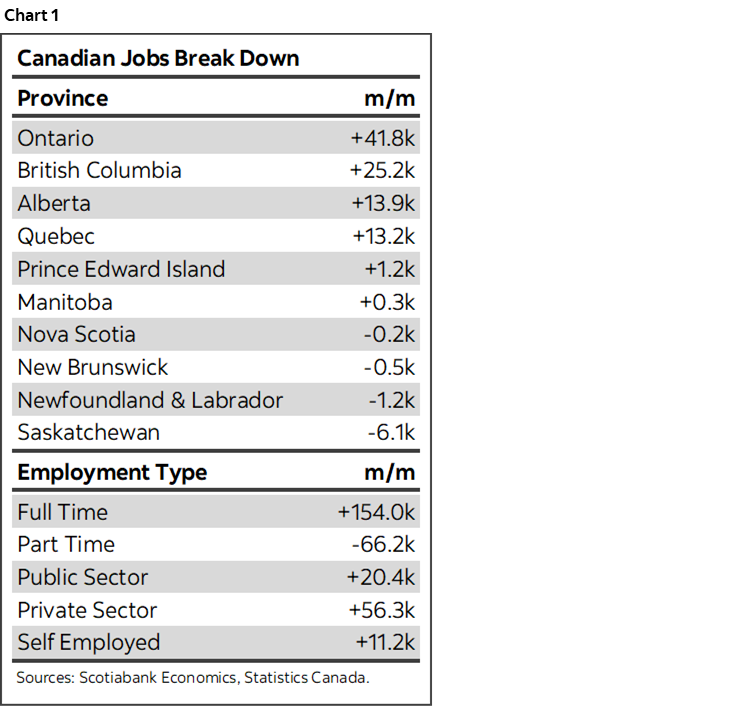
Canada’s job market came roaring back to life in May. This is the jobs report that the Bank of Canada has been dreaming about as they will heave a big sigh of relief to see further signs of a Q2 rebound in the works. Scotia’s estimate was at the high end of consensus but even then the gain blew past all of our estimates. See chart 1 for some initial summary stats.
BOC HIKE PRICING GOT A BOOST
Markets reacted by pushing bond yields sharply higher with the Canada 2s yield up 10bps on the day in a bear flattener curve move. Markets added a bit to year-end hike pricing with about 35bps of a hike priced. It’s just one report, but rebounding growth, importing a positive commodity shock, upside risk to inflation, fiscal stimulus, and traction on trade negotiations could well give rise to our longstanding hike call this year.
The Canadian dollar is the second strongest performer among major crosses in the aftermath with only USD strength rivalling it following the large gain in nonfarm payrolls.
ROBUST DETAILS
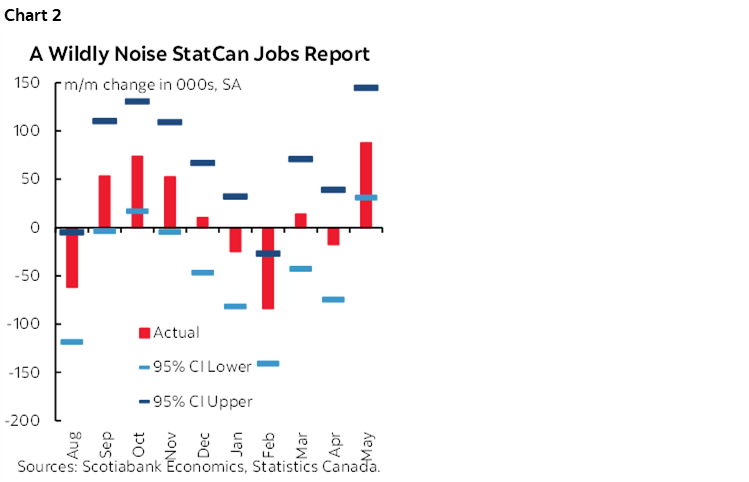
Canada gained 88k jobs in May and the details were robust.
Even by the standards of a notoriously noisy report this was still a strong reading; chart 2 shows the upper and lower confidence bands that reflect the survey’s statistical noise and how a sizeable gain would have been registered notwithstanding wide confidence bands.
For starters, it was all full-time (+154k) with part-time jobs down 66k which is positive in an overall macro sense to see the rotation of employment toward more stable and typically higher paying jobs and with more paid hours.
Private payrolls led the way (+56k) with public payrolls up 20.4k and self-employed gained 11.2k.
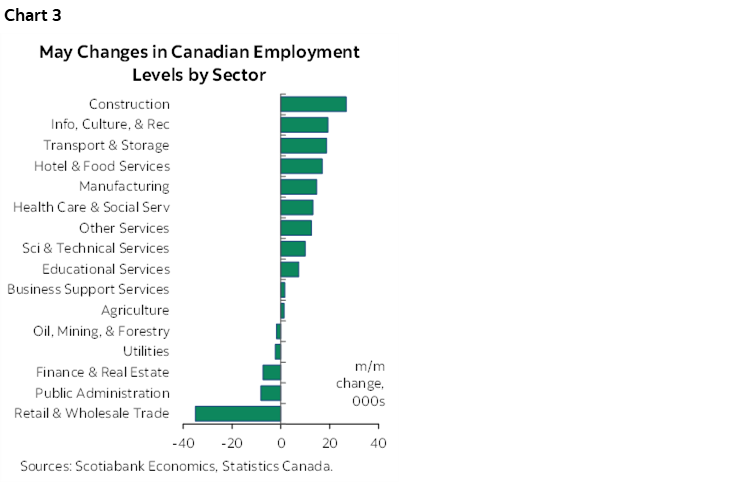
Chart 3 shows that there was significant sector breadth to the hiring. Construction jobs led the rebound which is a good sign for a Spring construction rebound. Travel and recreation related jobs were second and fourth on the list of sector drivers. Retail/wholesale was the lone sizeable drag (-35k) entirely due to retail sector.
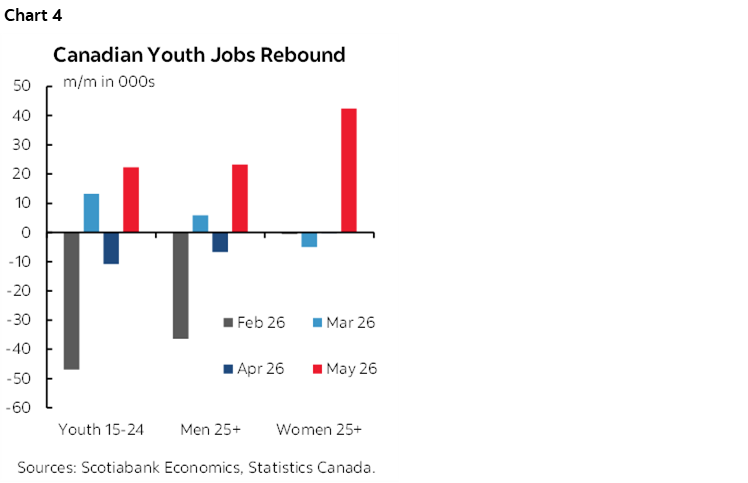
Youths bounced back with a gain of 22k jobs (chart 4). Tell that to your kid(s) if they say they can’t find summer jobs!
The labour force only expanded by 3.8k and so that’s why the unemployment rate fell by three-tenths to 6.6% in light of the strong gain in employment.
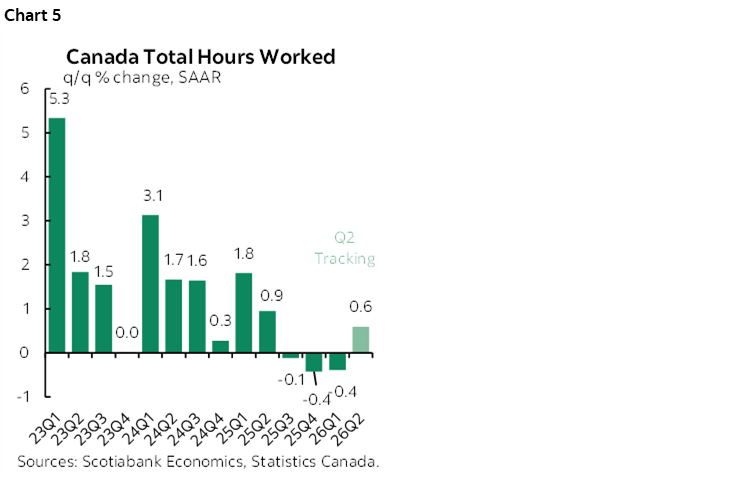
Hours worked were up by a very strong 0.6% m/m SA in May after being flat in April. For Q2 overall, hours are tracking a gain of 0.6% q/q SAAR (chart 5). Since GDP is hours times labour productivity this is a good sign for Q2 GDP alongside the 0.4% m/m rise we saw in April.
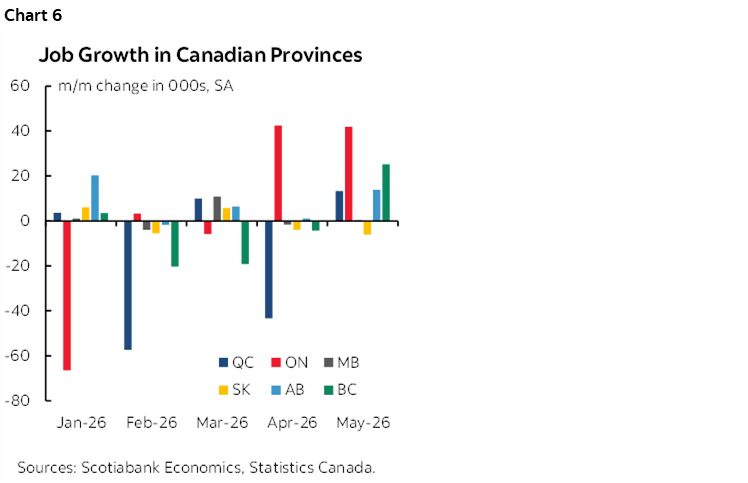
By province, the standouts were Ontario (+42k), BC (+25k), Alberta (+14k) and Quebec (+13k). Chart 6. If Ontario is at the center of trade policy risks holding back jobs then someone forgot to tell employers given that province’s large back-to-back gains. I think this fits the narrative of CUSMA carve-outs and CAD depreciation combined with decent US growth providing understated supports to the province.
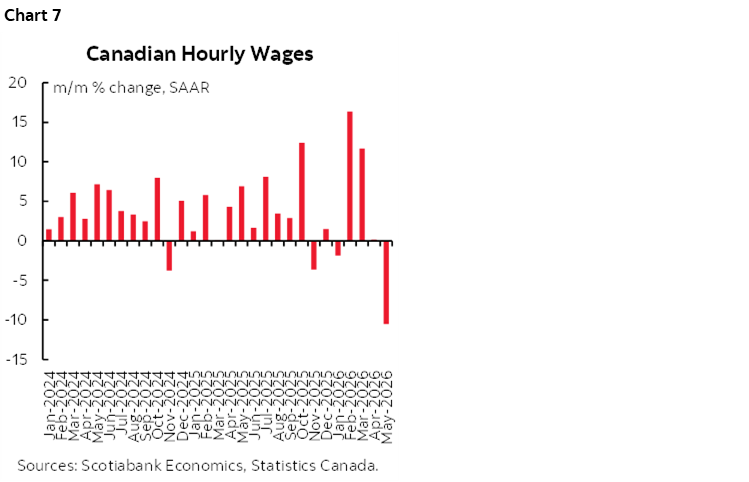
There is something wonky going on with Canadian wages (chart 7). Wage growth slipped by 10.5% m/m SAAR in May after being flat in April (+0.2%) but following gains of 11.7% in March and 16.4% in February. The effects drove the year-over-year rate of growth in wages of permanent employees down to 3.2% from 4.8% in a combination of the monthly change and a shift in year-ago base effects.
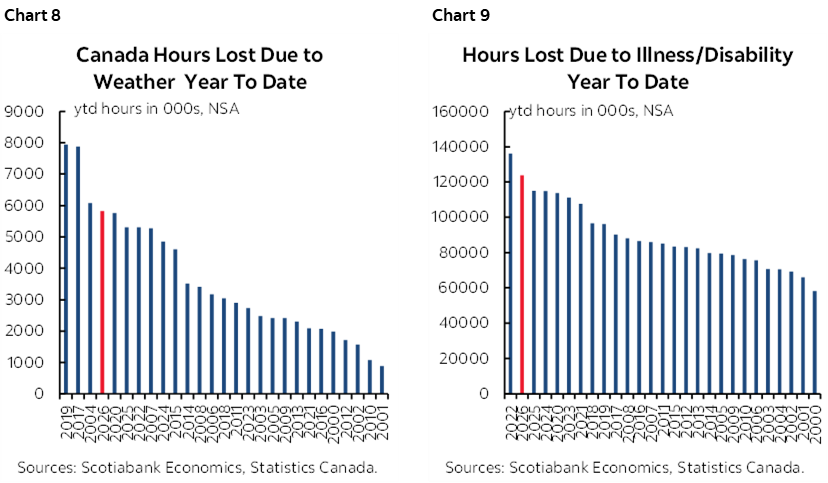
Even by Canadian standards this year has been pretty awful in terms of weather and seasonal sickness. Charts 8 and 9 show hours worked that were lost due to weather and sickness on a year-to-date basis. Keep this in mind in terms of what contributed to weaker activity in Q1 and the potential for a rebound into Summer.
DISCLAIMER
This report has been prepared by Scotiabank Economics as a resource for the clients of Scotiabank. Opinions, estimates and projections contained herein are our own as of the date hereof and are subject to change without notice. The information and opinions contained herein have been compiled or arrived at from sources believed reliable but no representation or warranty, express or implied, is made as to their accuracy or completeness. Neither Scotiabank nor any of its officers, directors, partners, employees or affiliates accepts any liability whatsoever for any direct or consequential loss arising from any use of this report or its contents.
These reports are provided to you for informational purposes only. This report is not, and is not constructed as, an offer to sell or solicitation of any offer to buy any financial instrument, nor shall this report be construed as an opinion as to whether you should enter into any swap or trading strategy involving a swap or any other transaction. The information contained in this report is not intended to be, and does not constitute, a recommendation of a swap or trading strategy involving a swap within the meaning of U.S. Commodity Futures Trading Commission Regulation 23.434 and Appendix A thereto. This material is not intended to be individually tailored to your needs or characteristics and should not be viewed as a “call to action” or suggestion that you enter into a swap or trading strategy involving a swap or any other transaction. Scotiabank may engage in transactions in a manner inconsistent with the views discussed this report and may have positions, or be in the process of acquiring or disposing of positions, referred to in this report.
Scotiabank, its affiliates and any of their respective officers, directors and employees may from time to time take positions in currencies, act as managers, co-managers or underwriters of a public offering or act as principals or agents, deal in, own or act as market makers or advisors, brokers or commercial and/or investment bankers in relation to securities or related derivatives. As a result of these actions, Scotiabank may receive remuneration. All Scotiabank products and services are subject to the terms of applicable agreements and local regulations. Officers, directors and employees of Scotiabank and its affiliates may serve as directors of corporations.
Any securities discussed in this report may not be suitable for all investors. Scotiabank recommends that investors independently evaluate any issuer and security discussed in this report, and consult with any advisors they deem necessary prior to making any investment.
This report and all information, opinions and conclusions contained in it are protected by copyright. This information may not be reproduced without the prior express written consent of Scotiabank.
™ Trademark of The Bank of Nova Scotia. Used under license, where applicable.
Scotiabank, together with “Global Banking and Markets”, is a marketing name for the global corporate and investment banking and capital markets businesses of The Bank of Nova Scotia and certain of its affiliates in the countries where they operate, including; Scotiabank Europe plc; Scotiabank (Ireland) Designated Activity Company; Scotiabank Inverlat S.A., Institución de Banca Múltiple, Grupo Financiero Scotiabank Inverlat, Scotia Inverlat Casa de Bolsa, S.A. de C.V., Grupo Financiero Scotiabank Inverlat, Scotia Inverlat Derivados S.A. de C.V. – all members of the Scotiabank group and authorized users of the Scotiabank mark. The Bank of Nova Scotia is incorporated in Canada with limited liability and is authorised and regulated by the Office of the Superintendent of Financial Institutions Canada. The Bank of Nova Scotia is authorized by the UK Prudential Regulation Authority and is subject to regulation by the UK Financial Conduct Authority and limited regulation by the UK Prudential Regulation Authority. Details about the extent of The Bank of Nova Scotia's regulation by the UK Prudential Regulation Authority are available from us on request. Scotiabank Europe plc is authorized by the UK Prudential Regulation Authority and regulated by the UK Financial Conduct Authority and the UK Prudential Regulation Authority.
Scotiabank Inverlat, S.A., Scotia Inverlat Casa de Bolsa, S.A. de C.V, Grupo Financiero Scotiabank Inverlat, and Scotia Inverlat Derivados, S.A. de C.V., are each authorized and regulated by the Mexican financial authorities.
Not all products and services are offered in all jurisdictions. Services described are available in jurisdictions where permitted by law.