- Canadian core inflation accelerated again...
- ...with upward revisions
- As hot as inflation is, wages are even hotter...
- ...meaning that an awful lot has to go right to get BoC cuts by 2024H2
- Markets further reduced pricing for a nearer-term BoC cut
- Central banks will continue to favour data dependence over forecasts
- Canadian CPI m/m SA % / y/y %, December:
- Actual: -0.3 / 3.4
- Scotia: -0.3 / 3.4
- Consensus: 0.3 / 3.4
- Prior: 0.1 / 3.1
- Trimmed mean CPI: 4.8% m/m SAAR / 3.7% y/y from 3.5%
- Weighted median CPI: 4.7% m/m SAAR / 3.6% y/y from 3.6% (revised up from 3.4)
The latest inflation evidence continues to push back against market pricing and some forecasters’ views that the Bank of Canada will be cutting by the March and April meetings. March has been mostly wiped out and April’s cut pricing was further reduced.
Not going to happen folks. I’ve argued for a long time that one should be paying those contracts; doing so would have paid off handsomely by now. In fact, I think an awful lot has to go right from here in order to get the BoC to be cutting by the consensus call for around mid-year or even this year and to this point I just don’t see the required evidence.
Key is that the BoC’s preferred gauges of underlying inflation accelerated again as shown in chart 1. Trimmed mean CPI—that lops off the top and bottom 20% of the CPI basket—landed at 4.8% m/m at a seasonally adjusted and annualized rate. Weighted median CPI—that takes the 50th percentile price—was up by 4.7% m/m SAAR. Both readings are far above the BoC’s 2% inflation target and signal no progress toward achieving it any time soon. These are central tendency inflation measures totally unaffected by outlier price changes like mortgage interest.
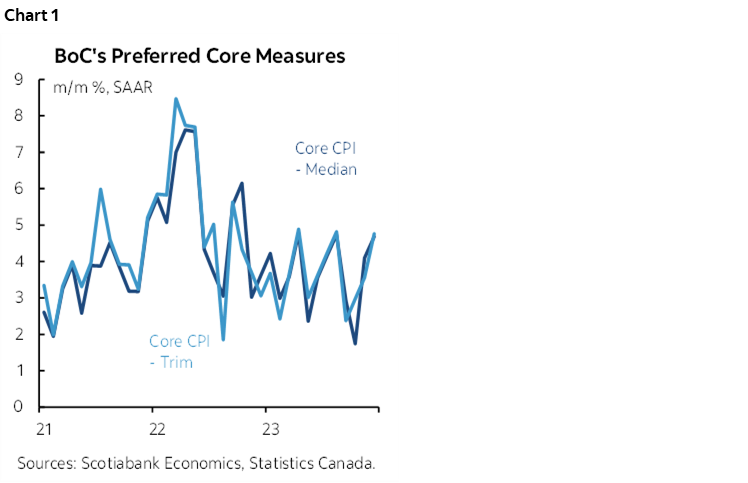
The year-over-year rates also picked up to 3.7% y/y from 3.5% for trimmed mean and to 3.6% y/y for weighted median CPI with the prior month revised up to 3.6% from 3.4%.
There were also material upward revisions to prior months. For example, weighted median CPI in m/m SAAR terms was revised up by 1.2% in September and by 0.6% in November. Trimmed mean was revised up by 0.6% in each of September and October. These revisions provide hotter than previously understood tracking of inflationary pressures prior to December.
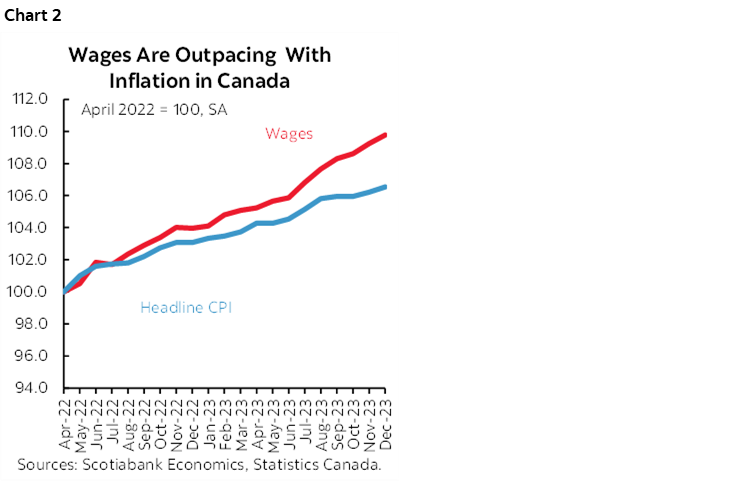
As hot as Canadian underlying inflation appears to be, wage growth remains hotter yet. Chart 2 shows that wage growth has been outpacing inflation for an extended period of time. Add in tumbling productivity. The combination of all of that makes it extraordinarily difficult to imagine the BoC cutting any time soon.
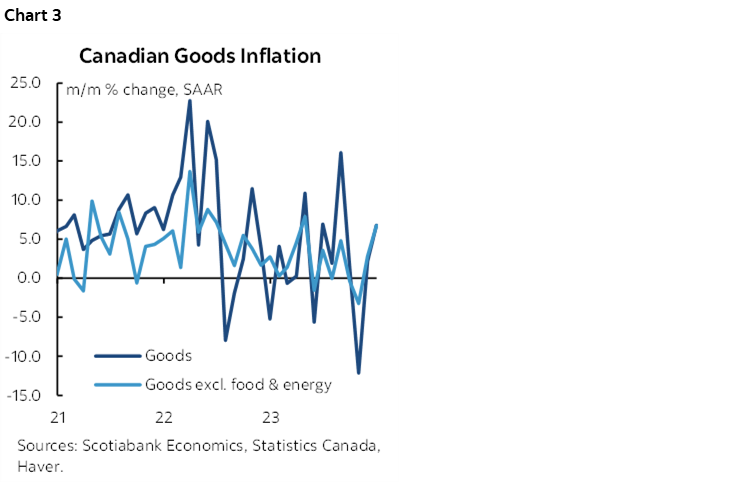
Core goods inflation drove much of the upward pressure in December as CPI ex-food and energy was up by 6.7% m/m SAAR (chart 3).
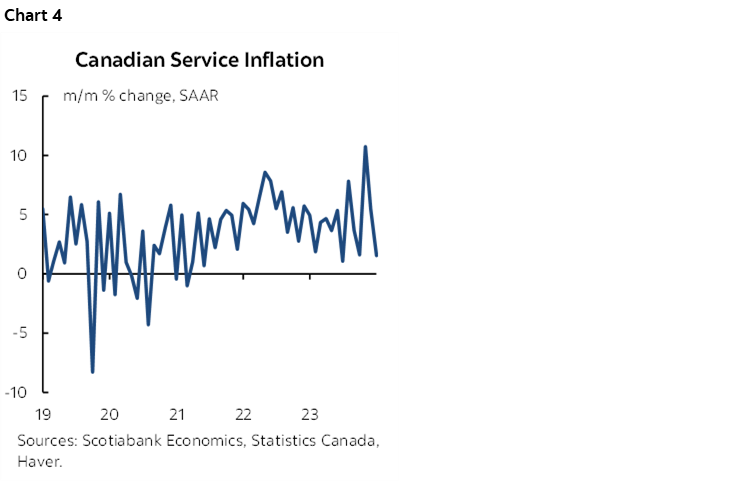
Services inflation ebbed last month but remains very volatile and rather warm on a trend basis (chart 4).
In all, we’re still in an environment in which the executive ranks at central banks are very likely to retain a high degree of mistrust toward what models are forecasting for inflation after their many failures. Instead, they will remain highly data dependent and have comfort to ease only when they have a sustained period of much softer readings that are expected to persist. One cannot have that comfort in Canada to date as inflation risk continues to push higher.
Other Details
Headline CPI fell –0.3% m/m on a seasonally unadjusted basis as expected and that translates into a seasonally adjusted rise of +0.3% m/m. December is normally a down month for seasonal price pressures against which seasonal adjustment factors compensate.
On an SA basis, food was up 0.4% m/m, shelter 0.4, household operations/ furnishing and equipment fell -0.2%, clothing and footwear was up 0.5, health and personal care ticked higher by 0.1, rec/education/reading fell by -1.3, and the so-called 'sins' were up by 0.1%.
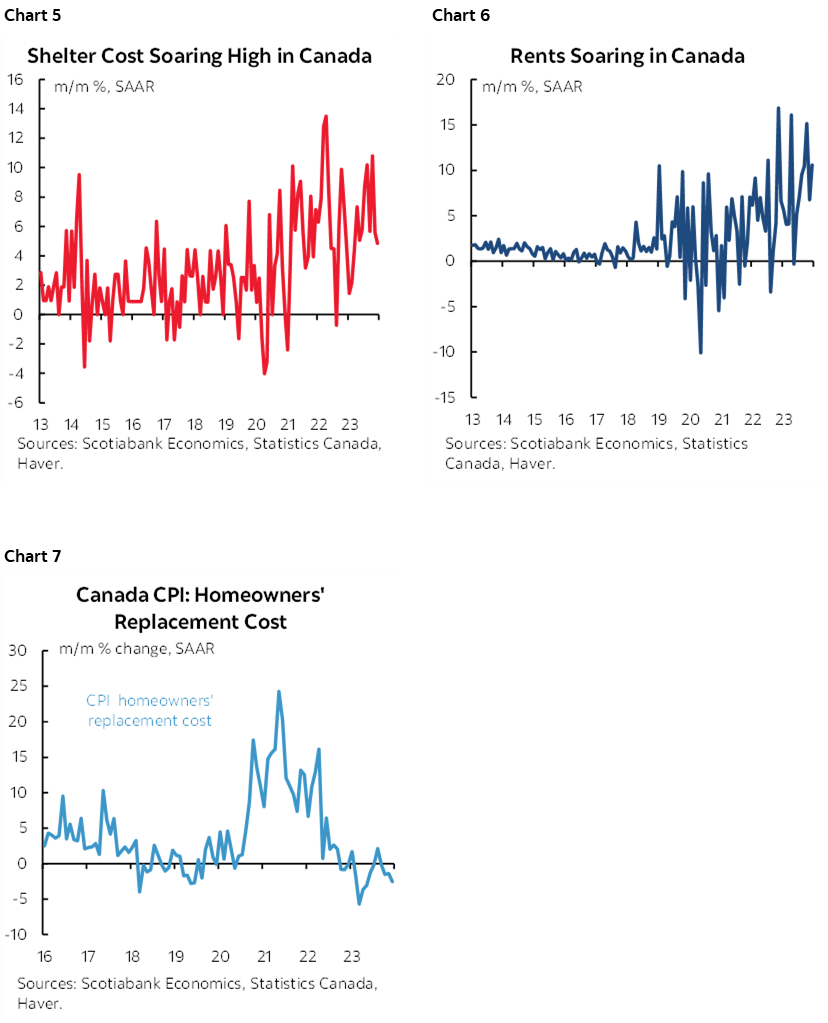
Shelter costs were sharply higher again (chart 5) mainly due to rent (chart 6) as the way Canada captures house prices in CPI was soft again (chart 7). Watch how this evolves in future as the massive surge in excessive immigration transitions from the rental stock into the owned accommodation housing stock as explained and including a chart in my morning note.
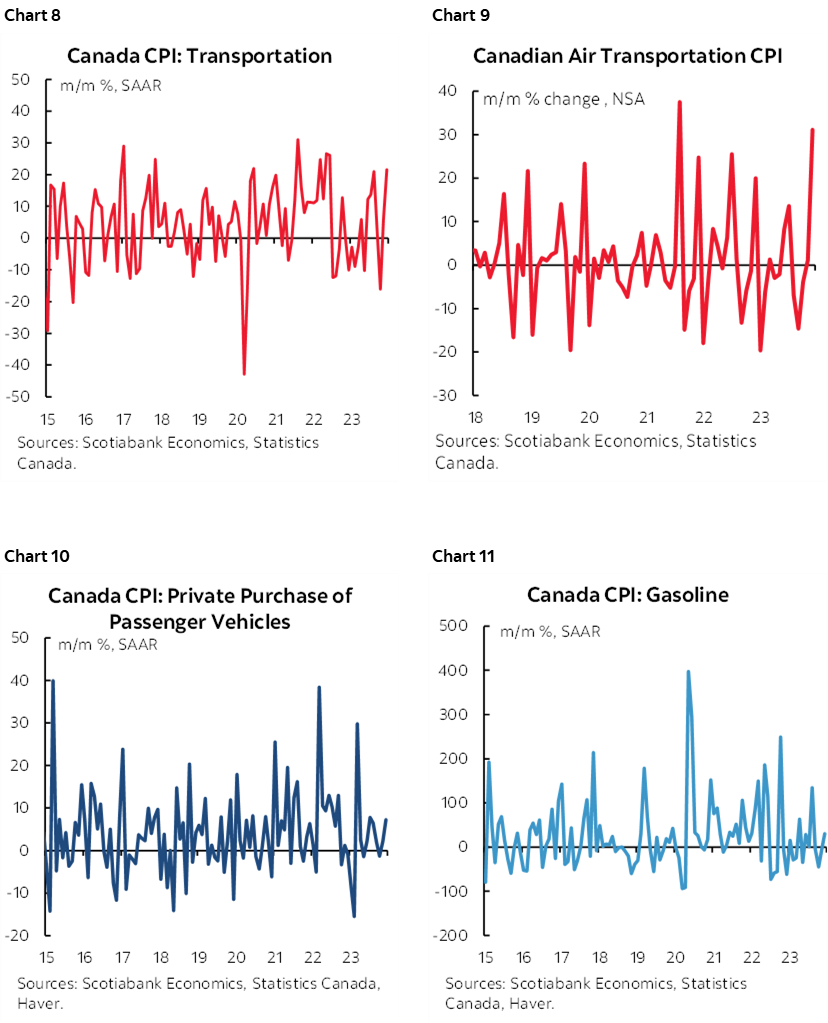
Transportation costs also jumped higher (chart 8) due to a combination of airfare (chart 9), auto prices (chart 10) and gasoline prices (chart 11).
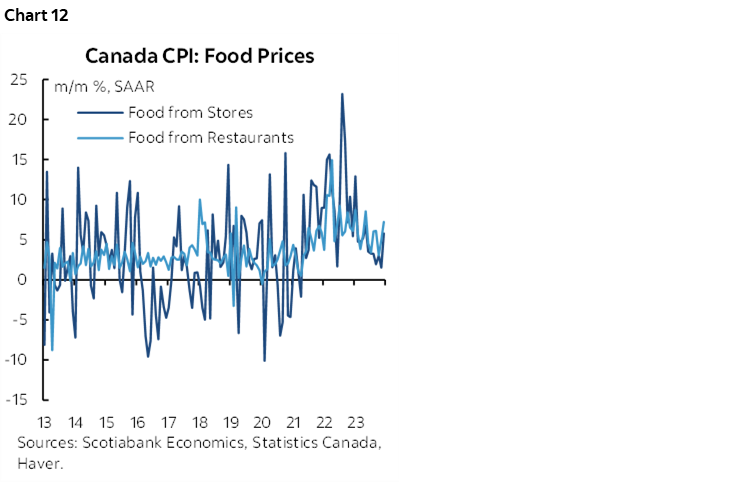
Food price inflation accelerated again (chart 12).
Travel tours and accommodations dragged down the recreation/education/reading category (chart 13).

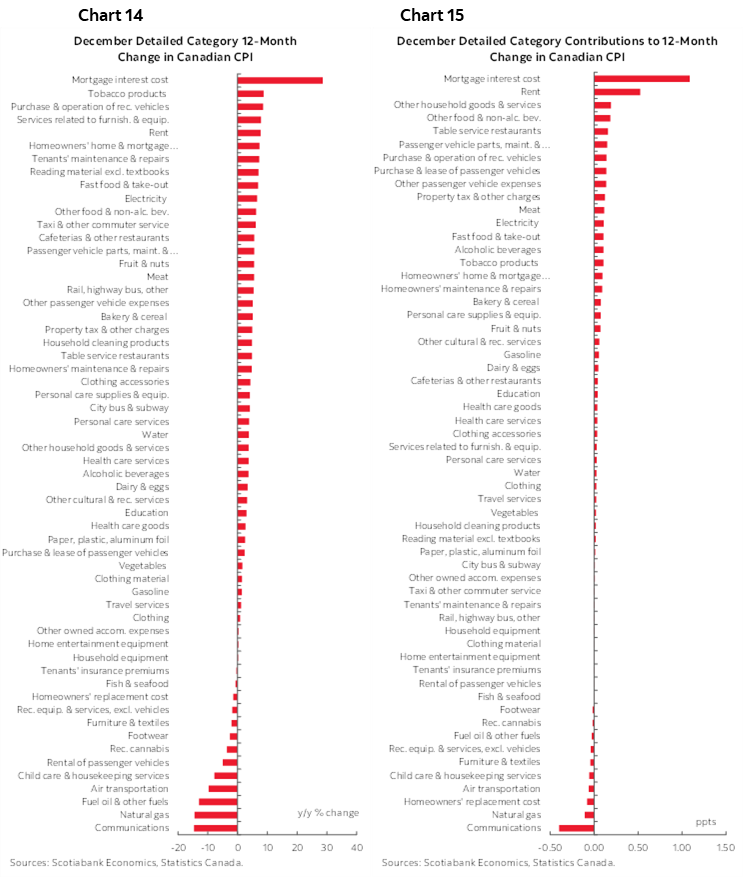
Chart 14 provides a breakdown of the whole CPI basket in year-over-year terms. Chart 15 does the same thing in terms of each component’s weighted contributions.
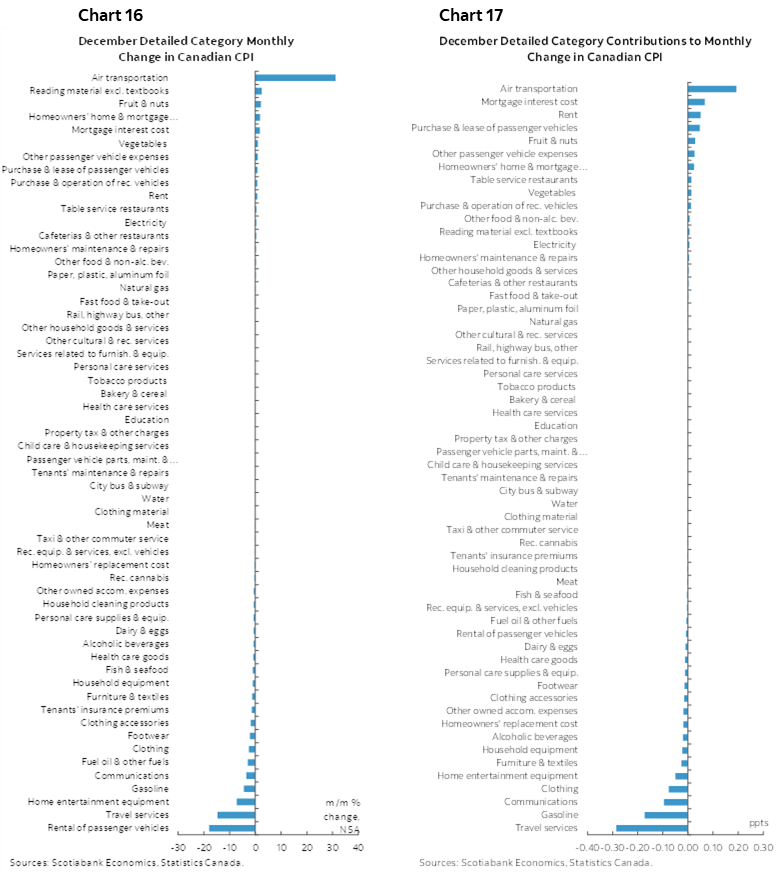
Charts 16 and 17 do the same things for month-over-month inflation.
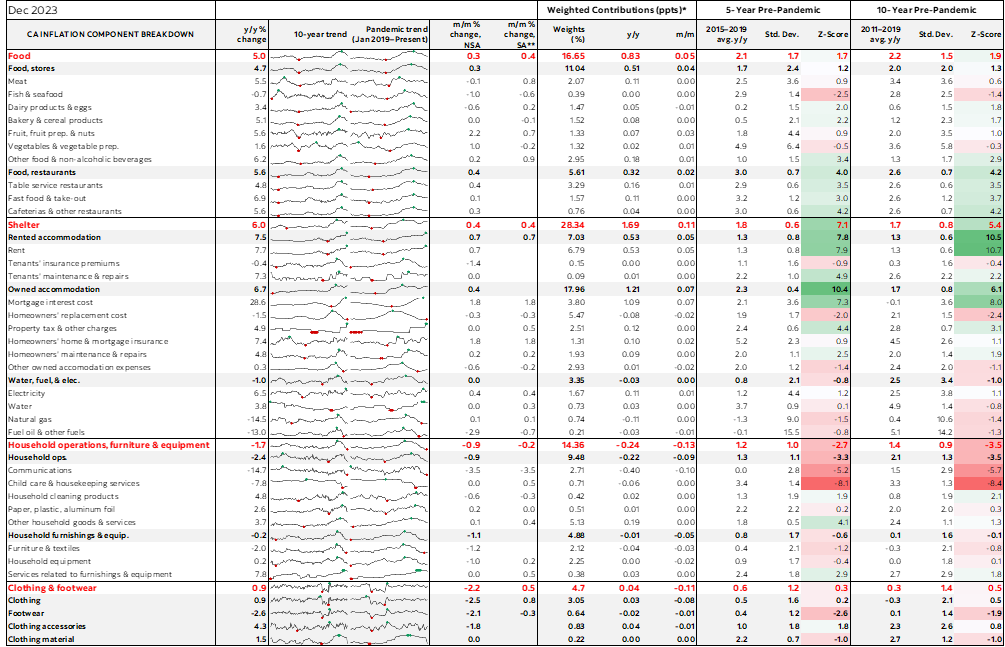
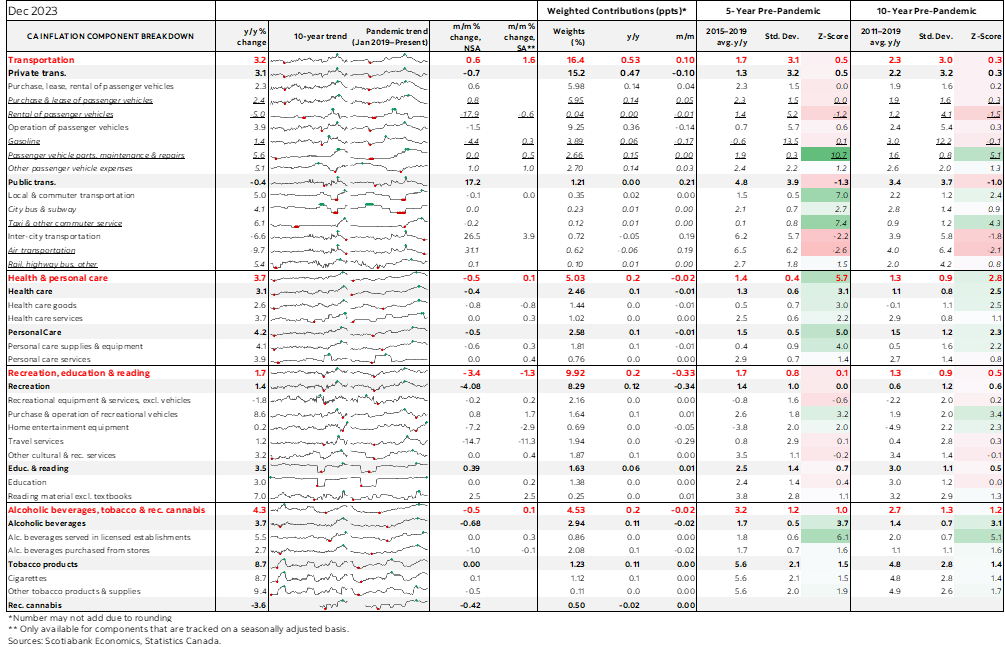
Please also see the accompanying table that provides a more detailed breakdown of the basket and its components including micro charts and z-score measures of deviations from trends.
With thanks as always to Jay Parmar for his research assistance.
DISCLAIMER
This report has been prepared by Scotiabank Economics as a resource for the clients of Scotiabank. Opinions, estimates and projections contained herein are our own as of the date hereof and are subject to change without notice. The information and opinions contained herein have been compiled or arrived at from sources believed reliable but no representation or warranty, express or implied, is made as to their accuracy or completeness. Neither Scotiabank nor any of its officers, directors, partners, employees or affiliates accepts any liability whatsoever for any direct or consequential loss arising from any use of this report or its contents.
These reports are provided to you for informational purposes only. This report is not, and is not constructed as, an offer to sell or solicitation of any offer to buy any financial instrument, nor shall this report be construed as an opinion as to whether you should enter into any swap or trading strategy involving a swap or any other transaction. The information contained in this report is not intended to be, and does not constitute, a recommendation of a swap or trading strategy involving a swap within the meaning of U.S. Commodity Futures Trading Commission Regulation 23.434 and Appendix A thereto. This material is not intended to be individually tailored to your needs or characteristics and should not be viewed as a “call to action” or suggestion that you enter into a swap or trading strategy involving a swap or any other transaction. Scotiabank may engage in transactions in a manner inconsistent with the views discussed this report and may have positions, or be in the process of acquiring or disposing of positions, referred to in this report.
Scotiabank, its affiliates and any of their respective officers, directors and employees may from time to time take positions in currencies, act as managers, co-managers or underwriters of a public offering or act as principals or agents, deal in, own or act as market makers or advisors, brokers or commercial and/or investment bankers in relation to securities or related derivatives. As a result of these actions, Scotiabank may receive remuneration. All Scotiabank products and services are subject to the terms of applicable agreements and local regulations. Officers, directors and employees of Scotiabank and its affiliates may serve as directors of corporations.
Any securities discussed in this report may not be suitable for all investors. Scotiabank recommends that investors independently evaluate any issuer and security discussed in this report, and consult with any advisors they deem necessary prior to making any investment.
This report and all information, opinions and conclusions contained in it are protected by copyright. This information may not be reproduced without the prior express written consent of Scotiabank.
™ Trademark of The Bank of Nova Scotia. Used under license, where applicable.
Scotiabank, together with “Global Banking and Markets”, is a marketing name for the global corporate and investment banking and capital markets businesses of The Bank of Nova Scotia and certain of its affiliates in the countries where they operate, including; Scotiabank Europe plc; Scotiabank (Ireland) Designated Activity Company; Scotiabank Inverlat S.A., Institución de Banca Múltiple, Grupo Financiero Scotiabank Inverlat, Scotia Inverlat Casa de Bolsa, S.A. de C.V., Grupo Financiero Scotiabank Inverlat, Scotia Inverlat Derivados S.A. de C.V. – all members of the Scotiabank group and authorized users of the Scotiabank mark. The Bank of Nova Scotia is incorporated in Canada with limited liability and is authorised and regulated by the Office of the Superintendent of Financial Institutions Canada. The Bank of Nova Scotia is authorized by the UK Prudential Regulation Authority and is subject to regulation by the UK Financial Conduct Authority and limited regulation by the UK Prudential Regulation Authority. Details about the extent of The Bank of Nova Scotia's regulation by the UK Prudential Regulation Authority are available from us on request. Scotiabank Europe plc is authorized by the UK Prudential Regulation Authority and regulated by the UK Financial Conduct Authority and the UK Prudential Regulation Authority.
Scotiabank Inverlat, S.A., Scotia Inverlat Casa de Bolsa, S.A. de C.V, Grupo Financiero Scotiabank Inverlat, and Scotia Inverlat Derivados, S.A. de C.V., are each authorized and regulated by the Mexican financial authorities.
Not all products and services are offered in all jurisdictions. Services described are available in jurisdictions where permitted by law.