- US payrolls smashed expectations
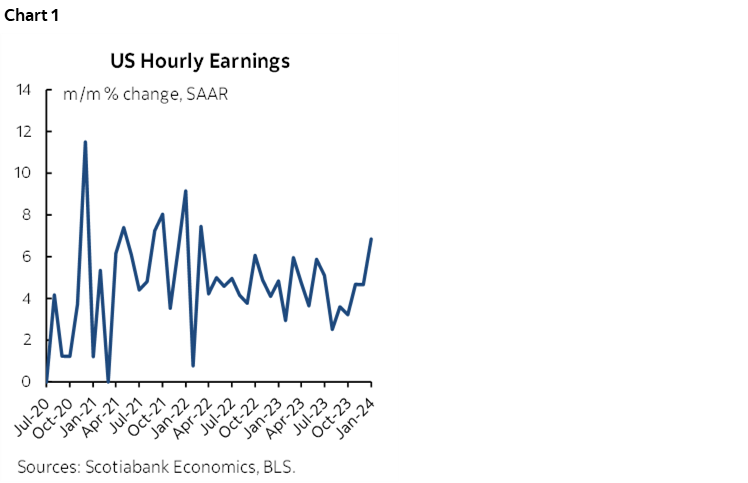
- US wage growth sharply accelerated
- US Q1 GDP will need strong productivity to offset weaker hours
- Bonds got crushed as Fed rate cut expectations were pushed lower and out
- Powell may have to return to his November remark about GDP implications for rates
- US nonfarm payrolls m/m 000s, January, SA:
- Actual: 353 / 3.7
- Scotia: 220 / 3.7
- Consensus: 185 / 3.8
- Prior: 333 (revised up from 216) / 3.7% unchanged
A very strong job market and economy are more than acceptable trade-offs to not expecting rate cuts from the Federal Reserve any time soon.
In fact, if this keeps up, we can’t rule out the return of rate hikes. Either way, as I have argued for a long time—but with rising conviction—I think markets continue to price rate cuts to be far too early and too large.
The US job market entered 2024 by smashing expectations, especially all the stridently worded headlines that were sure the numbers would disappoint if not even turn negative because of weather and annual revisions. Combined with the early read on Q1 GDP ‘nowcasts,’ this overall set of estimates pours cold water on any Fed easing in March or May and is slamming the bond market.
Q1 GDP arrives on April 25th, six days before the May 1st FOMC decision and if it lands anywhere close to current tracking then it would be impossible to expect a cut by that meeting and improbable by the June FOMC.
MARKETS PUSH FED CUT PRICING DOWN AND OUT
US 2-year Treasuries already had a cheapening bias into the data, but the yield skyrocketed post-data, rising 14bps. US 10s also jumped by about 12bps post data, as 2s10s bear flattened. The USD appreciated by almost 1% on a DXY basis that including a full penny depreciation in CAD. Stocks are taking it reasonably well, with the S&P down –0.3% m/m as strong growth significantly offsets higher rates.
FOMC rate cut pricing for the May 1st decision was trimmed by 10bps to under a quarter point. June meeting pricing was cut by 15bps to just over 40bps and is still too much.
DETAILS
US nonfarm payrolls registered the biggest gain (+353k) since last January’s surge. That leans more toward JOLTS vacancies that increased earlier this week than ADP that continues to prove itself to be worthless as a nonfarm gauge.
It is true that nonfarm is statistically noisy, but noise cuts in both directions. For that reason, we cannot dismiss this result out of hand. A 95% confidence interval based upon BLS estimates would run between 223k–483k such that 95 times out of 100 in repeated sampling you would have arrived at a strong number regardless of the exact estimate.
On top of that, feared regular and annual revisions added even more. An extra 117k jobs were added to December and a small amount was added to November. The net beat to consensus including revisions was 294k jobs. A net beat of nearly 300k humbles all of us including me despite going relatively high to consensus.
Wage growth also accelerated to 0.6% m/m, or 6.8% m/m SAAR. While part of the reason for that was a weaker revision to December, we can’t ignore the upward trend over the past half year (chart 1).
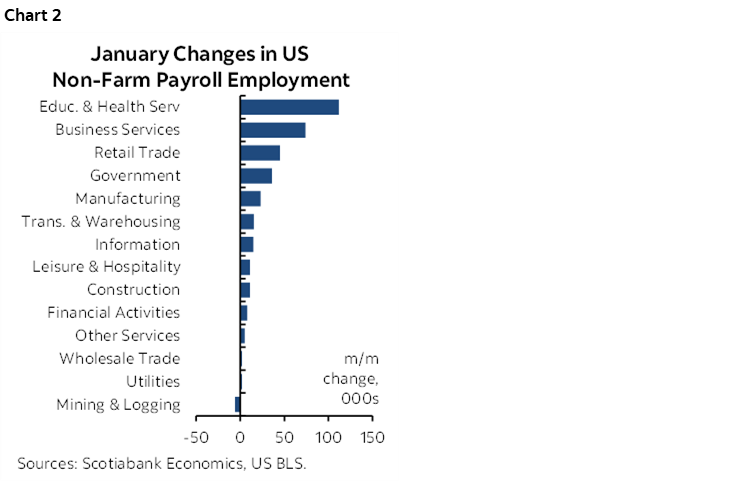
Sector breadth behind job gains was solid (chart 2).
US aggregate hours worked were up 1% q/q SAAR in Q4 and are very tentatively tracking -1.1% q/q SAAR in Q1 (chart 3). That is based only on a –0.3% m/m SA drop in January and the Q4 average while assuming the rest of Q1 turns out flat in order to focus the math on the known effects.
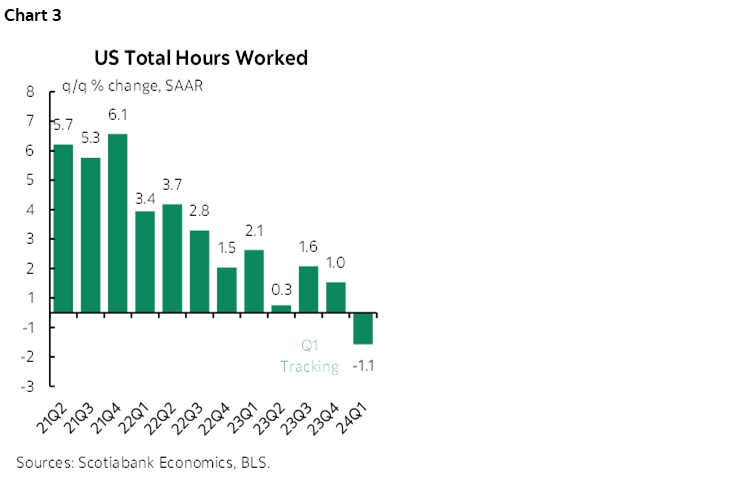
That dip in Q1 hours tracking says that US growth is heavily reliant upon productivity gains in order to square the circle with GDP 'nowcasts' since GDP is an identity defined as hours times labour productivity.
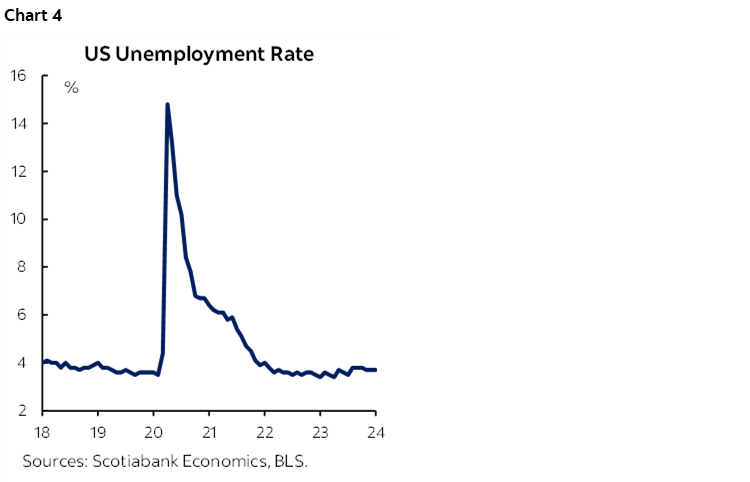
The unemployment rate held steady at 3.7% because it is derived from the companion household survey that registered -31k for jobs and -175k for the labour force (chart 4).
There are the usual caveats and that emphasize the many methodological differences between the two measures (recap here). First, the household survey is far noisier in a statistical sense. Second, there are big methodological differences. One is that the household survey includes non-payroll positions, like many small businesses. Another is that they have different reference periods; nonfarm’s is the pay period that includes the 12th day of each month, household’s is the week that includes the 12th day. One thing that does not explain the divergence between nonfarm and the household survey is multiple job holders that fell this time.
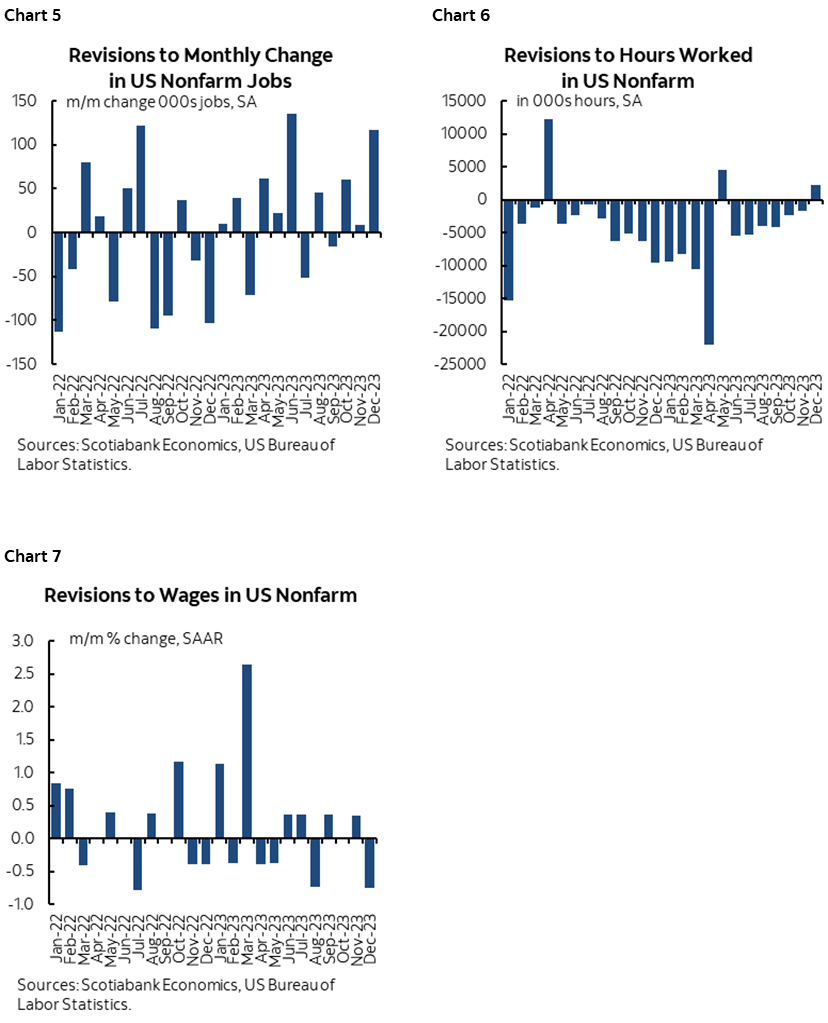
Charts 5–7 show the effects of revisions to payrolls, hours worked and wages. For the most part, the past year saw more upward revisions to nonfarm payrolls than downward revisions, more downward revisions to hours worked than upward revisions, and mixed effects on wages including big upward revisions to Q1 last year and mixed revisions since then.
In conclusion, one set of numbers doesn’t change everything, but it seriously challenges Chair Powell’s message that the labour market is rebalancing in disinflationary fashion. If Q1 GDP tracking continues to be hot, then it may return Powell to what he said in the November press conference when he said “Evidence of growth persistently above potential or that labour markets are not coming into balance could warrant further tightening.” I do not have a good explanation for why he sounded more dismissive toward GDP growth this time around.
DISCLAIMER
This report has been prepared by Scotiabank Economics as a resource for the clients of Scotiabank. Opinions, estimates and projections contained herein are our own as of the date hereof and are subject to change without notice. The information and opinions contained herein have been compiled or arrived at from sources believed reliable but no representation or warranty, express or implied, is made as to their accuracy or completeness. Neither Scotiabank nor any of its officers, directors, partners, employees or affiliates accepts any liability whatsoever for any direct or consequential loss arising from any use of this report or its contents.
These reports are provided to you for informational purposes only. This report is not, and is not constructed as, an offer to sell or solicitation of any offer to buy any financial instrument, nor shall this report be construed as an opinion as to whether you should enter into any swap or trading strategy involving a swap or any other transaction. The information contained in this report is not intended to be, and does not constitute, a recommendation of a swap or trading strategy involving a swap within the meaning of U.S. Commodity Futures Trading Commission Regulation 23.434 and Appendix A thereto. This material is not intended to be individually tailored to your needs or characteristics and should not be viewed as a “call to action” or suggestion that you enter into a swap or trading strategy involving a swap or any other transaction. Scotiabank may engage in transactions in a manner inconsistent with the views discussed this report and may have positions, or be in the process of acquiring or disposing of positions, referred to in this report.
Scotiabank, its affiliates and any of their respective officers, directors and employees may from time to time take positions in currencies, act as managers, co-managers or underwriters of a public offering or act as principals or agents, deal in, own or act as market makers or advisors, brokers or commercial and/or investment bankers in relation to securities or related derivatives. As a result of these actions, Scotiabank may receive remuneration. All Scotiabank products and services are subject to the terms of applicable agreements and local regulations. Officers, directors and employees of Scotiabank and its affiliates may serve as directors of corporations.
Any securities discussed in this report may not be suitable for all investors. Scotiabank recommends that investors independently evaluate any issuer and security discussed in this report, and consult with any advisors they deem necessary prior to making any investment.
This report and all information, opinions and conclusions contained in it are protected by copyright. This information may not be reproduced without the prior express written consent of Scotiabank.
™ Trademark of The Bank of Nova Scotia. Used under license, where applicable.
Scotiabank, together with “Global Banking and Markets”, is a marketing name for the global corporate and investment banking and capital markets businesses of The Bank of Nova Scotia and certain of its affiliates in the countries where they operate, including; Scotiabank Europe plc; Scotiabank (Ireland) Designated Activity Company; Scotiabank Inverlat S.A., Institución de Banca Múltiple, Grupo Financiero Scotiabank Inverlat, Scotia Inverlat Casa de Bolsa, S.A. de C.V., Grupo Financiero Scotiabank Inverlat, Scotia Inverlat Derivados S.A. de C.V. – all members of the Scotiabank group and authorized users of the Scotiabank mark. The Bank of Nova Scotia is incorporated in Canada with limited liability and is authorised and regulated by the Office of the Superintendent of Financial Institutions Canada. The Bank of Nova Scotia is authorized by the UK Prudential Regulation Authority and is subject to regulation by the UK Financial Conduct Authority and limited regulation by the UK Prudential Regulation Authority. Details about the extent of The Bank of Nova Scotia's regulation by the UK Prudential Regulation Authority are available from us on request. Scotiabank Europe plc is authorized by the UK Prudential Regulation Authority and regulated by the UK Financial Conduct Authority and the UK Prudential Regulation Authority.
Scotiabank Inverlat, S.A., Scotia Inverlat Casa de Bolsa, S.A. de C.V, Grupo Financiero Scotiabank Inverlat, and Scotia Inverlat Derivados, S.A. de C.V., are each authorized and regulated by the Mexican financial authorities.
Not all products and services are offered in all jurisdictions. Services described are available in jurisdictions where permitted by law.