CANADA: SHOCKS MIGHT DISGUISE AS SEASONAL STRENGTH
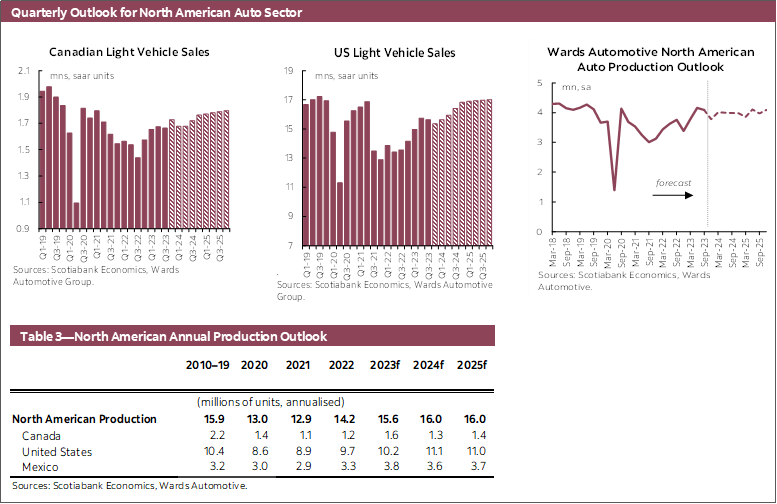
Canadian auto sales increased 6.1% m/m (sa) in November to 1.79 mn units at an annualized rate according to Wards Automotive (chart 1). Despite the summer months being marked by shocks such as wildfires, labour strikes, rising prices, and further tightening in financial conditions, light vehicle sales have been resilient as we approach the end of 2023. Auto sales on a three-month moving average have increased to 1.72 mn (saar) units in November, up from 1.63 mn (saar, 3mma) in August, to the fastest seasonally adjusted pace since spring 2021. One caveat to point out is that unadjusted vehicle sales in Canada historically slow down in the fourth quarter of the year, so the rise in seasonally adjusted sales is likely attributable, at least in part, to purchases which may have been put off this summer because of the aforementioned shocks. While elevated auto loan rates pose as a headwind, averaging 8% in Q3-2023, strong wage gains for permanent employees of 6.1% (saar, 3mma) to November supports domestic consumption. Canada’s labour market has been easing from extremely tight levels, with the job vacancy rate coming down towards pre-pandemic, while still adding jobs though at a slower pace than growth in the labour force. Our outlook for Canadian auto sales is 1.68 mn in 2023, and expected to pick up to 1.71 mn in 2024 and 1.78 mn in 2025 as inventories improve and rates pressures ease.

UNITED STATES: FINANCING RATES WEIGH ON SALES
Momentum in the recovery of US auto sales continues to stall in 2023H2, as sales fell -0.7% m/m (sa) to 15.3 mn (saar) units in November (chart 2). Light vehicle sales in seasonally adjusted terms have declined through four of the past five months. The average US 48-month new car loan rate reached 7.67% is November, up nearly four percentage points from March 2022, when the Federal Reserve first hiked their policy rate in this tightening cycle from 0.25% to today’s 5.50%, and above the most recent peak new car loan rate of 7.44% in May 2009. As demand is cooled by elevated costs of financing, supply-side measures continue to improve. Seasonally adjusted US inventories of vehicles assembled in North America have increased in eleven of the past twelve months through October, though remain about one third of the average level in 2019. North American light vehicle production fell -6.6% m/m (sa) to 14.8 mn (saar) units in October, amid impacts from the resolved United Auto Workers strike against the Detroit Three (General Motors, Ford, and Stellantis). Even with slowing vehicle sales in the near term, it will take an extended period of higher vehicle production to fully ease supply-side pressures. Our outlook for US auto sales is 15.4 mn in 2023 as low inventories, elevated rates, and weak consumer sentiment pose headwinds, and forecast sales to pick up to 16.2 mn in 2024 and 17.0 in 2025 as these headwinds ease.

GLOBAL AUTO SALES: REBOUND VERSUS SLOWDOWN?
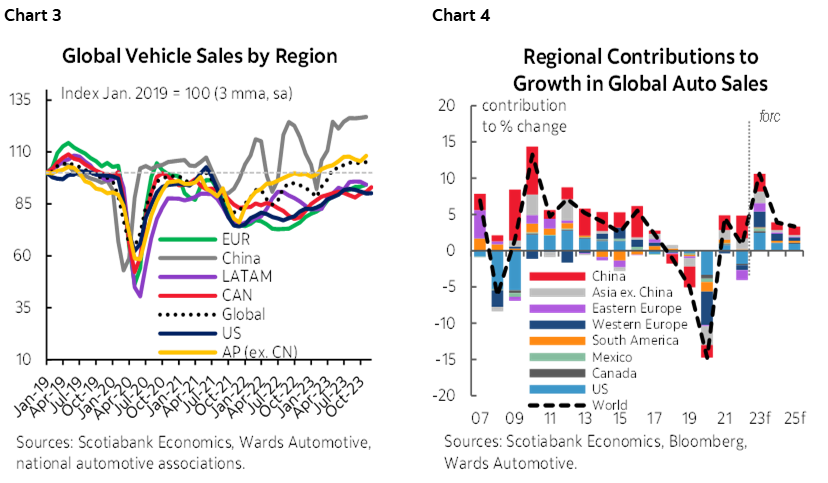
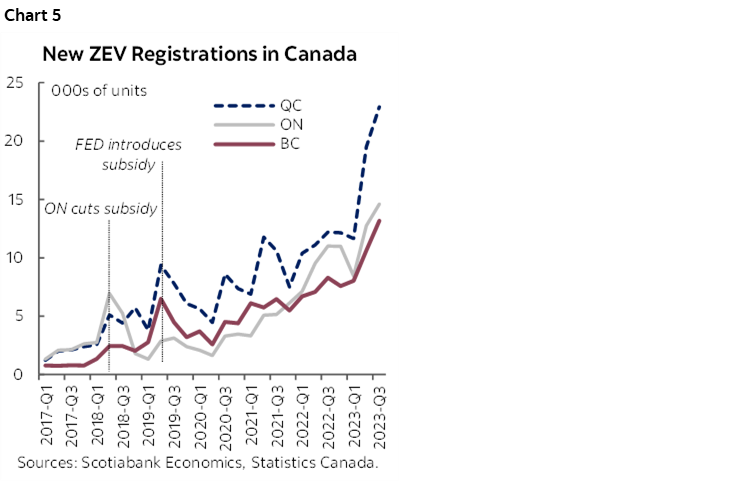
Global auto sales held steady to start the fourth quarter, increasing 0.7% m/m (sa) in October, though with notable differences at the regional level (chart 3). Auto sales in Western and Eastern Europe rebounded 3.6% and 6.2% m/m (sa) respectively from contractions of -7.1% and -2.8% the month prior, increasing in all four Eastern European and 10 out of 15 of the Western European countries covered. Of note, vehicle sales increased in France (5.0% m/m, sa), Germany (2.3%), Italy (2.1%), Spain (10.3%), and the UK (7.1%). Asia-Pacific auto sales were relatively flat at the regional level (0.3% m/m, sa), as declining sales in China (-2.4%) which accounts for about two-thirds of market share offset increased sales in Australia (2.9%), India (10.5%), Indonesia (5.7%), Japan (3.2%), and South Korea (2.2%). Meanwhile, auto sales in Latin America were mixed, increasing 1.7% m/m (sa) at the regional level, although primarily due to increased sales in Brazil (6.4%) and Chile (10.7%) more than offsetting decreased sales in Colombia (-10.4%) and Mexico (-4.6%) with small contractions in Argentina (-0.4%) and Peru (-0.6%). Our forecast for global auto sales is an increase of 10.6% in 2023, and 3.9% in 2024 and 3.3% in 2025 (chart 4).
ELECTRIC VEHICLE SALES: ANOTHER MILE(STONE) ON THE LONG ROAD FOR EVS
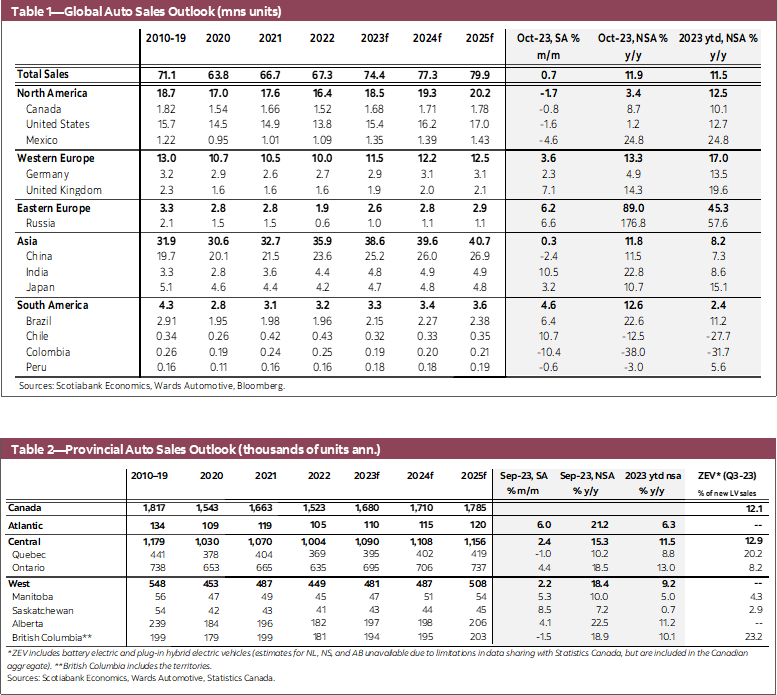
Electric vehicles have taken another step toward meeting Canada’s interim target of 20% Zero-Emission Vehicle (ZEV) sales by 2026 and 100% ZEV sales by 2035. In the third quarter this year, battery electric and plug-in hybrid vehicles accounted for more than one-in-ten (12.1%) of all new motor vehicle registrations for the first time at the national level. This increased ZEV market share was supported by a quarterly increase in both battery electric vehicles (22.1% q/q) and plug-in hybrids (10.7%) registrations as well as a contraction in total vehicle registrations (-3.3%) in non-seasonally adjusted terms. In Ontario, Canada’s largest market by total vehicle registrations, ZEVs accounted for 8.2% of all vehicle sales within the province and one-in-four (26.3%) of national ZEV sales in the third quarter. Meanwhile, two-in-five (41.3%) of third quarter national ZEV sales were in Quebec, where 15.1% of new provincial sales were battery electric and 5.2% were plug-in hybrid vehicles (chart 5). Lastly, a little under one-in-four (23.7%) of national ZEV sales were from BC, which continues to see the highest adoption rate among the reporting provinces with ZEVs accounting for 23.2% of the province’s new vehicle registrations in the third quarter. While ZEVs have reached their largest share of new quarterly vehicle registrations to date, this gain in market share coming at a time when total vehicle sales are slowing amid rising prices and elevated financing rates does not seem representative of a larger shift in the near-term. Absent any shifts in market dynamics or policies, affordability will likely pose a major headwind to meeting Canada’s 100% ZEV sales target by 2035 as noted in the Scotiabank Economics EV affordability report.
DISCLAIMER
This report has been prepared by Scotiabank Economics as a resource for the clients of Scotiabank. Opinions, estimates and projections contained herein are our own as of the date hereof and are subject to change without notice. The information and opinions contained herein have been compiled or arrived at from sources believed reliable but no representation or warranty, express or implied, is made as to their accuracy or completeness. Neither Scotiabank nor any of its officers, directors, partners, employees or affiliates accepts any liability whatsoever for any direct or consequential loss arising from any use of this report or its contents.
These reports are provided to you for informational purposes only. This report is not, and is not constructed as, an offer to sell or solicitation of any offer to buy any financial instrument, nor shall this report be construed as an opinion as to whether you should enter into any swap or trading strategy involving a swap or any other transaction. The information contained in this report is not intended to be, and does not constitute, a recommendation of a swap or trading strategy involving a swap within the meaning of U.S. Commodity Futures Trading Commission Regulation 23.434 and Appendix A thereto. This material is not intended to be individually tailored to your needs or characteristics and should not be viewed as a “call to action” or suggestion that you enter into a swap or trading strategy involving a swap or any other transaction. Scotiabank may engage in transactions in a manner inconsistent with the views discussed this report and may have positions, or be in the process of acquiring or disposing of positions, referred to in this report.
Scotiabank, its affiliates and any of their respective officers, directors and employees may from time to time take positions in currencies, act as managers, co-managers or underwriters of a public offering or act as principals or agents, deal in, own or act as market makers or advisors, brokers or commercial and/or investment bankers in relation to securities or related derivatives. As a result of these actions, Scotiabank may receive remuneration. All Scotiabank products and services are subject to the terms of applicable agreements and local regulations. Officers, directors and employees of Scotiabank and its affiliates may serve as directors of corporations.
Any securities discussed in this report may not be suitable for all investors. Scotiabank recommends that investors independently evaluate any issuer and security discussed in this report, and consult with any advisors they deem necessary prior to making any investment.
This report and all information, opinions and conclusions contained in it are protected by copyright. This information may not be reproduced without the prior express written consent of Scotiabank.
™ Trademark of The Bank of Nova Scotia. Used under license, where applicable.
Scotiabank, together with “Global Banking and Markets”, is a marketing name for the global corporate and investment banking and capital markets businesses of The Bank of Nova Scotia and certain of its affiliates in the countries where they operate, including; Scotiabank Europe plc; Scotiabank (Ireland) Designated Activity Company; Scotiabank Inverlat S.A., Institución de Banca Múltiple, Grupo Financiero Scotiabank Inverlat, Scotia Inverlat Casa de Bolsa, S.A. de C.V., Grupo Financiero Scotiabank Inverlat, Scotia Inverlat Derivados S.A. de C.V. – all members of the Scotiabank group and authorized users of the Scotiabank mark. The Bank of Nova Scotia is incorporated in Canada with limited liability and is authorised and regulated by the Office of the Superintendent of Financial Institutions Canada. The Bank of Nova Scotia is authorized by the UK Prudential Regulation Authority and is subject to regulation by the UK Financial Conduct Authority and limited regulation by the UK Prudential Regulation Authority. Details about the extent of The Bank of Nova Scotia's regulation by the UK Prudential Regulation Authority are available from us on request. Scotiabank Europe plc is authorized by the UK Prudential Regulation Authority and regulated by the UK Financial Conduct Authority and the UK Prudential Regulation Authority.
Scotiabank Inverlat, S.A., Scotia Inverlat Casa de Bolsa, S.A. de C.V, Grupo Financiero Scotiabank Inverlat, and Scotia Inverlat Derivados, S.A. de C.V., are each authorized and regulated by the Mexican financial authorities.
Not all products and services are offered in all jurisdictions. Services described are available in jurisdictions where permitted by law.