

- Mexico: Exports and imports continue to post double-digit growth; Unemployment remains stable while informality stays elevated
- Peru: Retail sales outpace the broader commerce sector in 1H26
MEXICO: EXPORTS AND IMPORTS CONTINUE TO POST DOUBLE-DIGIT GROWTH
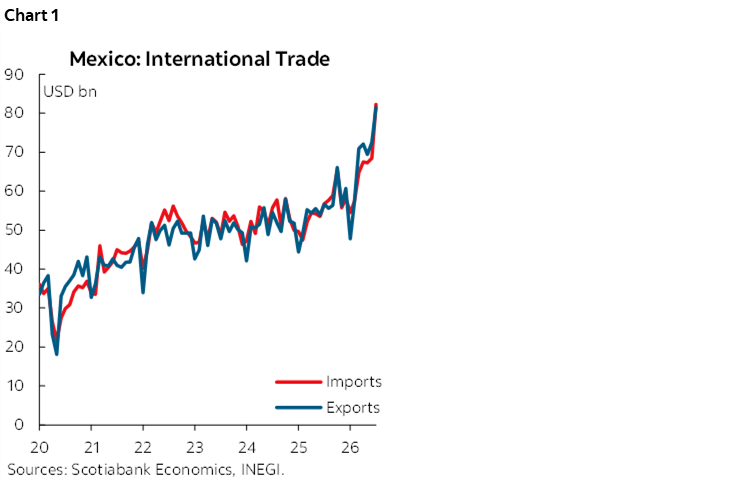
In July 2026, Mexico’s foreign trade maintained a favourable performance (chart 1), with exports totaling USD 81.4bn and imports reaching USD 82.3bn, resulting in a trade deficit of USD 848mn. Exports grew 43.7% year over year, led by non-automotive manufactures (64.9%) and non-oil extractive exports (87.1%), while automotive exports expanded at a more moderate pace (2.4%). Meanwhile, agricultural exports declined by -8.6%. Imports also showed strong momentum, rising 45.0% year over year. Intermediate goods led the increase (56.3%), consumer goods posted a more moderate gain (9.8%), and capital goods increased by only 9.9%. On a cumulative basis, during the first half of the year, exports maintained annual growth of 27.7%, while imports rose 25.6%, resulting in a surplus of USD 9.255 billion.
UNEMPLOYMENT REMAINS STABLE WHILE INFORMALITY STAYS ELEVATED
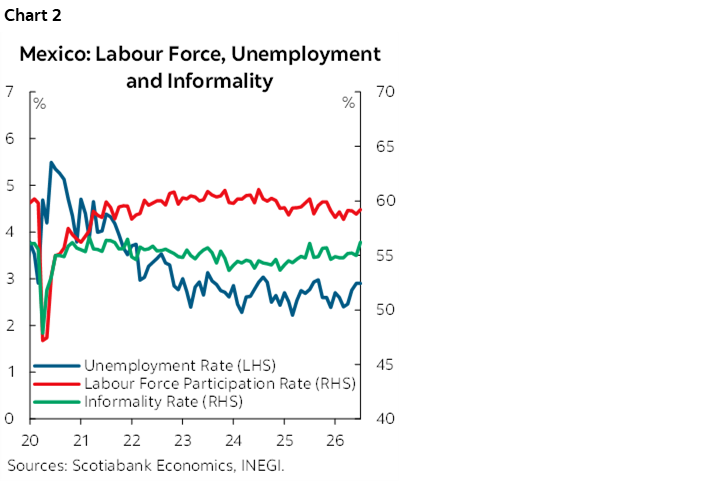
In July, the unemployment rate stood at 2.9% (chart 2), unchanged from the previous month. The labor force participation rate reached 59.2% of the working-age population, up from 58.8%, with the economically active population totaling 62.6 million people. The informality rate remained high at 56.2%, while the underemployment rate stood at 6.7%.
—Rodolfo Mitchell, Miguel Saldaña & Martha Cordova
PERU: RETAIL SALES OUTPACE THE BROADER COMMERCE SECTOR IN 1H26
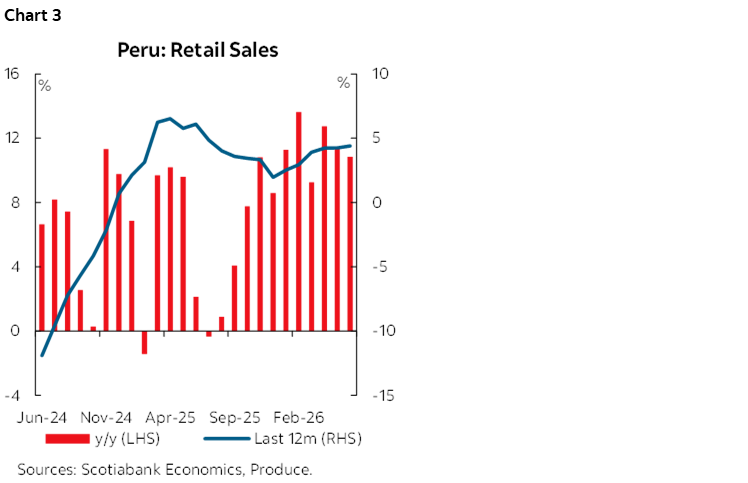
Retail sales reached PEN 27.1bn in 1H26, up 11.5% from 1H25 (chart 3) and marking the strongest year-on-year growth for a half-year period since 2H21—the post-pandemic period—according to data from the Ministry of Production (Produce). This outcome outpaced the 6.2% expansion recorded by the overall commerce sector over the same period, according to INEI, and came slightly above our forecast. The positive performance reflected: i) continued growth in formal private sector employment, against a backdrop in which private investment expanded 17.6% in 2Q26; ii) the sol’s appreciation against the U.S. dollar, which lowered the local currency relative prices of imported goods—the sol appreciated by around 7% against the U.S. dollar in 1H26; and iii) an expansion in retail capacity, reflected in a larger number of stores, particularly supermarkets. Nevertheless, inflationary pressures stemming from extraordinary events in recent months—including oil price volatility amid the escalation of the conflict in the Middle East—partly constrained household spending capacity.
For 2H26, we expect retail sales to remain on a positive trajectory, albeit at a slower pace than in 1H26. By segment, supermarket sales should remain dynamic, supported by stronger demand for food—including private label products—and beverages, with the latter benefiting from higher average temperatures associated with El Niño. Stronger demand for non-food products, particularly household equipment, should also provide support. Home improvement sales are likewise expected to continue expanding, underpinned by ongoing self-construction activity—as reflected in higher cement consumption—the solid performance of the real estate sector, particularly high-value housing in Lima, and the relative stability of construction material prices, which increased 1.8% in Lima during 1H26.
However, department store sales could moderate amid an atypically mild winter, with above-average temperatures weighing on demand for cold weather apparel—a higher-margin category. In addition, inflationary pressures in the fuel segment, stemming from lower oil supply associated with the conflict in the Strait of Hormuz, could raise transportation costs and reduce household spending capacity.
On a full-year basis, incorporating the 1H26 data and the sustained growth we expect in 2H26, we forecast retail sales to exceed PEN 56.0bn by end-2026. This would imply a growth rate above our 4.5% forecast for the broader Commerce sector this year.
PERFORMANCE BY SEGMENT IN 1H26
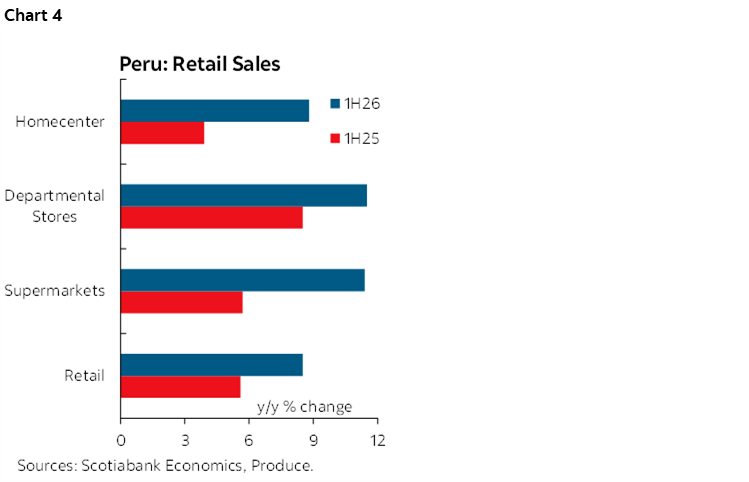
Retail sales grew 11.5% in 1H26 versus 1H25, according to Produce. By segment (chart 4), supermarket sales stood out (+11%), driven by stronger demand for food (+11%) and beverages (+16%); together, these categories account for 60% of supermarket sales. Higher demand for household goods and equipment (+12%) also contributed, alongside the sustained expansion of non-traditional formats—discount stores now exceed 1,800 locations. Department store sales also increased (+11%), supported by stronger demand for household goods, equipment and furniture (+26%), in a context of a lower PEN/USD exchange rate, which reduced the local currency prices of imported products. This performance was partly constrained by slower growth in apparel and footwear sales (+5%), reflecting weaker demand for autumn season clothing—this category accounts for 60% of the segment’s sales. Finally, home improvement sales rose 9%, underpinned by the strength of the real estate sector—new mortgage loans increased by nearly 12% in 1H26—and sustained demand for hardware products and goods used in self-construction—domestic cement consumption rose 12% in 1H26, according to INEI.
—Carlos Asmat
DISCLAIMER
This report has been prepared by Scotiabank Economics as a resource for the clients of Scotiabank. Opinions, estimates and projections contained herein are our own as of the date hereof and are subject to change without notice. The information and opinions contained herein have been compiled or arrived at from sources believed reliable but no representation or warranty, express or implied, is made as to their accuracy or completeness. Neither Scotiabank nor any of its officers, directors, partners, employees or affiliates accepts any liability whatsoever for any direct or consequential loss arising from any use of this report or its contents.
These reports are provided to you for informational purposes only. This report is not, and is not constructed as, an offer to sell or solicitation of any offer to buy any financial instrument, nor shall this report be construed as an opinion as to whether you should enter into any swap or trading strategy involving a swap or any other transaction. The information contained in this report is not intended to be, and does not constitute, a recommendation of a swap or trading strategy involving a swap within the meaning of U.S. Commodity Futures Trading Commission Regulation 23.434 and Appendix A thereto. This material is not intended to be individually tailored to your needs or characteristics and should not be viewed as a “call to action” or suggestion that you enter into a swap or trading strategy involving a swap or any other transaction. Scotiabank may engage in transactions in a manner inconsistent with the views discussed this report and may have positions, or be in the process of acquiring or disposing of positions, referred to in this report.
Scotiabank, its affiliates and any of their respective officers, directors and employees may from time to time take positions in currencies, act as managers, co-managers or underwriters of a public offering or act as principals or agents, deal in, own or act as market makers or advisors, brokers or commercial and/or investment bankers in relation to securities or related derivatives. As a result of these actions, Scotiabank may receive remuneration. All Scotiabank products and services are subject to the terms of applicable agreements and local regulations. Officers, directors and employees of Scotiabank and its affiliates may serve as directors of corporations.
Any securities discussed in this report may not be suitable for all investors. Scotiabank recommends that investors independently evaluate any issuer and security discussed in this report, and consult with any advisors they deem necessary prior to making any investment.
This report and all information, opinions and conclusions contained in it are protected by copyright. This information may not be reproduced without the prior express written consent of Scotiabank.
™ Trademark of The Bank of Nova Scotia. Used under license, where applicable.
Scotiabank, together with “Global Banking and Markets”, is a marketing name for the global corporate and investment banking and capital markets businesses of The Bank of Nova Scotia and certain of its affiliates in the countries where they operate, including; Scotiabank Europe plc; Scotiabank (Ireland) Designated Activity Company; Scotiabank Inverlat S.A., Institución de Banca Múltiple, Grupo Financiero Scotiabank Inverlat, Scotia Inverlat Casa de Bolsa, S.A. de C.V., Grupo Financiero Scotiabank Inverlat, Scotia Inverlat Derivados S.A. de C.V. – all members of the Scotiabank group and authorized users of the Scotiabank mark. The Bank of Nova Scotia is incorporated in Canada with limited liability and is authorised and regulated by the Office of the Superintendent of Financial Institutions Canada. The Bank of Nova Scotia is authorized by the UK Prudential Regulation Authority and is subject to regulation by the UK Financial Conduct Authority and limited regulation by the UK Prudential Regulation Authority. Details about the extent of The Bank of Nova Scotia's regulation by the UK Prudential Regulation Authority are available from us on request. Scotiabank Europe plc is authorized by the UK Prudential Regulation Authority and regulated by the UK Financial Conduct Authority and the UK Prudential Regulation Authority.
Scotiabank Inverlat, S.A., Scotia Inverlat Casa de Bolsa, S.A. de C.V, Grupo Financiero Scotiabank Inverlat, and Scotia Inverlat Derivados, S.A. de C.V., are each authorized and regulated by the Mexican financial authorities.
Not all products and services are offered in all jurisdictions. Services described are available in jurisdictions where permitted by law.