- Chile: August CPI at 0.0% m/m (4.0% y/y) with zero inflation in clothing and footwear
- Colombia: Headline inflation surpasses the 5% mark again
CHILE: AUGUST CPI AT 0.0% M/M (4.0% Y/Y) WITH ZERO INFLATION IN CLOTHING AND FOOTWEAR
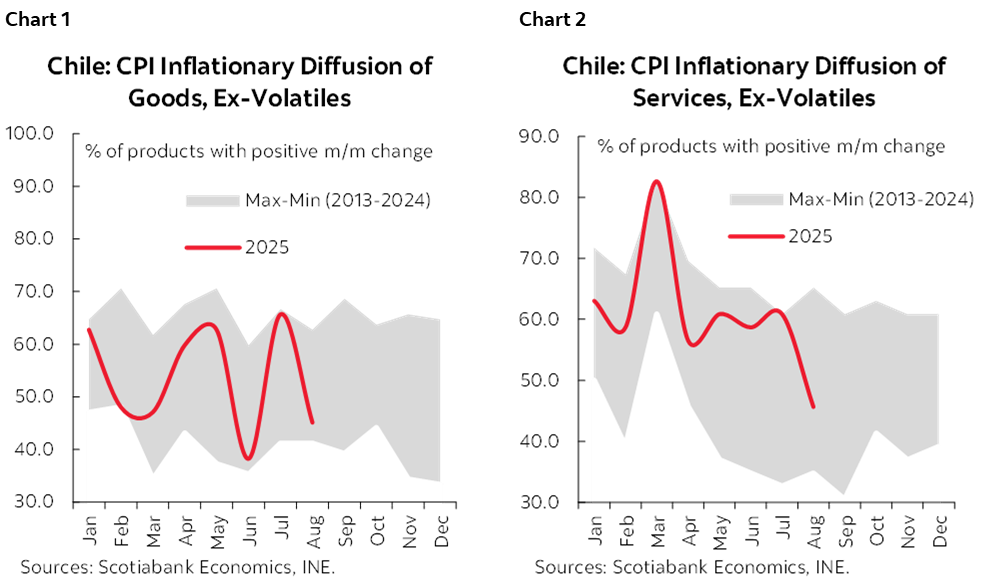
This morning, the INE released August CPI data showing a 0.04% m/m change in prices (4.0% y/y), below the market consensus and survey expectations (0.2%), inflation forwards (0.06%), and our own forecast (0.16%). Core inflation (ex-volatile items) showed no monthly variation (0.0% m/m), with a decline in goods prices (-0.3%) largely explained by clothing and footwear, and a rise in services in line with expectations (0.2%), albeit with lower diffusion levels.
The main surprise relative to our forecast came from the flat reading in the clothing and footwear division, which led to a monthly drop in inflation diffusion not seen in any August since historical records began (at least since 2013). Additionally, volatile items also surprised to the downside, mainly due to a drop in package tour prices.
Inflationary diffusion remains highly volatile, falling to the bottom of its historical range (48.4%). After peaking in July, August figures show the expected reversal in goods diffusion (core), but also a surprising decline in services diffusion, which for the first time this year fell significantly below average (charts 1 and 2). This could signal more contained services inflation pressures in coming months, although it is still early to draw firm conclusions given recent volatility in analytical indicators and pending cost-side supply shocks yet to be internalized by firms (minimum wage hike, new increase in pension contributions, and indirect effects from the reduction in working hours).
Despite the favourable inflation surprise, we do not see implications for changing our cautious stance for the short-term policy rate outlook, due to the following:
- August’s monthly inflation was heavily influenced by one division (clothing), which showed particularly disinflationary behaviour.
- Upside surprises in core CPI have accumulated from June to August, beyond the flat monthly print in August. We estimate that annual core CPI was projected in the June Monetary Policy Report (MPR) at around 3.6% for August, but it stands at 3.9%, indicating a cumulative upside surprise between the two MPRs.
- New cost shocks are yet to be incorporated. This not only includes the recent increase in employer-side pension contributions in August (+1 ppts), which has a less direct impact than the minimum wage hike, but also a new minimum wage increase in January 2025, another pension contribution hike in August 2026 (+2.5 ppts), and a further reduction in working hours (40-hour law) in April 2026.
- As we have noted recently, our re-estimation of the neutral policy rate suggests a neutral range between 3.75% and 4.75%, with a midpoint of 4.25%, indicating that the current policy rate is within the “neutral zone”, substantially reducing the urgency for accelerated rate cuts in the short-term. This view is reinforced by the recent revision of the potential GDP estimate by the Expert Committee, from 2.1% to 2.6%.
- Economic activity is showing momentum that is broadly in line with Scotiabank’s expectations and slightly above the June MPR baseline. The output gap appears to be closed, while the labour market’s slack may also be explained by structural rather than purely cyclical factors, where monetary policy could play a limited role.
—Aníbal Alarcón
COLOMBIA: HEADLINE INFLATION SURPASSES THE 5% MARK AGAIN
Colombia’s monthly CPI inflation stood at 0.19% m/m in August, according to data published by DANE on Friday. This result was in line with analysts’ expectations in the BanRep survey (0.19% m/m avg) and slightly below Scotiabank Colpatria’s forecast (0.23% m/m). During the month, 8 of the 12 consumption groups registered positive monthly variations, with food, restaurants, and other goods & services contributing the most to total inflation, accounting for 86% of the gains.
Annual inflation accelerated from 4.90% to 5.10% in August (chart 3), continuing the uptrend observed in the previous month. This increase was mainly driven by an acceleration in food inflation, which once again surpassed the 6% mark, and a mild uptick in goods-related inflation (1.93% y/y).
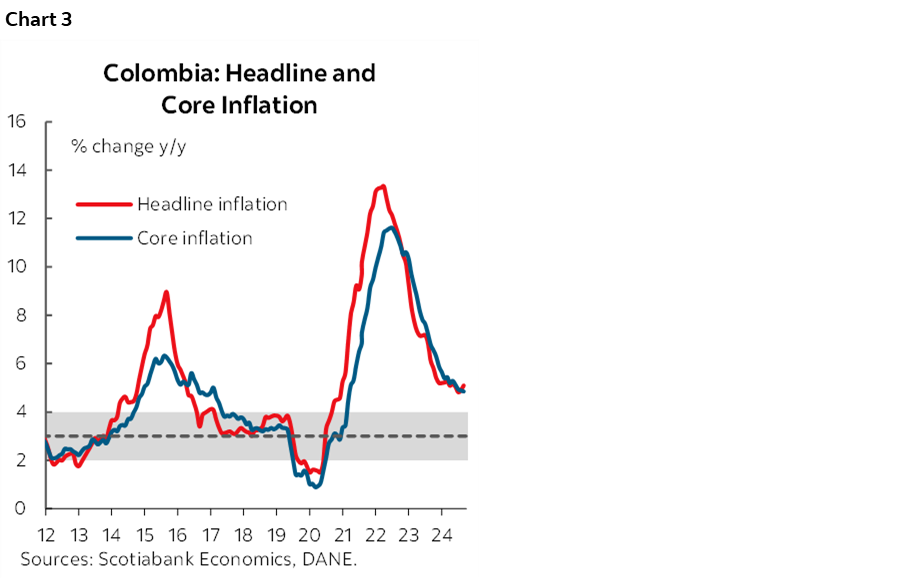
Regarding core measures, ex-food inflation declined slightly from 4.89% y/y to 4.85% y/y, while core inflation (excluding food and regulated prices) showed a moderate increase from 4.79% y/y to 4.82% y/y. Services inflation decreased from 6.0% y/y to 5.93% y/y, reflecting a slowdown in annual inflation due to transportation and some leisure services. Meanwhile, goods inflation rose from 1.66% to 1.93%, indicating moderate pressure on imported goods, though still below the target range (2%–4%). Regulated prices fell to 4.96%, mainly due to lower inflation in utilities (1.87% y/y) and fuel (2.2% y/y).
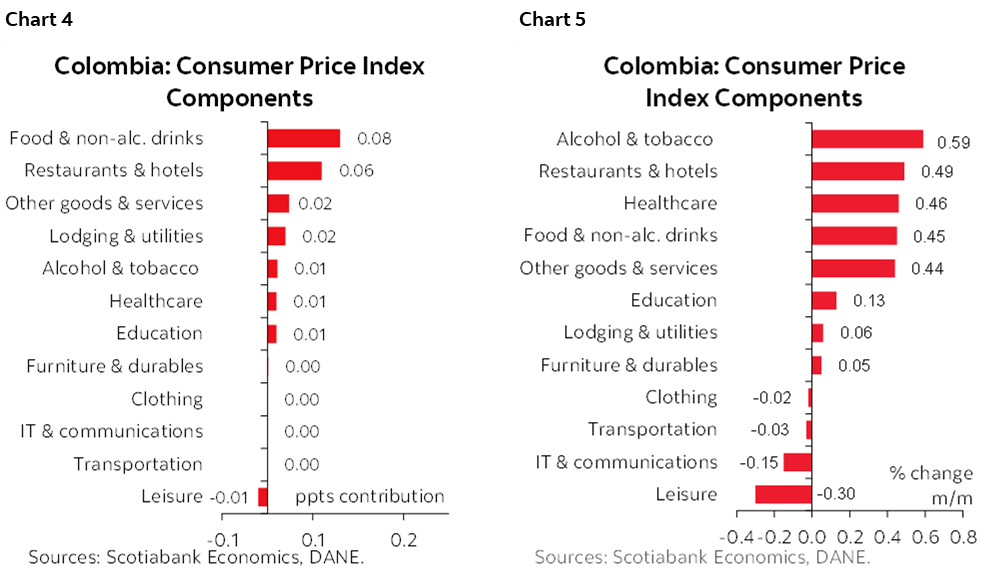
In August, there was a shift in the sources of inflation (charts 4 and 5). Food and non-alcoholic beverage prices increased by 0.45% m/m, well above the historical average for August (excluding the pandemic), which stands at -0.17% m/m. The rise in food prices was primarily driven by higher fruit prices. Restaurants and hotels were the second-largest contributors to August inflation, likely reflecting stronger household demand. In contrast, services such as leisure (due to vacation planning), transportation, communication, and clothing helped offset the overall inflationary pressure.
These results support our expectation that inflation will likely close above 5% in 2025. Statistical base effects remain low in areas such as food and regulated prices, particularly in October, posing significant challenges to reducing inflation during the rest of the year. We project year-end inflation at around 5.20% for December 2025, and slightly below 4% for December 2026. This path will be highly dependent on the minimum wage increase. If the wage adjustment exceeds the traditional rule of inflation plus productivity, it could skew our inflation forecast to the upside.
Given this context, we do not anticipate any interest rate cuts by the central bank for the remainder of 2025. We only see the possibility of resuming the easing cycle in 2026, once it is confirmed that indexation effects will not prevent inflation from continuing to decline.
Other highlights:
- Two groups accounted for 74% of total inflation. Food and non-alcoholic drinks, again, were the largest contributor with a monthly increase of 0.45% and a contribution of 8bps. Within the food basket, fruits were the largest contributors to the increase, with increases of 4.66% m/m. However, other foods also registered significant increases, such as carrots (+15.5% m/m), yucca (+11.26% m/m) and oranges (+6.43% m/m), However, 37% of the food items included in the basket registered contractions, with potatoes registering the largest decrease (-9.63% m/m).
- Restaurants and hotels were the second largest contributors to inflation. Restaurants and hotels registered an increase of 0.49% m/m, contributing with 6bps to the total. The increase was due to meals prepared outdoors (0.53% m/m). The increase in this group could be a signal of a robust households’ demand.
- Other items contributed to inflation. Other goods and services registered a 0.44% m/m rise, explained by hygiene items prices (0.65% m/m) but partially offset by the performance of vehicle insurance. Meanwhile, lodging and utilities registered a 0.06% m/m increase, showing positive variations in almost all components except by electricity rates which fell -1.61% m/m, completing four months of negative variations, and reflecting the fact that in 2025 the electricity generation is using hydroelectric sources that are usually cheaper than thermos sources.
- Services continued to show persistence in August but for the first time in three years stood below the 6% mark. Services inflation had maintained a downtrend in August dropping to 5.93% y/y despite some reductions in leisure-related prices. Services are believed to contribute around 65% of total annual inflation.
—Jackeline Piraján & Valentina Guio
DISCLAIMER
This report has been prepared by Scotiabank Economics as a resource for the clients of Scotiabank. Opinions, estimates and projections contained herein are our own as of the date hereof and are subject to change without notice. The information and opinions contained herein have been compiled or arrived at from sources believed reliable but no representation or warranty, express or implied, is made as to their accuracy or completeness. Neither Scotiabank nor any of its officers, directors, partners, employees or affiliates accepts any liability whatsoever for any direct or consequential loss arising from any use of this report or its contents.
These reports are provided to you for informational purposes only. This report is not, and is not constructed as, an offer to sell or solicitation of any offer to buy any financial instrument, nor shall this report be construed as an opinion as to whether you should enter into any swap or trading strategy involving a swap or any other transaction. The information contained in this report is not intended to be, and does not constitute, a recommendation of a swap or trading strategy involving a swap within the meaning of U.S. Commodity Futures Trading Commission Regulation 23.434 and Appendix A thereto. This material is not intended to be individually tailored to your needs or characteristics and should not be viewed as a “call to action” or suggestion that you enter into a swap or trading strategy involving a swap or any other transaction. Scotiabank may engage in transactions in a manner inconsistent with the views discussed this report and may have positions, or be in the process of acquiring or disposing of positions, referred to in this report.
Scotiabank, its affiliates and any of their respective officers, directors and employees may from time to time take positions in currencies, act as managers, co-managers or underwriters of a public offering or act as principals or agents, deal in, own or act as market makers or advisors, brokers or commercial and/or investment bankers in relation to securities or related derivatives. As a result of these actions, Scotiabank may receive remuneration. All Scotiabank products and services are subject to the terms of applicable agreements and local regulations. Officers, directors and employees of Scotiabank and its affiliates may serve as directors of corporations.
Any securities discussed in this report may not be suitable for all investors. Scotiabank recommends that investors independently evaluate any issuer and security discussed in this report, and consult with any advisors they deem necessary prior to making any investment.
This report and all information, opinions and conclusions contained in it are protected by copyright. This information may not be reproduced without the prior express written consent of Scotiabank.
™ Trademark of The Bank of Nova Scotia. Used under license, where applicable.
Scotiabank, together with “Global Banking and Markets”, is a marketing name for the global corporate and investment banking and capital markets businesses of The Bank of Nova Scotia and certain of its affiliates in the countries where they operate, including; Scotiabank Europe plc; Scotiabank (Ireland) Designated Activity Company; Scotiabank Inverlat S.A., Institución de Banca Múltiple, Grupo Financiero Scotiabank Inverlat, Scotia Inverlat Casa de Bolsa, S.A. de C.V., Grupo Financiero Scotiabank Inverlat, Scotia Inverlat Derivados S.A. de C.V. – all members of the Scotiabank group and authorized users of the Scotiabank mark. The Bank of Nova Scotia is incorporated in Canada with limited liability and is authorised and regulated by the Office of the Superintendent of Financial Institutions Canada. The Bank of Nova Scotia is authorized by the UK Prudential Regulation Authority and is subject to regulation by the UK Financial Conduct Authority and limited regulation by the UK Prudential Regulation Authority. Details about the extent of The Bank of Nova Scotia's regulation by the UK Prudential Regulation Authority are available from us on request. Scotiabank Europe plc is authorized by the UK Prudential Regulation Authority and regulated by the UK Financial Conduct Authority and the UK Prudential Regulation Authority.
Scotiabank Inverlat, S.A., Scotia Inverlat Casa de Bolsa, S.A. de C.V, Grupo Financiero Scotiabank Inverlat, and Scotia Inverlat Derivados, S.A. de C.V., are each authorized and regulated by the Mexican financial authorities.
Not all products and services are offered in all jurisdictions. Services described are available in jurisdictions where permitted by law.