- Colombia: Economic activity fell short of market expectations in August
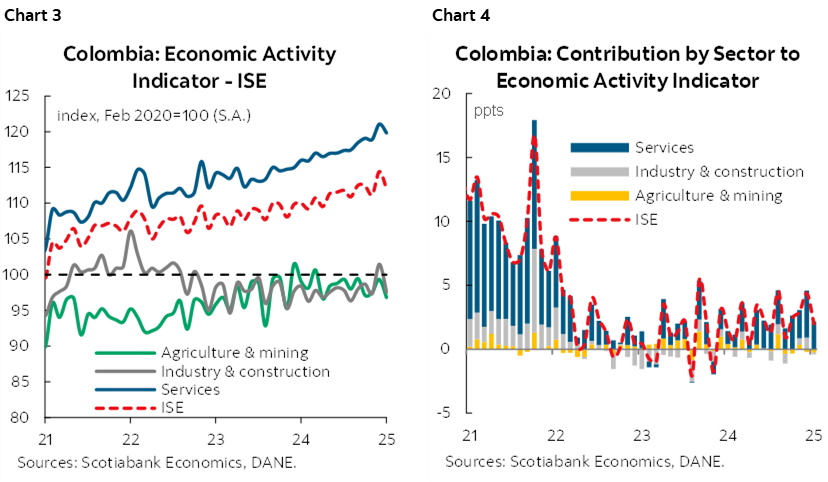
On Monday, October 20th, DANE released the Economic Activity Indicator (ISE) for August. The indicator showed a year-over-year (y/y) increase of 2.0% (chart 1), below the Bloomberg survey median (3.2% y/y) and slightly below Scotiabank’s forecast of 2.2% y/y. Six out of the nine sectors included in the index posted positive annual variations. Seasonally adjusted figures reflected a 1.8% y/y expansion in economic activity. On a monthly basis, activity dropped by 2.1% m/m (seasonally adjusted), in contrast with the 2.9% m/m jump observed in July (chart 2).
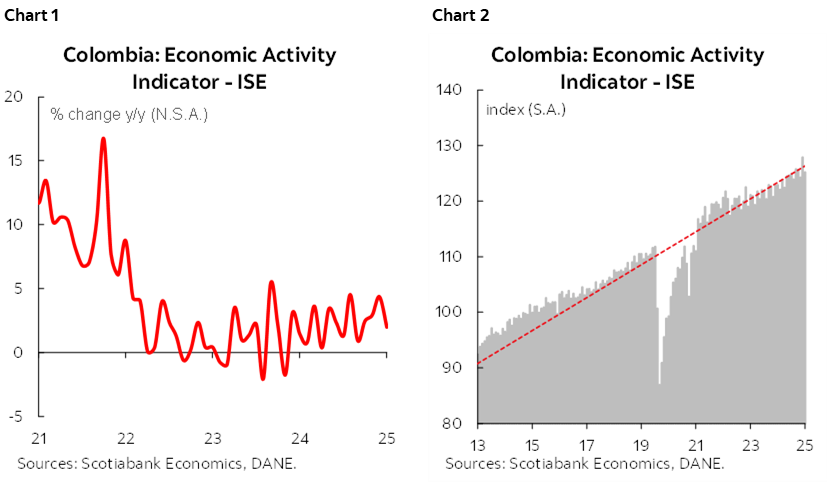
The deceleration in economic activity was partially explained by seasonal factors and a higher base effect. Notably, August 2025 excluded one additional business day compared to August 2024, totaling 24 working days (including Saturdays). Additionally, economic activity in the previous month registered an unexpected rebound of 4.4% y/y, which established a higher comparison base for August.
The services sector accounted for nearly the entire positive performance, contributing 2.2 percentage points (ppts) to overall economic growth (charts 3 and 4). Commerce, transportation, and housing expanded by 5.8% y/y and contributed 1.2 ppts. This was followed by public administration and leisure growing by 3.2% y/y and contributing 0.8 ppts, but showing a deceleration compared to July. In contrast, primary and secondary activities offset the result. Agriculture and mining contracted by 2.0% y/y (-0.3 ppts), mainly due to declines in coal and oil production within the mining industry. Followed by manufacturing and construction which contracted by 0.6% y/y subtracting 0.1 ppts from the total result.
Year-to-date, the Colombian economy has grown by 2.6%, same as our full-year projection of 2.6%. Despite the calendar effect observed in August and the base effects from July, structural trends continue to indicate that private consumption is driving the economic activity. This momentum is explained by historically high remittance inflows (+14% YTD up to August) and favourable FX performance. However, sectors linked to investment remain weak in their recovery which has affected long-term activity in Colombia. Regarding monetary policy, we maintain our expectation that the central bank will hold unchanged the interest rate at 9.25% at least through Q2 2026.
Highlights:
- The primary sector continued to contract notably in August, with both agricultural and mining activities declining by 2.0% y/y, contributing -0.3 ppts to overall economic performance. The downturn was mainly driven by weak results in the mining sector, due to a decrease in coal production and a 3.5% y/y drop in oil output, according to ANH data. These factors were reflected in a 21.1% y/y decline in mining exports. Agriculture also showed a negative trend, though with mixed signals: while exports surged by 30% y/y, the supply of agricultural products decelerated by 0.9% y/y and contracted by 6.95% m/m in August.
- Secondary activities declined by 0.6% y/y, contributing -0.1 ppts to overall economic growth, with construction showing a negative trend. The manufacturing output indicator for August rose by 1.0% y/y, falling short of Bloomberg’s survey expectation of 4.0% y/y. Within manufacturing, the strongest contributions came from the oil industry (+17.0% y/y), chemical products (+11.7% y/y), transport equipment (+42.0% y/y), and pharmaceutical products (+7.0% y/y). In contrast, the iron and steel industry (-22.7% y/y), beverages
(-4.4% y/y), and cocoa production (-18.9% y/y) were the main sectors offsetting the overall boost. - In construction, mixed effects were observed. Home sales increased by 2.4% y/y in August. However, civil works contributed negatively to the sector’s performance, and construction licenses registered a significant drop of 15.1% y/y in August, which explained the decline in the overall sector.
- The services sector continued to expand, with six service categories recording positive annual variations. Commerce and related services—including transportation and housing—were among the top contributors, with retail sales rising by 12.4% y/y in August. Personnel and cargo transportation activities, both air and land, showed positive performance, in contrast to housing, which recorded a negative variation amid a decline in the hotel occupancy rate from 53.1% in August 2024 to 52.1% in August 2025. Overall, the sector grew by 5.8% y/y, contributing 1.2 ppts to total economic growth.
- Public administration—which includes education and health services—and leisure (+3.2% y/y, +0.8 ppts contribution) were supported by public sector payments. Education showed growth, while health services recorded a negative trend. In leisure, the sector maintained its positive momentum, driven by major cultural events such as concerts and online sports betting. This was followed by real estate (+1.8% y/y, +0.1 ppts), financial and insurance activities (+2.0% y/y, +0.1 ppts), utilities (+2.1% y/y, +0.1 ppts), supported by the recovery of water reserves that boosted hydroelectric generation, though partially offset by negative gas production, and professional activities (+0.8% y/y, +0.1 ppts), which maintained growth. In contrast, communication services declined by 0.2% y/y, contributing -0.1 ppts, explained by fewer communication contracts across various sectors.
—Jackeline Piraján & Valentina Guio
DISCLAIMER
This report has been prepared by Scotiabank Economics as a resource for the clients of Scotiabank. Opinions, estimates and projections contained herein are our own as of the date hereof and are subject to change without notice. The information and opinions contained herein have been compiled or arrived at from sources believed reliable but no representation or warranty, express or implied, is made as to their accuracy or completeness. Neither Scotiabank nor any of its officers, directors, partners, employees or affiliates accepts any liability whatsoever for any direct or consequential loss arising from any use of this report or its contents.
These reports are provided to you for informational purposes only. This report is not, and is not constructed as, an offer to sell or solicitation of any offer to buy any financial instrument, nor shall this report be construed as an opinion as to whether you should enter into any swap or trading strategy involving a swap or any other transaction. The information contained in this report is not intended to be, and does not constitute, a recommendation of a swap or trading strategy involving a swap within the meaning of U.S. Commodity Futures Trading Commission Regulation 23.434 and Appendix A thereto. This material is not intended to be individually tailored to your needs or characteristics and should not be viewed as a “call to action” or suggestion that you enter into a swap or trading strategy involving a swap or any other transaction. Scotiabank may engage in transactions in a manner inconsistent with the views discussed this report and may have positions, or be in the process of acquiring or disposing of positions, referred to in this report.
Scotiabank, its affiliates and any of their respective officers, directors and employees may from time to time take positions in currencies, act as managers, co-managers or underwriters of a public offering or act as principals or agents, deal in, own or act as market makers or advisors, brokers or commercial and/or investment bankers in relation to securities or related derivatives. As a result of these actions, Scotiabank may receive remuneration. All Scotiabank products and services are subject to the terms of applicable agreements and local regulations. Officers, directors and employees of Scotiabank and its affiliates may serve as directors of corporations.
Any securities discussed in this report may not be suitable for all investors. Scotiabank recommends that investors independently evaluate any issuer and security discussed in this report, and consult with any advisors they deem necessary prior to making any investment.
This report and all information, opinions and conclusions contained in it are protected by copyright. This information may not be reproduced without the prior express written consent of Scotiabank.
™ Trademark of The Bank of Nova Scotia. Used under license, where applicable.
Scotiabank, together with “Global Banking and Markets”, is a marketing name for the global corporate and investment banking and capital markets businesses of The Bank of Nova Scotia and certain of its affiliates in the countries where they operate, including; Scotiabank Europe plc; Scotiabank (Ireland) Designated Activity Company; Scotiabank Inverlat S.A., Institución de Banca Múltiple, Grupo Financiero Scotiabank Inverlat, Scotia Inverlat Casa de Bolsa, S.A. de C.V., Grupo Financiero Scotiabank Inverlat, Scotia Inverlat Derivados S.A. de C.V. – all members of the Scotiabank group and authorized users of the Scotiabank mark. The Bank of Nova Scotia is incorporated in Canada with limited liability and is authorised and regulated by the Office of the Superintendent of Financial Institutions Canada. The Bank of Nova Scotia is authorized by the UK Prudential Regulation Authority and is subject to regulation by the UK Financial Conduct Authority and limited regulation by the UK Prudential Regulation Authority. Details about the extent of The Bank of Nova Scotia's regulation by the UK Prudential Regulation Authority are available from us on request. Scotiabank Europe plc is authorized by the UK Prudential Regulation Authority and regulated by the UK Financial Conduct Authority and the UK Prudential Regulation Authority.
Scotiabank Inverlat, S.A., Scotia Inverlat Casa de Bolsa, S.A. de C.V, Grupo Financiero Scotiabank Inverlat, and Scotia Inverlat Derivados, S.A. de C.V., are each authorized and regulated by the Mexican financial authorities.
Not all products and services are offered in all jurisdictions. Services described are available in jurisdictions where permitted by law.