- Colombia: GDP growth beat expectations on strong domestic demand
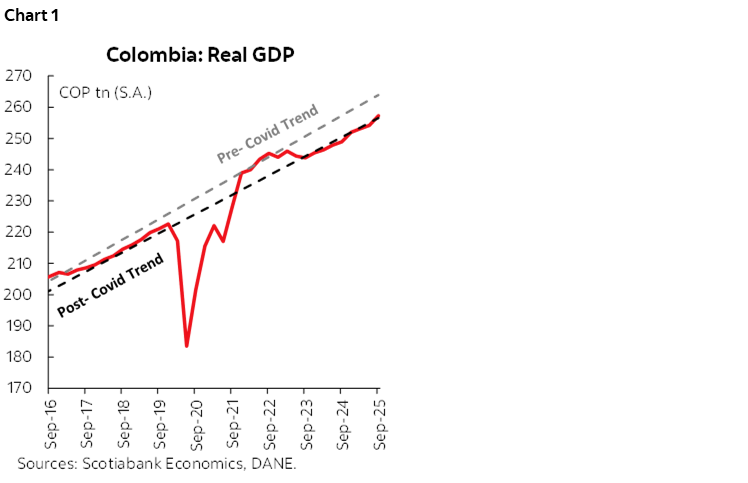
On Tuesday, November 18th, DANE reported GDP growth of 3.6% y/y in Q3-2025, well above BanRep’s expectation of 3.0%, the market consensus of 3.2%, and Scotiabank Colpatria’s projection of 2.9%. In seasonally adjusted terms, the economy expanded 1.2% q/q and 3.4% y/y, while in level terms activity is now slightly surpassing the post-pandemic trend (chart 1). It is worth noting that during the quarter there were two additional business days in July, which is an unusual occurrence that was a tailwind for the data.
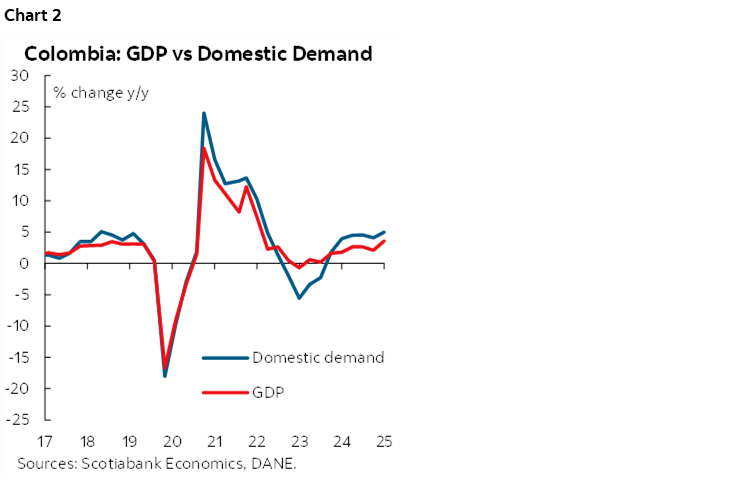
On the supply side, services-related sectors were the most dynamic, driven by acceleration in commerce, transport, and the hotels sector, along with manufacturing and a still robust contribution from public administration. On the demand side, domestic demand grew at a 5% y/y pace (chart 2), pointing to a widening real trade deficit amid significant household consumption growth and an even stronger expansion in public consumption.
A key question arising from this GDP performance concerns sustainability, as household consumption is being fueled by income shocks, while public spending contrasts with the context of high deficits and debt burdens. Either way, today’s figures support our view of monetary policy rate stability in the coming months, as solid economic performance provides a buffer to maintain a contractionary stance while we await relevant developments on the inflation front. The next GDP release is expected by mid-February, and although today’s numbers could skew our 2025 projection to the upside, we maintain our forecast of 2.6% growth.
Key takeaways:
- Supply Side: Economic growth was more broadly distributed across sectors compared to 2024, as 10 out of 12 sectors posted expansions (charts 3 and 4).
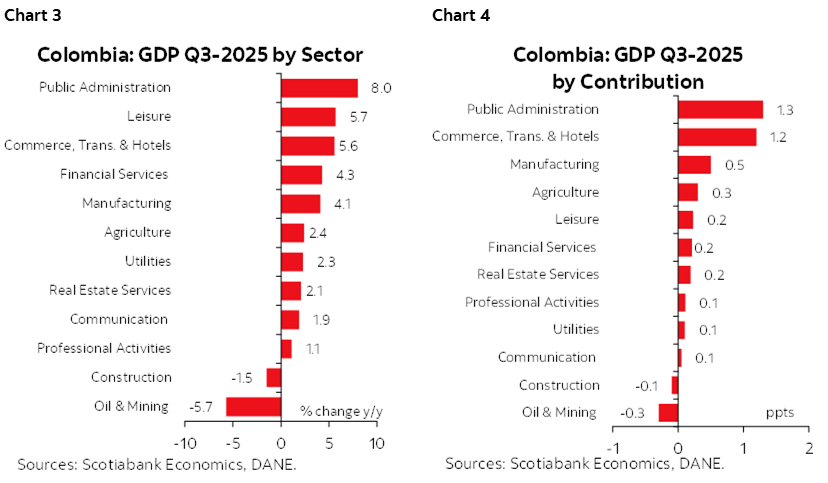
- Leading sectors: Three sectors accounted for 83% of total growth in Q3. Public administration, defense, health, and education grew by an impressive 8% y/y (contribution of 1.3 ppts), mainly due to higher payments to the defense sector and increased hiring in control entities related to the electoral process. Commerce, transport, and hotels expanded 5.6% y/y (contribution of 1.2 ppts), reflecting strong retail and wholesale sales amid robust household demand, especially for durable goods. Manufacturing (+4.1% y/y) rebounded, driven by oil refining (+7.3% y/y), clothing (+10.5% y/y), and food-related manufacturing (meat products) supported by stronger international demand.
- Compared to 2024, the composition of leading sectors changed. While the public sector remained strong, agriculture and leisure-related activities slowed: Agriculture grew 2.4% y/y, down from 10.8% in Q3-2024, due to weaker coffee production. However, food supply remains stable, helping keep food prices under control. Leisure expanded 5.7% y/y, nearly half of last year’s growth (11.5% y/y). Online gambling remains a leading segment, but fewer events moderated overall performance.
- Oil & Mining and Construction remain the weakest sectors, with activity levels 24% below pre-pandemic standards: Oil & Mining contracted 5.7% y/y, marking the seventh consecutive quarterly decline. Lower oil and gas output contributed -2.2 ppts, while metallic minerals (-18.2% y/y) accounted for -2.6 ppts, partly reflecting construction weakness. Construction fell 1.5% y/y, with a YTD decline of 2.7% y/y. Building construction remains 21% below pre-pandemic levels, weighed down by limited housing and office activity. Civil works (28% below pre-pandemic) have shown recovery since mid-2023, driven by regional infrastructure projects.
- Demand Side: Domestic final demand grew 5% y/y, the strongest since Q3-2022 and above the pre-pandemic five-year average of 2.5% y/y. This was supported by resilient private consumption and a sharp 14.2% y/y increase in public spending (chart 5).
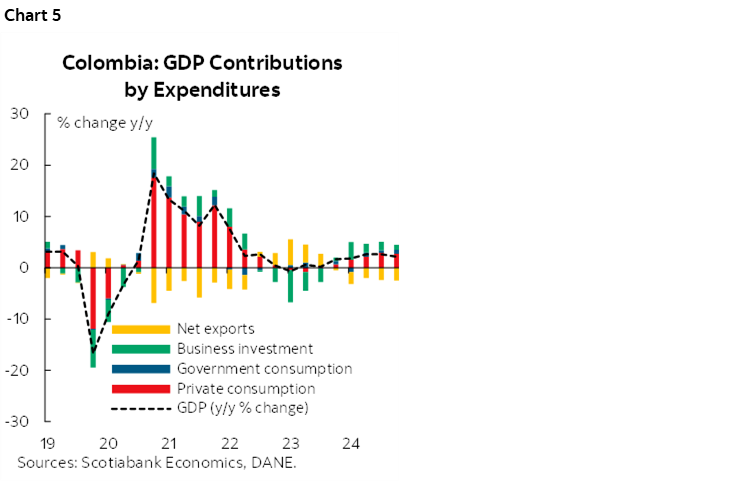
- Private consumption rose 4.2% y/y (YTD: 3.9%). Services (+2.9% y/y) and non-durable goods (+3.9% y/y) contributed 3 ppts. Durable goods (+17.2% y/y, 0.7 ppts) and semi-durable goods (+8.2% y/y, 0.4 ppts) outperformed last year. Consumption is mainly fueled by income shocks—remittances (~3% of GDP), informal activity, and real wage gains—rather than credit demand. Despite uncertainty about sustainability, decent savings levels support a positive outlook.
- Public spending surged 14.2% y/y, driven by higher wages (especially defense), pre-election hiring, increased education transfers, and delayed wage adjustments. Spending remains strong despite tight fiscal conditions, likely influenced by the electoral cycle. In 2026, contributions may moderate due to restrictions under the “Ley de Garantías.”
- Fixed capital formation rose 2.2% y/y, with investment up 4.8% y/y, signaling inventory reductions. Machinery and equipment (+13.9% y/y) led gains, linked to transport projects and agricultural investment. Housing investment remained weak.
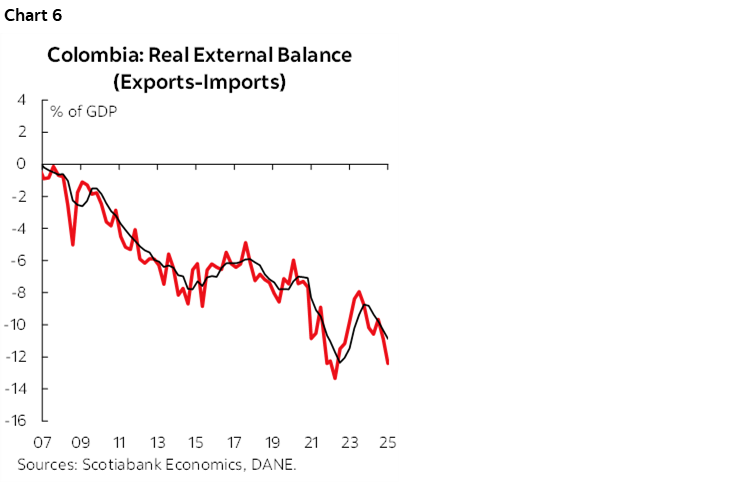
- Trade deficit widened: Imports grew 10% y/y, mainly transport-related goods, while exports rose 2.2% y/y, resulting in the largest trade gap since Q4-2022. Widening in the trade deficit (chart 6) reflects the stunning performance of the domestic demand, in terms of the external accounts of the balance of payments, we highlight that wider trade deficit is not fueling FX pressures as the relevant inflows of remittances maintains the current account deficit in low levels.
—Jackeline Piraján & Valentina Guio
DISCLAIMER
This report has been prepared by Scotiabank Economics as a resource for the clients of Scotiabank. Opinions, estimates and projections contained herein are our own as of the date hereof and are subject to change without notice. The information and opinions contained herein have been compiled or arrived at from sources believed reliable but no representation or warranty, express or implied, is made as to their accuracy or completeness. Neither Scotiabank nor any of its officers, directors, partners, employees or affiliates accepts any liability whatsoever for any direct or consequential loss arising from any use of this report or its contents.
These reports are provided to you for informational purposes only. This report is not, and is not constructed as, an offer to sell or solicitation of any offer to buy any financial instrument, nor shall this report be construed as an opinion as to whether you should enter into any swap or trading strategy involving a swap or any other transaction. The information contained in this report is not intended to be, and does not constitute, a recommendation of a swap or trading strategy involving a swap within the meaning of U.S. Commodity Futures Trading Commission Regulation 23.434 and Appendix A thereto. This material is not intended to be individually tailored to your needs or characteristics and should not be viewed as a “call to action” or suggestion that you enter into a swap or trading strategy involving a swap or any other transaction. Scotiabank may engage in transactions in a manner inconsistent with the views discussed this report and may have positions, or be in the process of acquiring or disposing of positions, referred to in this report.
Scotiabank, its affiliates and any of their respective officers, directors and employees may from time to time take positions in currencies, act as managers, co-managers or underwriters of a public offering or act as principals or agents, deal in, own or act as market makers or advisors, brokers or commercial and/or investment bankers in relation to securities or related derivatives. As a result of these actions, Scotiabank may receive remuneration. All Scotiabank products and services are subject to the terms of applicable agreements and local regulations. Officers, directors and employees of Scotiabank and its affiliates may serve as directors of corporations.
Any securities discussed in this report may not be suitable for all investors. Scotiabank recommends that investors independently evaluate any issuer and security discussed in this report, and consult with any advisors they deem necessary prior to making any investment.
This report and all information, opinions and conclusions contained in it are protected by copyright. This information may not be reproduced without the prior express written consent of Scotiabank.
™ Trademark of The Bank of Nova Scotia. Used under license, where applicable.
Scotiabank, together with “Global Banking and Markets”, is a marketing name for the global corporate and investment banking and capital markets businesses of The Bank of Nova Scotia and certain of its affiliates in the countries where they operate, including; Scotiabank Europe plc; Scotiabank (Ireland) Designated Activity Company; Scotiabank Inverlat S.A., Institución de Banca Múltiple, Grupo Financiero Scotiabank Inverlat, Scotia Inverlat Casa de Bolsa, S.A. de C.V., Grupo Financiero Scotiabank Inverlat, Scotia Inverlat Derivados S.A. de C.V. – all members of the Scotiabank group and authorized users of the Scotiabank mark. The Bank of Nova Scotia is incorporated in Canada with limited liability and is authorised and regulated by the Office of the Superintendent of Financial Institutions Canada. The Bank of Nova Scotia is authorized by the UK Prudential Regulation Authority and is subject to regulation by the UK Financial Conduct Authority and limited regulation by the UK Prudential Regulation Authority. Details about the extent of The Bank of Nova Scotia's regulation by the UK Prudential Regulation Authority are available from us on request. Scotiabank Europe plc is authorized by the UK Prudential Regulation Authority and regulated by the UK Financial Conduct Authority and the UK Prudential Regulation Authority.
Scotiabank Inverlat, S.A., Scotia Inverlat Casa de Bolsa, S.A. de C.V, Grupo Financiero Scotiabank Inverlat, and Scotia Inverlat Derivados, S.A. de C.V., are each authorized and regulated by the Mexican financial authorities.
Not all products and services are offered in all jurisdictions. Services described are available in jurisdictions where permitted by law.