- Colombia: Inflation accelerates beyond expectations, reaching 5.51% y/y in October
- Mexico: Construction drives industrial production weakness, formal employment picks up
COLOMBIA: INFLATION ACCELERATES BEYOND EXPECTATIONS, REACHING 5.51% Y/Y IN OCTOBER
Colombia’s monthly CPI inflation stood at 0.18% m/m in October, according to data published by DANE on Monday, November 10th, 2025. This result was above analysts’ expectations in the BanRep survey (0.14% m/m avg) and below Scotiabank Colpatria’s forecast (0.21% m/m). During the month, 10 of the 12 consumption groups registered positive monthly variations, with lodging & utilities and restaurants & hotels contributing the most to total inflation, accounting for 89%.
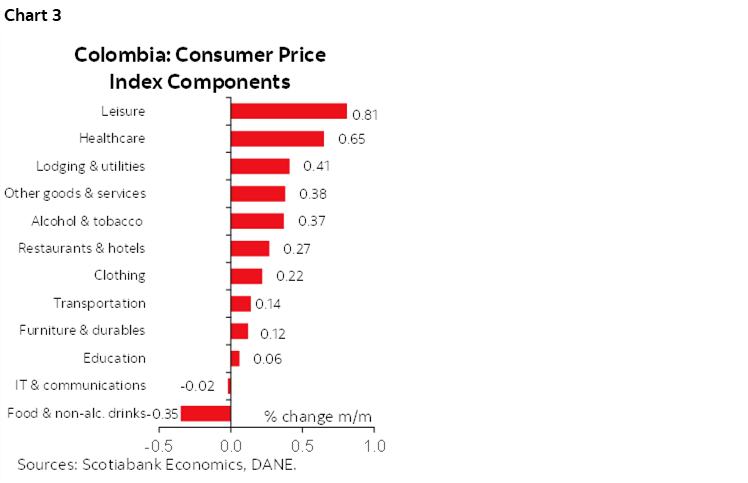
Annual inflation accelerated from 5.18% to 5.51% in October (chart 1), continuing the uptrend observed in the previous month. This increase represents the highest data since September 2024 and was mainly driven, again, by lodging and utilities (chart 2) which increased by 0.41% m/m and 5.30% y/y, especially due to increases in rent fees that are indexed to last year’s inflation and water fees, followed by restaurants & hotels which increased by 0.27% m/m and 7.61% y/y due to restaurants which increased by 0.27% m/m (7.67% y/y).
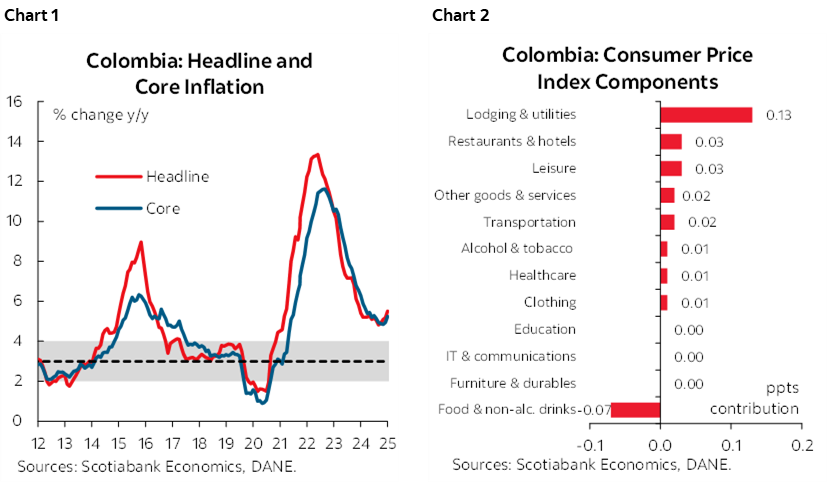
Regarding core measures, ex-food inflation increased from 4.94% y/y to 5.25% y/y, while core inflation (excluding food and regulated prices) showed an increase from 4.84% y/y to 4.99% y/y. Services inflation (excluding food and regulated prices) increased from 5.82% y/y to 5.90% y/y, with rental prices increasing by 5.37% y/y (0.29% m/m). Meanwhile, goods inflation rose from 2.24% to 2.59% y/y, but still within the target range (2%–4%). Regulated prices increased from 5.29% y/y to 6.10% y/y, mainly due to rebound in utilities’ inflation (3.54% y/y on gas and electricity prices and 7.77% y/y on water and housing services).
These results support our expectation that inflation will likely close well above 5% in 2025. We project year-end inflation at around 5.3% for December 2025, and above 4% for December 2026. This trajectory will largely depend on the increase in the minimum wage, as according to public announcements the government supports a double-digit increase, and usually this adjustment impact services prices. If the wage adjustment exceeds the traditional rule of inflation plus productivity, it could skew our inflation forecast to the upside.
Given this context, we discard any interest rate cuts by the central bank for the rest of 2025. We only see the possibility of resuming the easing cycle in 2026, once it is confirmed that indexation effects will not prevent inflation from continuing to decline. In fact we now tend to think that the easing cycle can be resumed until the third quarter of 2026.
Complementary highlights:
- Two groups accounted for 89% of total inflation. Lodging and utilities were the largest contributor with a monthly increase of 0.41% (5.30% y/y) and a contribution of 13 bps. Rent fees rose by 5.37% y/y (0.29% m/m) making the largest contribution to total inflation, followed by water fees which increased by 6.85% y/y (1.56% m/m). Electricity prices (0.44% m/m) recorded a positive trend in annual terms (0.52% y/y) for the first time since March 2025, due to regular price adjustment.
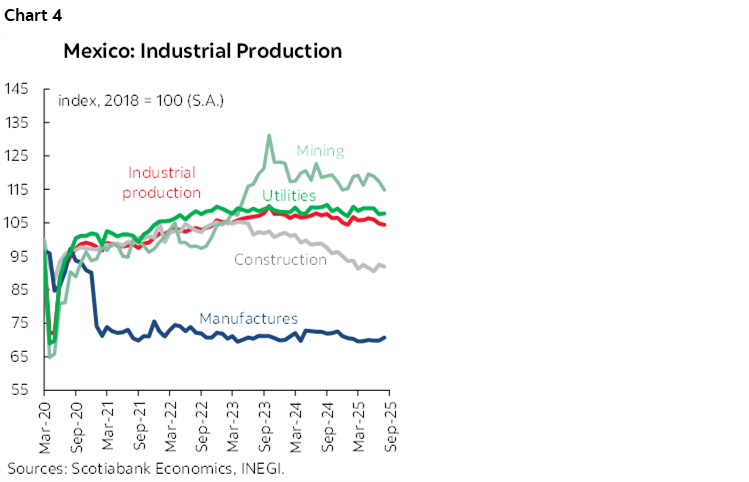
- Other items contributed to total inflation. Leisure increased by 2.74% y/y (0.81% m/m) and contributed 3 bps (chart 3), in which tour packages were the main driver (7.70% y/y and 3.36% m/m) amid school break week in October, and strong domestic demand. In contrast, food and non-alcoholic drinks decreased by -0.35% m/m offsetting the monthly headline inflation by 7 bps. However, on an annual terms, food inflation accelerated to 6.64% y/y, due to a significantly low statistical base from the previous year. Within food group, fruits and vegetables such as tomatoes, carrots, onions, and potatoes contributed negatively to total inflation, in contrast with meat which grew by 1.04% m/m (8.33% y/y). Food supply continued with positive figures and accelerated by 5.62% m/m (6.49% y/y) in October.
Services inflation increased by 5.90% y/y. The increase was associated to the acceleration in some services such as rental prices and leisure. Goods-related prices increased again to 2.59% y/y, a curious dynamic since in 2025 the FX appreciation (more than 20% YTD) is a tail wind that could promote more stable prices of tradable goods. Booth, the stickiness in services and increasing goods inflation are probably reflecting the effect of a robust households’ demand.
—Jackeline Piraján & Valentina Guio
MEXICO: CONSTRUCTION DRIVES INDUSTRIAL PRODUCTION WEAKNESS, FORMAL EMPLOYMENT PICKS UP
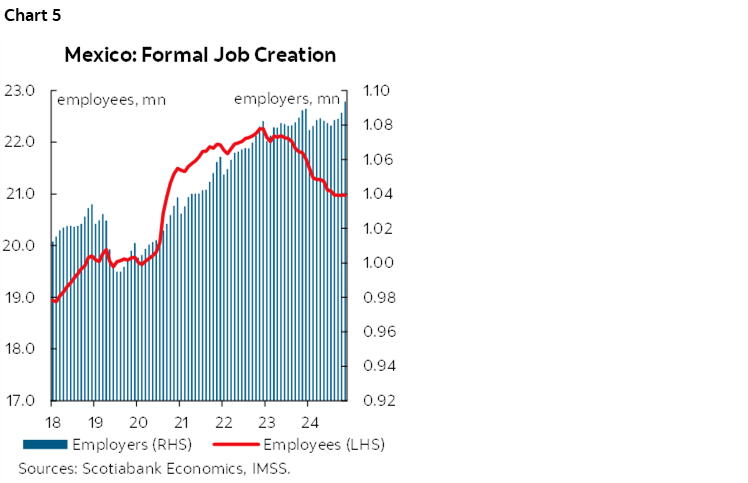
In September, industrial activity declined 0.4% in its seasonally adjusted monthly variation and 2.4% year-over-year in original figures. By component and in seasonally adjusted monthly terms compared to August (chart 4), construction was the main driver of the contraction, falling 2.5%. In contrast, mining (0.7%), power generation and transmission (0.4%), and manufacturing (0.2%) posted slight gains, remaining relatively stable. However, on an annual basis, all components recorded declines: construction fell 7.9%, mining 3.1%, manufacturing 0.8%, and power generation and transmission 0.1%. Thus, year-to-date, industrial activity shows a real annual variation of -1.8%, marking nine consecutive months of downward revisions.
According to IMSS data, in October, 217,491 jobs affiliated with social security were created (chart 5), bringing the total to 22,789,491 employees. Over the past twelve months, job creation amounted to 170,231 positions, equivalent to an annual increase of 0.8%, accelerating from the previous 0.4%. Similarly, the total number of employers also rose, with 181 new registrations, reaching 1,039,408 employers, the first monthly increase since May 2024. Meanwhile, the average daily base salary stood at $622 pesos, representing a nominal increase of 7.1%, maintaining the pace of growth from the previous month. If formal employment continues to strengthen during the last quarter, it could positively impact household consumption prospects at year-end.
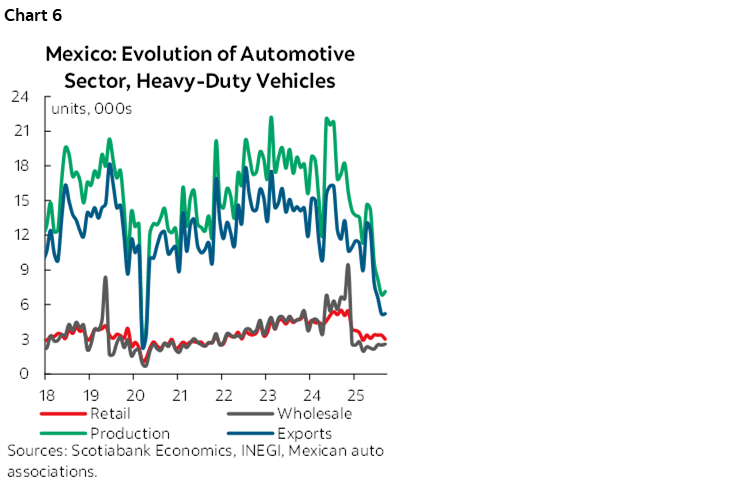
Finally, in the heavy vehicle sector, production in October posted an annual decline of 58.8% (chart 6), marking eleven consecutive months of contraction, while exports fell 55.3%, with 14 months of decreases. Regarding sales, retail totaled 3,009 units, an annual drop of 45.5%, and wholesale sales fell 61.0%, reaching 2,603 units, both indicators showing ten consecutive months of contraction.
—Rodolfo Mitchell, Miguel Saldaña & Martha Cordova
DISCLAIMER
This report has been prepared by Scotiabank Economics as a resource for the clients of Scotiabank. Opinions, estimates and projections contained herein are our own as of the date hereof and are subject to change without notice. The information and opinions contained herein have been compiled or arrived at from sources believed reliable but no representation or warranty, express or implied, is made as to their accuracy or completeness. Neither Scotiabank nor any of its officers, directors, partners, employees or affiliates accepts any liability whatsoever for any direct or consequential loss arising from any use of this report or its contents.
These reports are provided to you for informational purposes only. This report is not, and is not constructed as, an offer to sell or solicitation of any offer to buy any financial instrument, nor shall this report be construed as an opinion as to whether you should enter into any swap or trading strategy involving a swap or any other transaction. The information contained in this report is not intended to be, and does not constitute, a recommendation of a swap or trading strategy involving a swap within the meaning of U.S. Commodity Futures Trading Commission Regulation 23.434 and Appendix A thereto. This material is not intended to be individually tailored to your needs or characteristics and should not be viewed as a “call to action” or suggestion that you enter into a swap or trading strategy involving a swap or any other transaction. Scotiabank may engage in transactions in a manner inconsistent with the views discussed this report and may have positions, or be in the process of acquiring or disposing of positions, referred to in this report.
Scotiabank, its affiliates and any of their respective officers, directors and employees may from time to time take positions in currencies, act as managers, co-managers or underwriters of a public offering or act as principals or agents, deal in, own or act as market makers or advisors, brokers or commercial and/or investment bankers in relation to securities or related derivatives. As a result of these actions, Scotiabank may receive remuneration. All Scotiabank products and services are subject to the terms of applicable agreements and local regulations. Officers, directors and employees of Scotiabank and its affiliates may serve as directors of corporations.
Any securities discussed in this report may not be suitable for all investors. Scotiabank recommends that investors independently evaluate any issuer and security discussed in this report, and consult with any advisors they deem necessary prior to making any investment.
This report and all information, opinions and conclusions contained in it are protected by copyright. This information may not be reproduced without the prior express written consent of Scotiabank.
™ Trademark of The Bank of Nova Scotia. Used under license, where applicable.
Scotiabank, together with “Global Banking and Markets”, is a marketing name for the global corporate and investment banking and capital markets businesses of The Bank of Nova Scotia and certain of its affiliates in the countries where they operate, including; Scotiabank Europe plc; Scotiabank (Ireland) Designated Activity Company; Scotiabank Inverlat S.A., Institución de Banca Múltiple, Grupo Financiero Scotiabank Inverlat, Scotia Inverlat Casa de Bolsa, S.A. de C.V., Grupo Financiero Scotiabank Inverlat, Scotia Inverlat Derivados S.A. de C.V. – all members of the Scotiabank group and authorized users of the Scotiabank mark. The Bank of Nova Scotia is incorporated in Canada with limited liability and is authorised and regulated by the Office of the Superintendent of Financial Institutions Canada. The Bank of Nova Scotia is authorized by the UK Prudential Regulation Authority and is subject to regulation by the UK Financial Conduct Authority and limited regulation by the UK Prudential Regulation Authority. Details about the extent of The Bank of Nova Scotia's regulation by the UK Prudential Regulation Authority are available from us on request. Scotiabank Europe plc is authorized by the UK Prudential Regulation Authority and regulated by the UK Financial Conduct Authority and the UK Prudential Regulation Authority.
Scotiabank Inverlat, S.A., Scotia Inverlat Casa de Bolsa, S.A. de C.V, Grupo Financiero Scotiabank Inverlat, and Scotia Inverlat Derivados, S.A. de C.V., are each authorized and regulated by the Mexican financial authorities.
Not all products and services are offered in all jurisdictions. Services described are available in jurisdictions where permitted by law.