- Chile: April CPI of 0.2% m/m (4.5% y/y) supports our more benign inflation outlook
- Mexico: Inflation rises, driven by pressures in goods and services
- Colombia: Exports increase in March despite low oil prices, while non-traditional exports remain positive
CHILE: APRIL CPI OF 0.2% M/M (4.5% Y/Y) SUPPORTS OUR MORE BENIGN INFLATION OUTLOOK
- We project annual inflation to fall below 4% in July
On Tuesday, May 8th, the INE released April CPI data showing a 0.2% m/m (4.5% y/y) increase in prices, below market expectations and our own, which were biased downward. Regarding our projection, the main downward surprises came from volatile items concentrated in the food, apparel, and footwear division and the healthcare division. While this reading would not have been a significant surprise for the Central Bank (BCCh) at the headline level, it would have been slightly below its core CPI projection, accumulating a new surprise for the March IPoM scenario.
Inflationary diffusion is slightly below historical average levels, a sign of limited inflationary pressures in an environment of high exchange rate volatility (chart 1 and 2). Ex-volatile CPI recorded inflationary diffusion around average, which, combined with the low number of volatile products that increased in price, explains the low inflation in April. While an increase in the diffusion of CPI of goods (ex-volatiles) was observed, placing it above average, as expected given the depreciation of the peso in previous weeks, this was offset by the significant drop in the diffusion of CPI of services (ex-volatiles), which, after several months, is back at the lower end of its historical range. According to our estimates, nearly 60% of price adjustments due to past inflation (second-round effects) occur between January and April of each year, so going forward, inflationary pressures on services are expected to remain limited, with inflation around or below their averages.
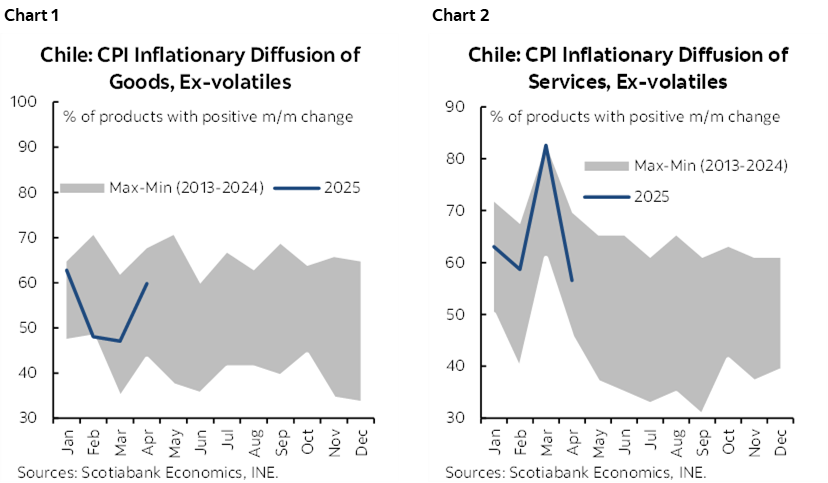
Cyber Day 2025 could temporarily lift inflationary diffusion in goods in May. Last year, the May CPI was partly explained by greater inflationary diffusion in goods associated with a general increase in their prices, in the run-up to Cyber Day, which took place in early June. For this year, we raise the risk of seeing diffusion levels temporarily above historical averages, which could affect inflation for the month.
The market anticipates inflation slightly above historical levels during the second half of the year, which we estimate is due to the incorporation of electricity rate increases and external inflationary effects. For our part, we estimate lower inflation due to additional currency appreciation and significant, but still limited, consumption growth. In this scenario, we maintain our 2025 annual inflation projection of 3.5% (Dec/Dec). We expect that after the recently released April CPI, the market will correct implicit inflation somewhat downward.
—Aníbal Alarcón
MEXICO: INFLATION RISES, DRIVEN BY PRESSURES IN GOODS AND SERVICES
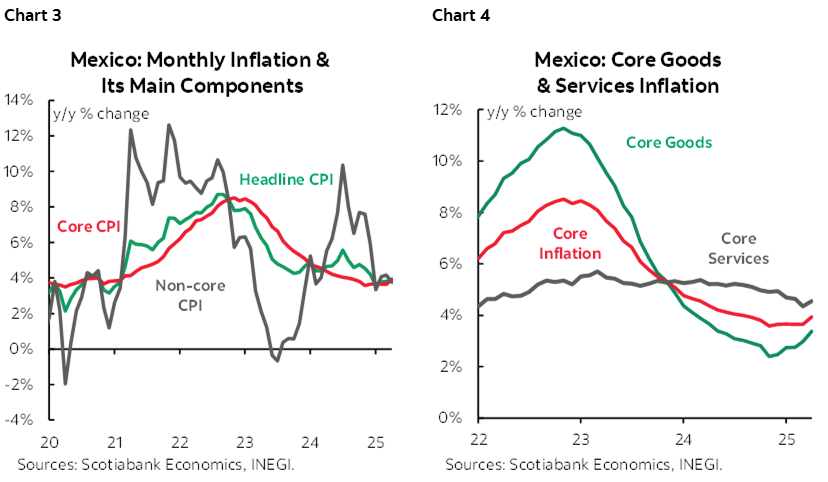
In April, inflation rose to 3.93% y/y from 3.80% (vs. 3.91% consensus in the Citi Survey), with core inflation also reaching 3.93%, up from 3.64% (vs. 3.92% consensus) (chart 3 and 4). Within the core component, goods inflation increased to 3.38% (2.98% previously), while services rose to 4.56% (4.35% previously). On the other hand, non-core inflation moderated to 3.76% (4.16% previously), with agricultural prices slowed down to 4.13% (4.87% previously), including a -2.45% drop in fruits and vegetables. On a monthly basis, headline inflation rose 0.33% (0.31% previously, 0.31% consensus), core inflation increased 0.49% (0.43% previously, 0.48% consensus), and non-core inflation stood at 0.21% (-0.08% previously). In the coming months, it will be crucial to monitor the evolution of the goods component to assess whether it is affected by a more depreciated exchange rate or if the impact of an economic slowdown on service prices prevails.
—Rodolfo Mitchell, Brian Pérez & Miguel Saldaña
COLOMBIA: EXPORTS INCREASE IN MARCH DESPITE LOW OIL PRICES, WHILE NON-TRADITIONAL EXPORTS REMAIN POSITIVE
DANE published export data on Wednesday, May 7th. Monthly exports in March reached US$4.33 billion FOB, representing a 12.2% increase compared to March 2024 (chart 5). Compared to the previous month, total exports registered a significant increase of 26.3%. Non-traditional exports maintained good momentum, and this month in particular, non-traditional exports achieved greater momentum, with coffee exports being the main player (chart 6).
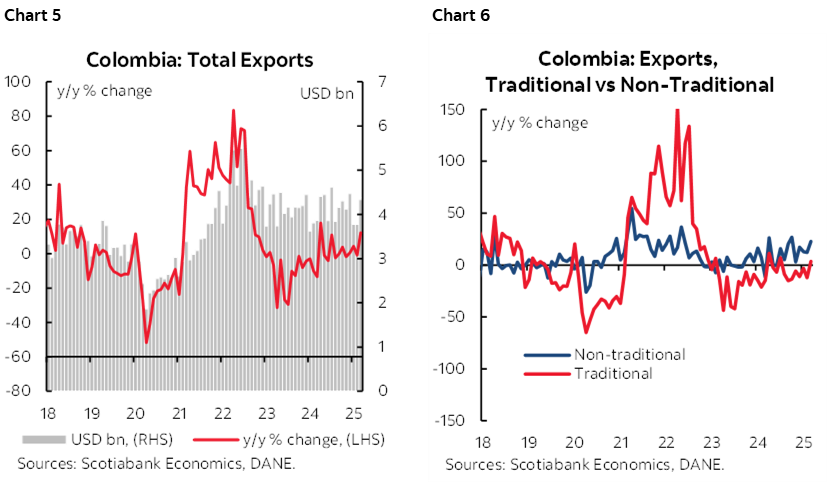
Exports broke a streak of weak growth, with March being the month with the highest growth in 12 months. Coffee exports registered significant growth exceeding 100%, maintaining the positive trend of the last year, thanks to a combination of better prices and increased export volume. Meanwhile, non-traditional exports continue to register a positive balance, representing around 50% of total exports, with food (excluding coffee) and manufactured goods being the most notable.
Commodity prices continue to play a key role in export performance. Coal exports continue to register double-digit declines, with low export volumes and prices failing to contribute. Meanwhile, oil prices continue to hinder further export recovery. March registered the highest export volume of oil since 2020, with 3.08 million tons. However, the drop in prices prevented increased export revenues from this product, reaching USD $1.39 billion (+2.85% y/y).
Despite the decrease in prices, the first quarter closed with a positive balance for exports. The cumulative balance through March reached USD 11.89 billion FOB, representing 5.3% increase compared to the first quarter of 2024. Traditional exports totaled USD 5.89 billion FOB, falling -3.8% compared to the first quarter of 2024, while non-traditional exports reached USD 5.99 FOB, increasing by +16% y/y compared to the first quarter of 2024.
- In March, traditional exports stood at USD 2.20 billion FOB, registering a 3.48% y/y increase. International prices have influenced the slowdown in coal and oil exports, however, oil exports rebounded due to higher export volumes. Oil exports increased 2.85% y/y in value, while, in volume, oil exports reached their highest level since May 2020. On the other hand, ferronickel exports increased 41.37% y/y, while coal exports fell -55.19% y/y, the largest decline since July 2023.
- Non-traditional exports stood at US$2.13 billion FOB, registering a 22.9% y/y increase. Non-traditional exports have maintained a positive trend, representing approximately 50% of total exports. Exports of food and agricultural products, excluding coffee, increased by 19% y/y, with increases in fruits, oils, and animal products. Meanwhile, manufactured exports increased by 16% y/y, with plastics, electrical appliances, and personal hygiene products contributing the most. Non-monetary gold exports accounted for 8% of total exports, valued at US$343 million (+51.1% y/y).
—Daniela Silva
DISCLAIMER
This report has been prepared by Scotiabank Economics as a resource for the clients of Scotiabank. Opinions, estimates and projections contained herein are our own as of the date hereof and are subject to change without notice. The information and opinions contained herein have been compiled or arrived at from sources believed reliable but no representation or warranty, express or implied, is made as to their accuracy or completeness. Neither Scotiabank nor any of its officers, directors, partners, employees or affiliates accepts any liability whatsoever for any direct or consequential loss arising from any use of this report or its contents.
These reports are provided to you for informational purposes only. This report is not, and is not constructed as, an offer to sell or solicitation of any offer to buy any financial instrument, nor shall this report be construed as an opinion as to whether you should enter into any swap or trading strategy involving a swap or any other transaction. The information contained in this report is not intended to be, and does not constitute, a recommendation of a swap or trading strategy involving a swap within the meaning of U.S. Commodity Futures Trading Commission Regulation 23.434 and Appendix A thereto. This material is not intended to be individually tailored to your needs or characteristics and should not be viewed as a “call to action” or suggestion that you enter into a swap or trading strategy involving a swap or any other transaction. Scotiabank may engage in transactions in a manner inconsistent with the views discussed this report and may have positions, or be in the process of acquiring or disposing of positions, referred to in this report.
Scotiabank, its affiliates and any of their respective officers, directors and employees may from time to time take positions in currencies, act as managers, co-managers or underwriters of a public offering or act as principals or agents, deal in, own or act as market makers or advisors, brokers or commercial and/or investment bankers in relation to securities or related derivatives. As a result of these actions, Scotiabank may receive remuneration. All Scotiabank products and services are subject to the terms of applicable agreements and local regulations. Officers, directors and employees of Scotiabank and its affiliates may serve as directors of corporations.
Any securities discussed in this report may not be suitable for all investors. Scotiabank recommends that investors independently evaluate any issuer and security discussed in this report, and consult with any advisors they deem necessary prior to making any investment.
This report and all information, opinions and conclusions contained in it are protected by copyright. This information may not be reproduced without the prior express written consent of Scotiabank.
™ Trademark of The Bank of Nova Scotia. Used under license, where applicable.
Scotiabank, together with “Global Banking and Markets”, is a marketing name for the global corporate and investment banking and capital markets businesses of The Bank of Nova Scotia and certain of its affiliates in the countries where they operate, including; Scotiabank Europe plc; Scotiabank (Ireland) Designated Activity Company; Scotiabank Inverlat S.A., Institución de Banca Múltiple, Grupo Financiero Scotiabank Inverlat, Scotia Inverlat Casa de Bolsa, S.A. de C.V., Grupo Financiero Scotiabank Inverlat, Scotia Inverlat Derivados S.A. de C.V. – all members of the Scotiabank group and authorized users of the Scotiabank mark. The Bank of Nova Scotia is incorporated in Canada with limited liability and is authorised and regulated by the Office of the Superintendent of Financial Institutions Canada. The Bank of Nova Scotia is authorized by the UK Prudential Regulation Authority and is subject to regulation by the UK Financial Conduct Authority and limited regulation by the UK Prudential Regulation Authority. Details about the extent of The Bank of Nova Scotia's regulation by the UK Prudential Regulation Authority are available from us on request. Scotiabank Europe plc is authorized by the UK Prudential Regulation Authority and regulated by the UK Financial Conduct Authority and the UK Prudential Regulation Authority.
Scotiabank Inverlat, S.A., Scotia Inverlat Casa de Bolsa, S.A. de C.V, Grupo Financiero Scotiabank Inverlat, and Scotia Inverlat Derivados, S.A. de C.V., are each authorized and regulated by the Mexican financial authorities.
Not all products and services are offered in all jurisdictions. Services described are available in jurisdictions where permitted by law.