- Mexico: Inflation in the first half of May accelerated more than expected, with a notable increase in agricultural products; 1Q25 GDP details show large drop in mining
- Peru: Mining Sector Overview (Q1 2025)
MEXICO: INFLATION IN THE FIRST HALF OF MAY ACCELERATED MORE THAN EXPECTED, WITH A NOTABLE INCREASE IN AGRICULTURAL PRICES
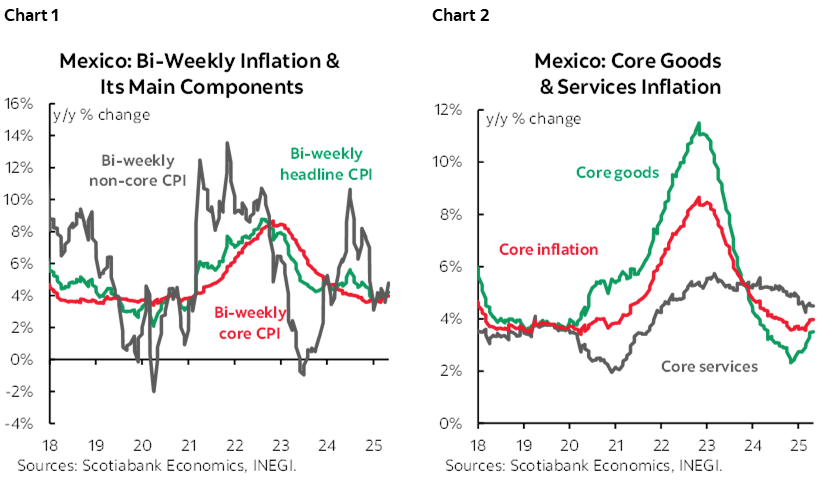
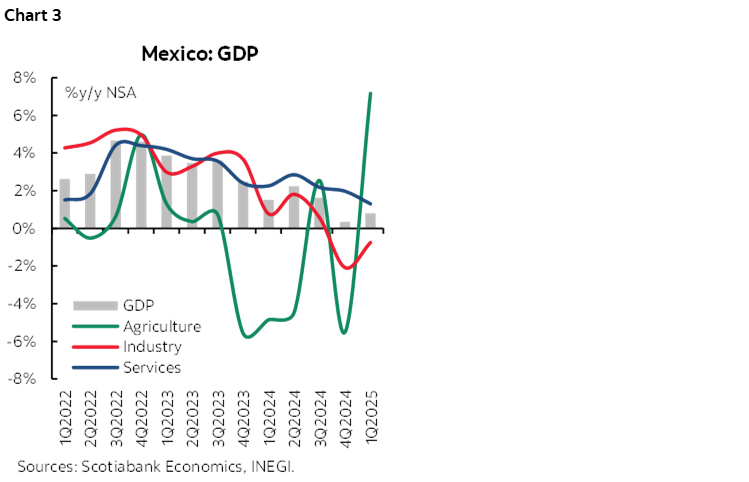
Inflation in the first half of May accelerated more than expected, reaching 4.22% y/y (chart 1 and 2), up from 3.90% (vs. 3.99% consensus from Citi Survey). However, core inflation remained relatively stable at 3.97%, compared to 3.96% previously (vs. 3.96% consensus). Within the core index, goods inflation rose to 3.51% (from 3.48%), while services inflation stood at 4.49% (down slightly from 4.51%). On the other hand, non-core inflation saw a significant increase to 4.78% (from 3.57%), driven by a sharp acceleration in agricultural products to 5.79% (from 3.86%), while energy and government tariffs stood at 3.71%. On a biweekly sequential basis, headline inflation rose by 0.09% (0.20% previously, -0.13% consensus), core inflation increased by 0.16% (0.13% previously, 0.15% consensus), and non-core inflation declined by -0.15% (0.42% previously). Looking ahead, we believe inflationary risks remain tilted to the upside. We highlight the potential pass-through effect from the depreciation of the exchange rate, as well as the possibility of a significant rebound in the non-core component due to weather-related events in the coming months.
1Q25 GDP DETAILS SHOW LARGE DROP IN MINING
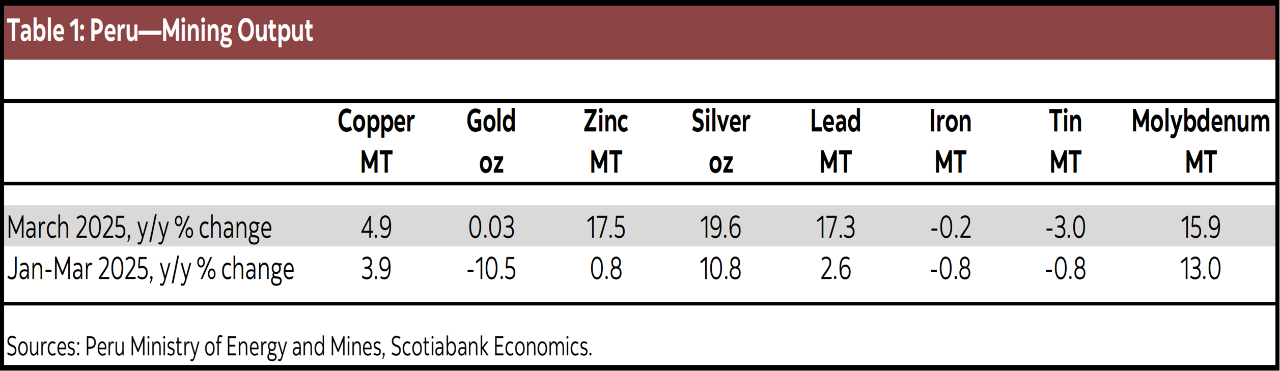
In Mexico, GDP growth for 1Q25 remained unchanged from the flash estimate, with a year-over-year increase of 0.8% y/y (chart 3), higher than the 0.4% recorded in 4Q24. Across the three main sectors, the industrial sector declined by -0.7% y/y, services grew by 1.3%, and the primary sector rose by 7.2% (agriculture jumped 11.5% y/y).
Within the industrial sector, there was a sharp drop in mining (-9.3% y/y), followed by utilities (-0.8%) and construction (-0.2%), while manufacturing showed a 0.7% increase. In the services sector, the largest declines were in wholesale trade (-4.6%), accommodation and food services (-1.9%), and corporate services (-0.5%). On the other hand, the best-performing sectors were professional services (15.0%), business support (14.4%), entertainment (11.3%), and healthcare (4.0%).
On a quarterly basis, GDP rose 0.2% q/q, up from -0.7% previously, in line with consensus expectations. The industrial sector fell -0.1% q/q (vs. -1.5% previously), services slightly declined -0.1% (vs. 0.0% previous), and the primary sector grew 7.8% (vs. -6.5% previous).
In March alone, the IGAE (Global Indicator of Economic Activity) rose 2.5% y/y after a -0.6% decline in February, owing to growing agricultural activities (9.6%), as well as increases in services (2.6%) and industry (1.9%). Manufactures edged up to 3.1% after four negative prints, while construction also increased, to 5.4%. In services, retail surged accelerated to 6.2%, while wholesale increased 0.1% after seven months of setbacks.
On a monthly s.a. basis, the GDP proxy showed a decline of -0.4%. Primary activities rebounded 4.3% m/m; industry fell -0.9%, with a -1.1% drop in manufacturing and a more pronounced -2.7% decline in mining, which were not offset by a 0.8% rise in construction. Services decreased -0.4%, with the steepest drops in professional services (-5.2%), entertainment (-2.7%), and accommodation services (-1.3%).
In the coming months, economic activity is expected to remain sluggish due to slower consumption and ongoing uncertainty that could offset investment.
—Rodolfo Mitchell, Brian Pérez & Miguel Saldaña
PERU: MINING SECTOR OVERVIEW (Q1 2025)
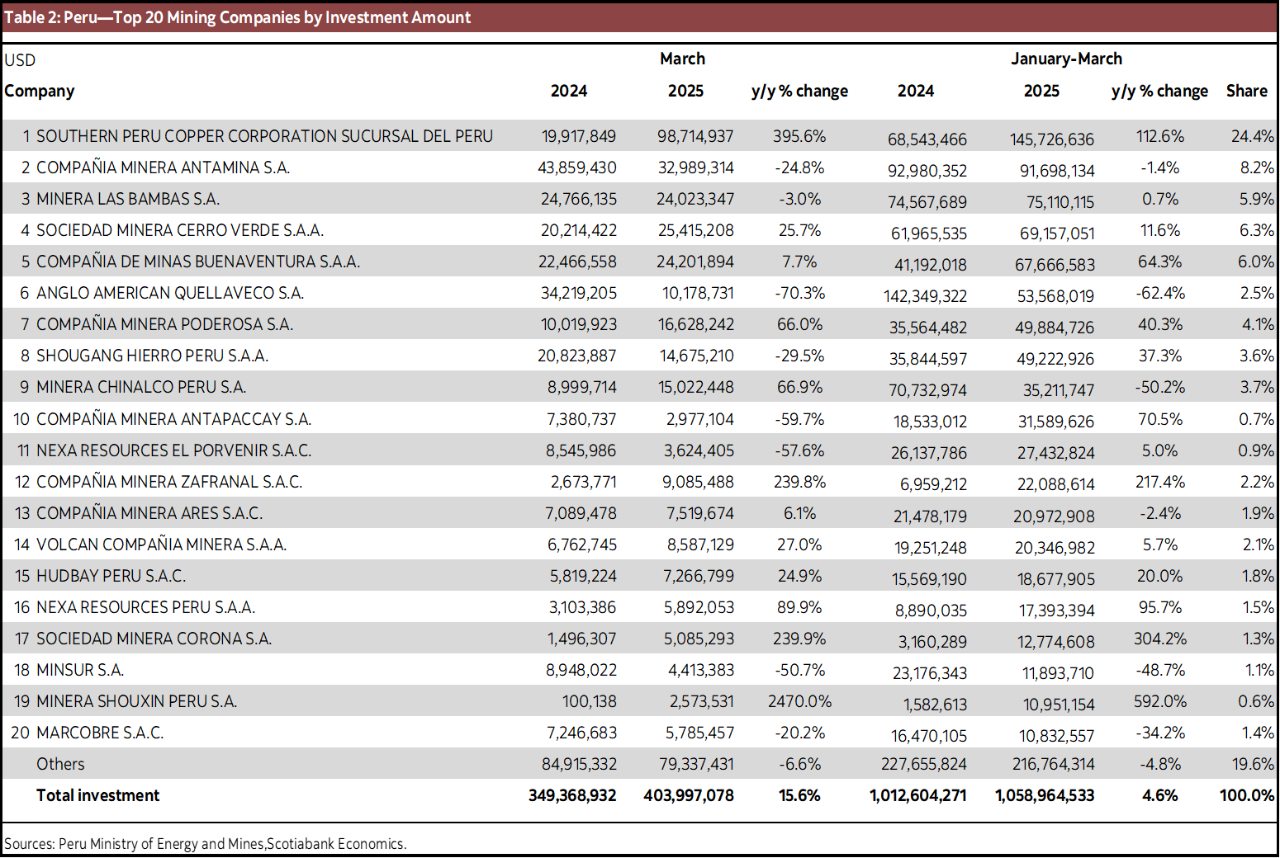
Mining GDP grew by 3.1% in Q1 2025 (table 1), driven by higher output of copper, silver, molybdenum, zinc, and lead. By contrast, gold, iron, and tin production declined. We expect sector growth to decelerate starting in May due to ore producer Shougang’s temporary suspension and a 30-day mining ban in Pataz province which excludes formal mining companies.
Shougang halted operations for five months after the collapse of its only shiploader at the San Nicolas port, paralyzing exports. Shougang accounts for 98.4% of Peru’s iron ore production, so its operational halt will be significant on national output.
Copper production rose 3.9% y/y, driven by higher contributions from Las Bambas, Chinalco, Quellaveco, and Marcobre, offsetting declines at Cerro Verde, Antamina, and Antapaccay. Las Bambas benefited from higher ore grades and recovery rates, while Chinalco ramped up output following the completion of its Toromocho Phase II expansion in mid-2024. This is also the first full year of production at Chalcobamba Phase I.
Silver production increased 10.8%, boosted by Buenaventura’s new Yumpag mine, better-than-expected ore grades, and a low base effect at Antamina. Molybdenum output jumped 13.0%, supported by higher grades at Southern Copper, a rebound at Cerro Verde after 2024 maintenance downtime, and the startup of Toromocho Phase II at Chinalco. Lead production rose 2.6%.
Gold production fell 10.5%, dragged down by lower grades at Poderosa and declining output from Consorcio Minero Horizonte and Aurifera Retamas, all operating in Pataz—an area increasingly affected by illegal mining and rising security threats. Boroo stabilized production following record output in 2024. Zinc, iron, and tin production declined slightly (-0.8% each).
Mining investment (table 2) totaled US$1.06 billion in Q1 2025 (+4.6% y/y), led by greenfield projects like San Gabriel (Buenaventura) and Romina (Chungar), as well as brownfield expansions such as Inmaculada (Ares) and Antamina. We maintain our 2025 mining investment forecast at US$5.3 billion, supported by favourable metal prices that continue to encourage project development.
—Katherine Salazar
DISCLAIMER
This report has been prepared by Scotiabank Economics as a resource for the clients of Scotiabank. Opinions, estimates and projections contained herein are our own as of the date hereof and are subject to change without notice. The information and opinions contained herein have been compiled or arrived at from sources believed reliable but no representation or warranty, express or implied, is made as to their accuracy or completeness. Neither Scotiabank nor any of its officers, directors, partners, employees or affiliates accepts any liability whatsoever for any direct or consequential loss arising from any use of this report or its contents.
These reports are provided to you for informational purposes only. This report is not, and is not constructed as, an offer to sell or solicitation of any offer to buy any financial instrument, nor shall this report be construed as an opinion as to whether you should enter into any swap or trading strategy involving a swap or any other transaction. The information contained in this report is not intended to be, and does not constitute, a recommendation of a swap or trading strategy involving a swap within the meaning of U.S. Commodity Futures Trading Commission Regulation 23.434 and Appendix A thereto. This material is not intended to be individually tailored to your needs or characteristics and should not be viewed as a “call to action” or suggestion that you enter into a swap or trading strategy involving a swap or any other transaction. Scotiabank may engage in transactions in a manner inconsistent with the views discussed this report and may have positions, or be in the process of acquiring or disposing of positions, referred to in this report.
Scotiabank, its affiliates and any of their respective officers, directors and employees may from time to time take positions in currencies, act as managers, co-managers or underwriters of a public offering or act as principals or agents, deal in, own or act as market makers or advisors, brokers or commercial and/or investment bankers in relation to securities or related derivatives. As a result of these actions, Scotiabank may receive remuneration. All Scotiabank products and services are subject to the terms of applicable agreements and local regulations. Officers, directors and employees of Scotiabank and its affiliates may serve as directors of corporations.
Any securities discussed in this report may not be suitable for all investors. Scotiabank recommends that investors independently evaluate any issuer and security discussed in this report, and consult with any advisors they deem necessary prior to making any investment.
This report and all information, opinions and conclusions contained in it are protected by copyright. This information may not be reproduced without the prior express written consent of Scotiabank.
™ Trademark of The Bank of Nova Scotia. Used under license, where applicable.
Scotiabank, together with “Global Banking and Markets”, is a marketing name for the global corporate and investment banking and capital markets businesses of The Bank of Nova Scotia and certain of its affiliates in the countries where they operate, including; Scotiabank Europe plc; Scotiabank (Ireland) Designated Activity Company; Scotiabank Inverlat S.A., Institución de Banca Múltiple, Grupo Financiero Scotiabank Inverlat, Scotia Inverlat Casa de Bolsa, S.A. de C.V., Grupo Financiero Scotiabank Inverlat, Scotia Inverlat Derivados S.A. de C.V. – all members of the Scotiabank group and authorized users of the Scotiabank mark. The Bank of Nova Scotia is incorporated in Canada with limited liability and is authorised and regulated by the Office of the Superintendent of Financial Institutions Canada. The Bank of Nova Scotia is authorized by the UK Prudential Regulation Authority and is subject to regulation by the UK Financial Conduct Authority and limited regulation by the UK Prudential Regulation Authority. Details about the extent of The Bank of Nova Scotia's regulation by the UK Prudential Regulation Authority are available from us on request. Scotiabank Europe plc is authorized by the UK Prudential Regulation Authority and regulated by the UK Financial Conduct Authority and the UK Prudential Regulation Authority.
Scotiabank Inverlat, S.A., Scotia Inverlat Casa de Bolsa, S.A. de C.V, Grupo Financiero Scotiabank Inverlat, and Scotia Inverlat Derivados, S.A. de C.V., are each authorized and regulated by the Mexican financial authorities.
Not all products and services are offered in all jurisdictions. Services described are available in jurisdictions where permitted by law.