- Mexico: Tariff Risks; Remittances showed mixed data
- Colombia: Exports rebound in early 2025 despite weak mining products dynamics; In 2024, the current account deficit stood at its narrowest level in eighteen years, while the financing quality remains a concern
MEXICO: TARIFF RISKS
The day arrived and, surprisingly, there was no agreement to postpone for another 30 days or eliminate the imposition of 25% US tariffs on imports from Mexico and Canada. Upon their announcement, the first to react was the Mexican peso, which went from levels of 20.68 at Monday’s close to a maximum of 20.9982 pesos per dollar at 7:48 a.m. on Tuesday. For its part, Canada has already announced its response, which includes the imposition of 25% tariffs on around $100 billion of imports of US products, as they consider that they will not let this unjustified decision go unanswered. Canada’s imposition is expected in two stages: the first will focus on products such as alcohol, clothing, and household appliances for around $20 billion. Meanwhile, the second stage, which would begin in about three weeks, would target other products totaling around $90 billion. In this regard, President Sheinbaum mentioned that she plans to announce tariff and non-tariff measures as retaliation against the United States at a rally on Sunday in Mexico City. Regarding this, Sheinbaum mentioned that “there is no motive, reason, or justification that supports this decision that will affect our peoples and nations,” and that they will always seek a negotiated solution within a framework of respect. Additionally, she mentioned that she will likely have a call with Trump on Thursday.
Furthermore, measures taken by the Mexican government to avoid the imposition of tariffs include reinforcing border security by deploying 10,000 National Guard members to the northern border to curb the flow of migrants to the United States. Operations against drug cartels have also been intensified, collaborating with the CIA to locate fentanyl laboratories and handing over 29 criminal leaders to US authorities. Additionally, to strengthen its position as a strategic ally, Mexico has imposed tariffs on Chinese products such as manufactured goods, textiles, and electronic products.
Regarding the effect of tariffs on Mexico, it is difficult to measure the impact, as it would have to be addressed product by product, hence price elasticity of demand would need to be measured. However, one of the sectors with the greatest exposure to the US market and that could face the most negative effects is the automotive sector. Mexican auto parts and vehicles represented 35.4% of total US imports of these goods, at $136.6 billion. Here, it is worth mentioning that this industry has become highly integrated in the region, so the imposition of tariffs could significantly affect all three countries. For example, between 67% and 75% of the production of cars and light vehicles in Mexico by Volkswagen and Mazda are sent to the United States, while 53% of Nissan’s light vehicles are sent, and between 37% and 39% of those produced by General Motors, Stellantis, Toyota, and Honda. As a result of the imposition of tariffs, the selling price of these cars would increase by between $5,900 and $7,300 if producers pass the full tax on to consumers, or it could generate a reduction in profit of between $3,500 and $10,000 per car. This would impact both producers and consumers, depending on the price elasticity of demand. However, whatever the combination in the transfer of the tariff to prices, there will surely be a negative impact (tables 1 and 2).
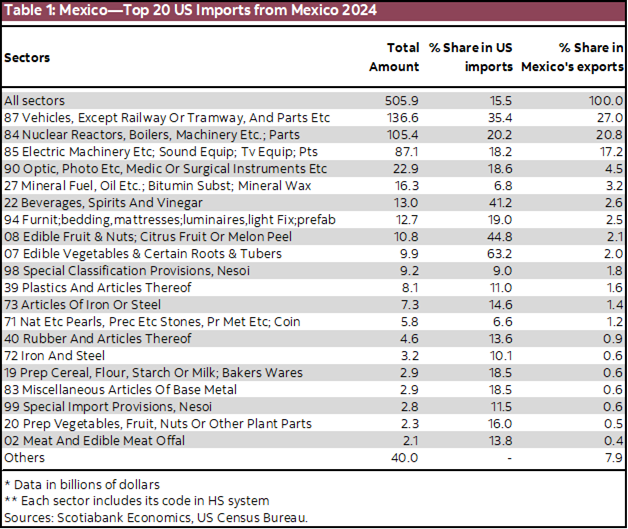
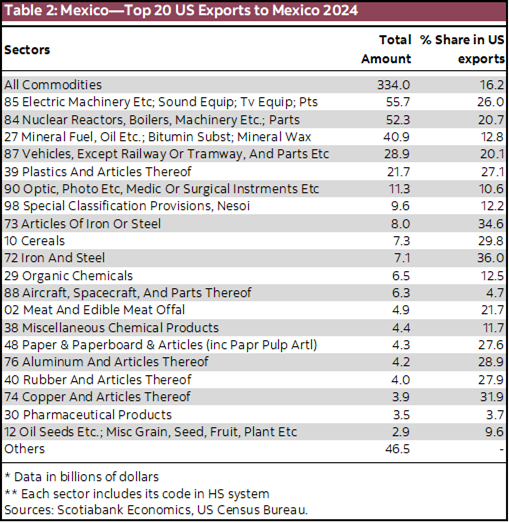
Another affected sector will be heavy machinery, nuclear reactors, and boilers, where Mexican goods, at around $105.4bn, represent 20% of global US imports of these. Meanwhile, household appliances and electrical equipment that are the third most relatively important US imports from Mexico, with a share of 18.2% of imports, would also be negatively affected as, on paper, a price increase would negatively impact the demand for these products, so the tax would have to be absorbed by the producer, and they would have to analyze if this is profitable.
Additionally, we have agricultural products, which depending on the item have a market share between 13.8% and 63.2%, representing around $25 billion. This sector, in particular, would have to be analyzed product by product, as much will depend, as in the previous cases, on the price elasticity of demand.
Finally, despite the fact that retaliatory measures have not been formally announced, the sectors that could theoretically be most affected could be those related to durable goods, such as household appliances and electrical devices, as well as cars and auto parts.
—Rodolfo Mitchell & Brian Pérez
REMITTANCES SHOWED MIXED DATA
In January, remittances recorded $4.660 bn dollars, down from $5.223 bn. On an annual comparison, they showed an increase of 1.9% (-5.0% previously), with an average remittance of $385 dollars. On a monthly comparison, they decreased by -10.8% m/m (-3.9% previously). Over the past 12 months, they totaled $64.833 bn dollars (an increase of 2.2% y/y). Additionally, there were 12.1 million transactions, representing an annual increase of 2.9% (chart 1).
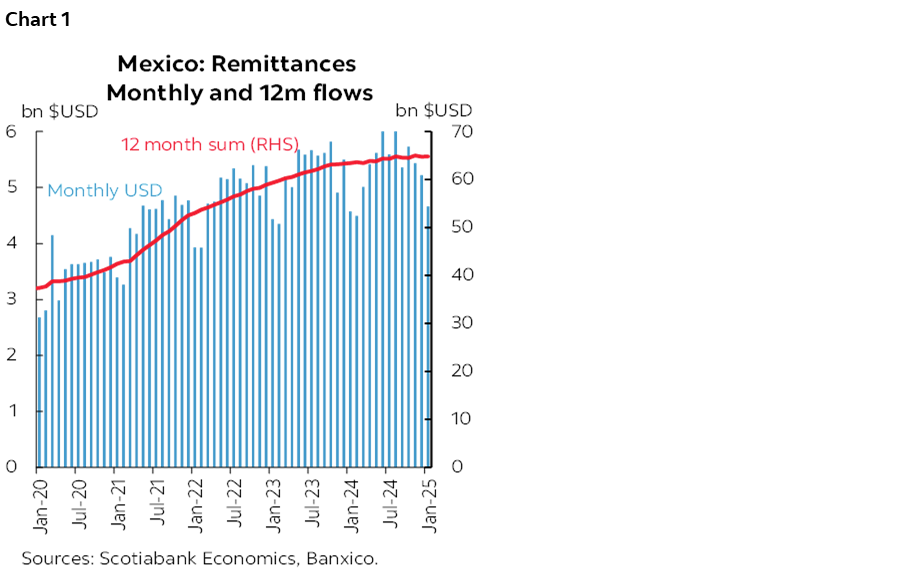
Although an annual rebound was observed this month, the monthly data indicates a lower flow of remittances at the start of the year. The twelve month sum has already been mitigated, and we expect this trend to continue. This behaviour is likely due, in part, to new deportation policies for migrants, which have caused them to reduce remittances to avoid being captured and deported.
As the global economy continues to face challenges, remittances remain a crucial pillar for many Mexican families, especially given the current exchange rate levels and the lower job creation in Mexico.
—Rodolfo Mitchell, Brian Pérez & Miguel Saldaña
COLOMBIA: EXPORTS REBOUND IN EARLY 2025 DESPITE WEAK MINING PRODUCTS DYNAMICS
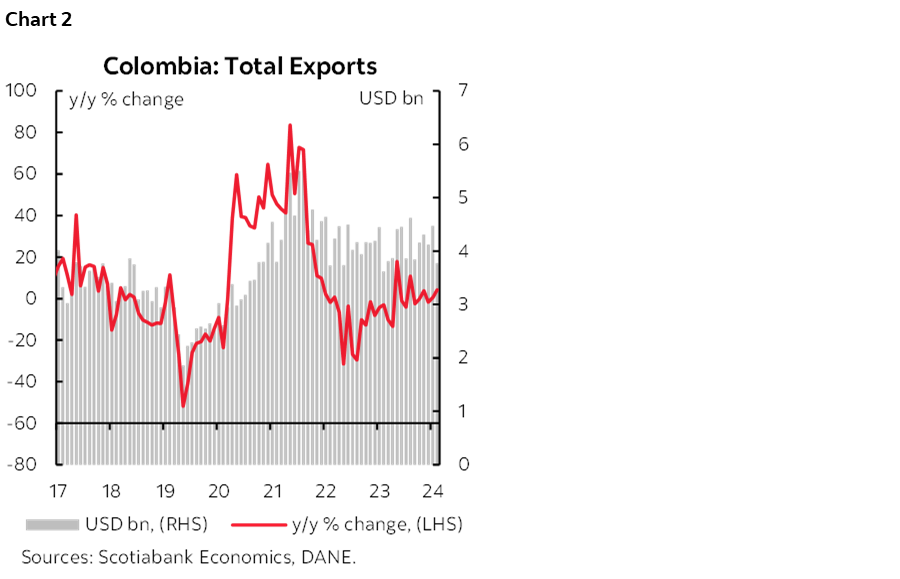
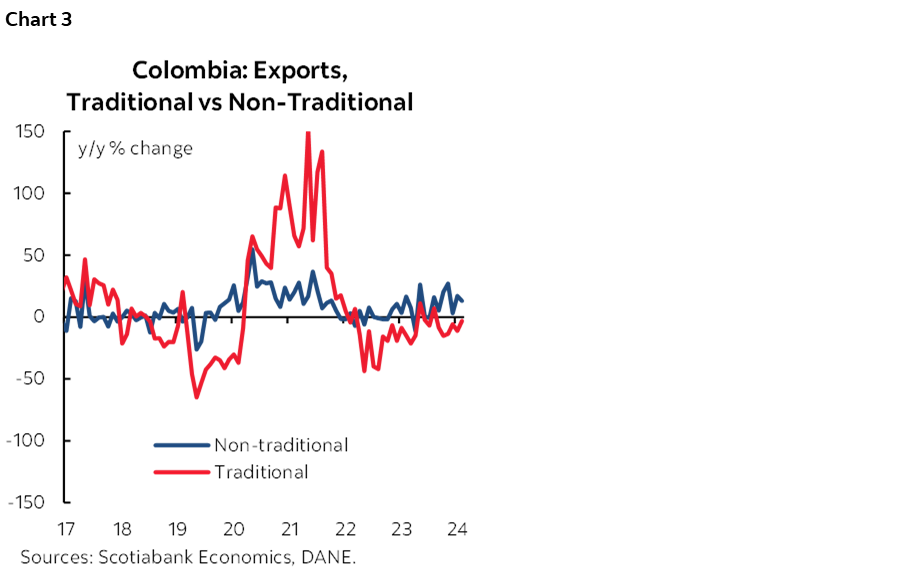
DANE published export data on Tuesday, March 4th. Monthly exports in January stood at US $3.77 billion FOB, an increase of 4.3% compared to January 2024 (chart 2). Compared to last month, total exports registered a decrease of -15.6%. In general, non-traditional exports continue to show a positive trend, while traditional exports decreased in annual terms due to a lower dynamic in coal exports.
The increase in exports was mainly explained by the agricultural and food and beverage group. Exports of agricultural and food products amounted to US $1.14 billion FOB, representing an increase of 42.5% y/y and a contribution of 9.4 ppts to the total variation in exports. However, this increase includes the positive performance of coffee exports, which registered an increase of 108.5% y/y and represented 47% of the total of the subgroup. Excluding coffee, exports of agricultural products increased 12.08% y/y.
As for the other export groups, a weak performance is evident. Fuel exports, which represent 42% of the total exported, registered a fall of -14.5% y/y, subtracting -7.3 ppts from the total variation, being the group with the worst performance. For its part, the manufacturing group represented 19% of total exports, registering a growth of 1.8% y/y and a contribution of 0.4 ppts.
- In January, traditional exports stood at US $1.91 billion FOB, registering a fall of 2.98% y/y. As mentioned in previous reports, international prices have influenced lower exports of coal and oil, however, in January the negative dynamic in annual terms was concentrated in coal exports with a fall of -49.48% y/y, while ferronickel exports fell -11.7% y/y. On the other hand, oil exports reversed the negative trend recorded in the last 6 months, with a 2.38% y/y increase in January 2025. Meanwhile, coffee exports grew 108.5% y/y, being the highest growth since June 2022 with a total of US $462 million FOB.
- Non-traditional exports stood at US $1.86 billion FOB, registering an increase of 13% y/y. Non-traditional exports have maintained a positive trend in the last 8 months, driven by a good dynamic in food exports (excluding coffee), which in January increased 12.08% y/y. Foods such as meat, sugars, and oils stand out. Regarding manufacturing, exports increased 1.8% y/y, a smaller increase than that registered in December (16.5% y/y), with plastic products, metals, and chemical products contributing the most. On the other hand, non-monetary gold exports remain positive with an increase of 25.8% y/y, reaching US $329.4 million FOB (chart 3).
—Daniela Silva
IN 2024, THE CURRENT ACCOUNT DEFICIT STOOD AT ITS NARROWEST LEVEL IN EIGHTEEN YEARS WHILE THE FINANCING QUALITY REMAINS A CONCERN
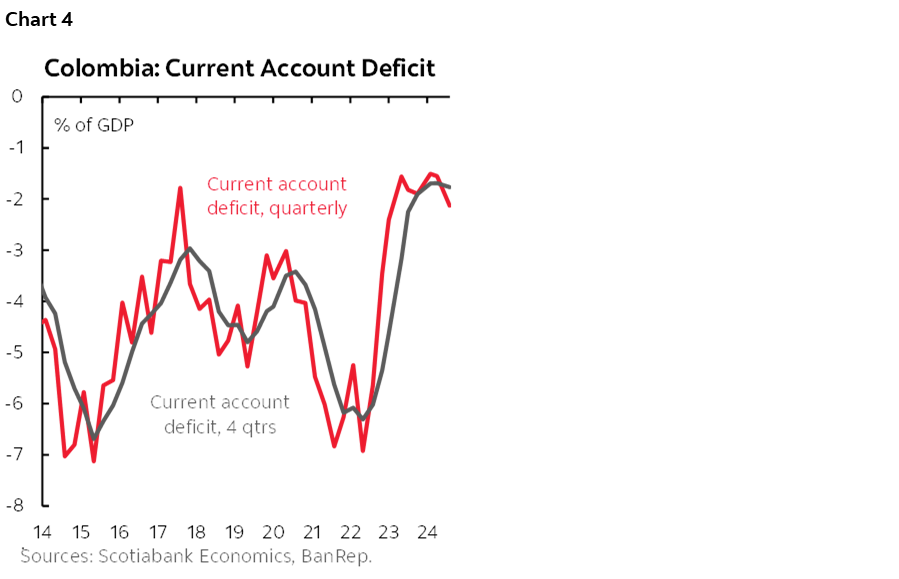
On Monday, March 3rd, the central bank (BanRep) released the Q4-2024 Balance of Payments (BoP). The current account deficit stood at USD $2.24 bn, equivalent to 2.1% of GDP in Q4-2024, taking the annual figure for 2024 to a deficit of USD $7.41 bn, equivalent to 1.8% of GDP (chart 4). In nominal terms, it was the narrowest deficit since 2009, while in terms of GDP, it is the lowest since 2006 (chart 4 again). The result is a combination of moderate economic growth reflected in a relatively low trade deficit and lower income account net outflows due to lower earnings from FDI and still supportive inflows of remittances.
In terms of financing, net FDI inflows improved in Q4-2024 versus the previous quarter. For all of 2024, FDI was concentrated in the financial services sector (31% of total inflows), but concentrated in capitalization operations, which, in our opinion, certainly does not suggest an expansion in installed capacity. In the case of portfolio investments, we identify a better appetite for foreign currency debt than for local currency debt, while in terms of credit operation, again, the banking system led the inflows.
The previous picture confirms that the balance of payments structure in Colombia is one of the most significant indicators of the economy’s health, and in the case of 2024, the BoP reflects that there is room to improve. In 2024, Colombia started a moderate rebound; however, it is not being reflected in a clear signal on investment. On the contrary, the financing flows in the BoP demonstrate that some inflows were related to the still-moderate performance of the banking system.
All in all, we maintain the same conclusion that we have had in previous reports: Colombia passed the worst in terms of deceleration. However, the recovery is still struggling to gain traction. There are some green shoots, especially in the Q4-2024 import structure, in which imports of capital goods started to rebound. In 2025, we project the current account deficit widening to 2.3% of GDP (~USD $13.4 bn); we expect better traction on imports, a more moderate expansion on remittances, and, in the case of financing, a better composition of the FDI, and moderate capital inflows.
In the case of the FX, the BoP structure suggests that there is no strong fundamental behaviour to anticipate a trend. The FX depreciation observed at the end of 2024 responded to the global uncertainty for a potential trade war, and the YTD-2025 appreciation is responding to financial flows associated with carry trade due to the expectation of a cautious BanRep, coupled with some seasonal inflows due to corporate tax payment. In the medium term, our expectation of widening the current account deficit should support a more depreciated level of around 4.350 pesos by the end of the year.
Regarding monetary policy, the BoP is a signal that the economy is operating in a negative output gap and probably with fragile sources of financing; in the balance of risk for the BanRep Board, it will mean that they should continue to be cautious to avoid volatility in the financing sources that impact the FX and in turn impact inflation. Our official call is for a 25bps cut in March. However, we think rate stability will be on the table if Friday’s inflation accelerates again.
Further details about the balance of payments numbers:
Current account:
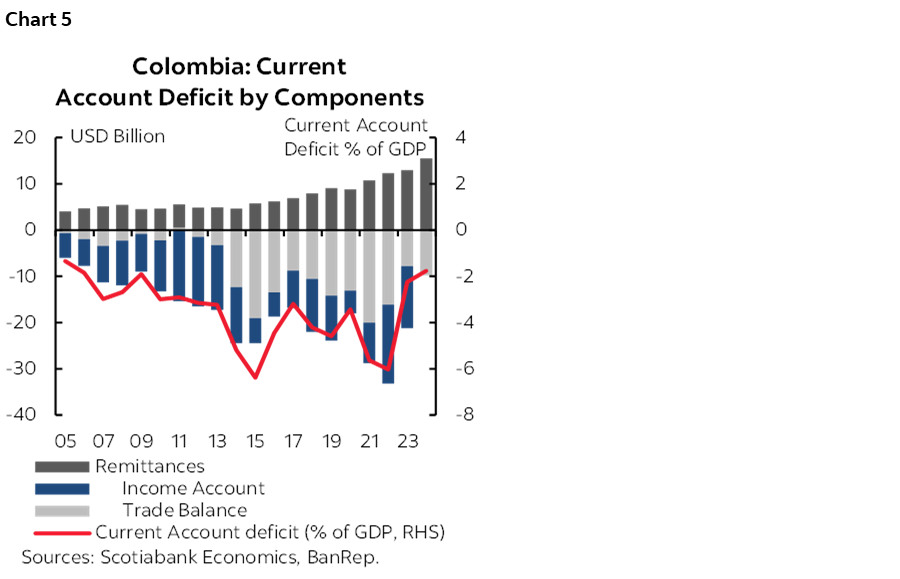
In Q4-2024, the current account deficit stood at USD $2.24 bn (2.1% of GDP, chart 5), higher than the previous quarter’s deficit (~USD $1.65 bn). During the last quarter of 2024, the trade deficit widened, income accounts were lower, and transfers continued increasing. The current account deficit interrupted a reduction trend that started in Q3-2022. In all of 2024, the current account deficit stood at USD $7.41 bn (1.8% of GDP); transfer inflows supported the lower deficit coupled with less trade deficit and net income account outflows.
- Trade balance of goods: In 2024, the trade deficit in goods was USD $9.16 bn, increasing 25.6% amid a 2.9% expansion of imports, which stood at USD $78.63 bn, and relative stability in exports, at USD $68.87 bn. In the case of imports, in Q4-2024, we observed better purchases of capital goods(+4.8% y/y) and transport equipment (+26.3% y/y), which is a good signal of the recovery in private investment.
- In the case of exports, there were a mix of signals. On one side, the reduction in commodity prices, especially coal, and lower exported volumes of oil (3.7%) were offset by better exports of bananas and coffee, which faced a good context of exported volumes and prices.
- Trade balance of services: In 2024, the deficit was USD $606 mn. The most dynamic part of exports is still travel-related services, which is compatible with the increase in tourism flows, which reports an increase of 12% in passenger arrivals.
- Income account: The income posted a deficit of USD $13.15 bn in 2024, which is slightly lower than in 2023, showing a new contraction of earnings from FDI. Regarding the nature of payment, total outflows were USD $23.06 bn, 42.6% were related to FDI payments, 31% were interest payments to foreign credits, and 26.3% were dividends. Notably, lower FDI earnings are concentrated in the oil and mining sector, while earnings improved in the financial sector.
- Transfers: Inflows in 2024 were USD $15.51 bn, expanding by 20% year-over-year. Remittances stood at USD $11.85 bn, increasing by 17.4% and representing 2.8% of GDP and 12.4% of current inflows of the BoP. Another curious fact is that remittances are equivalent to 78% of total oil exports. In 2025, we expect a more moderate expansion in remittances due to increased immigration restrictions in the US.
Financing side:
The financial account, including international reserves, registered net inflows of USD $5.58 bn (1.3% of GDP). It is worth noting that despite the low current account deficit, the economy is struggling to find traditional sources of financing, which contributes to the expectation of more pressure on the depreciation of the FX than appreciation (chart 6).
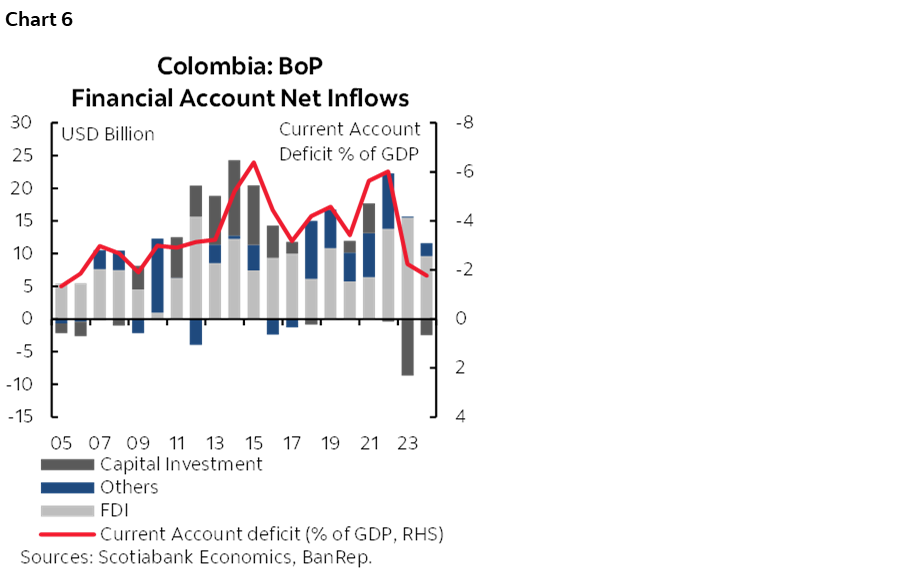
- Foreign Direct Investment: FDI gross inflows stood at USD $14.23 bn (3.4% of GDP) but fell 15.2% y/y. Main destinations were financial services (31%), taking the oil and mining sector to the second place with a share in total inflows of 25%, in third place stood manufacturing (14%), in the fourth was commerce and hotels (13%), while the remainder accounted for 17%. We call attention to the composition of the FDI as most of it was due to capitalization operations in the financial system, which does not necessarily mean an increase in capacity. Instead, it could mean a challenging context in terms of domestic credit performance.
- Portfolio investments: Total inflows stood at USD $2.89 bn, which was very concentrated in foreign currency debt, while we saw outflows in local currency debt. Outflows were USD $5.73 bn, leaving the capital account not contributing to financing for the second year in a row.
- Other credits. Again, a curious fact is that credits have been concentrated in the private sector, especially banks. Disbursements for the private sector increased from USD $2.5 bn one year ago to USD $4.52 bn in 2024. In the case of the public sector, credits stood at USD $2.18 bn
- Reserves: The central bank increased its reserves by USD $3.59 bn; USD $2.33 bn came from reinvested earnings, and USD $1.48 bn were purchases in the option program 2024. In 2025, BanRep has not anticipated a transaction to increase its IR for now.
—Jackeline Piraján
DISCLAIMER
This report has been prepared by Scotiabank Economics as a resource for the clients of Scotiabank. Opinions, estimates and projections contained herein are our own as of the date hereof and are subject to change without notice. The information and opinions contained herein have been compiled or arrived at from sources believed reliable but no representation or warranty, express or implied, is made as to their accuracy or completeness. Neither Scotiabank nor any of its officers, directors, partners, employees or affiliates accepts any liability whatsoever for any direct or consequential loss arising from any use of this report or its contents.
These reports are provided to you for informational purposes only. This report is not, and is not constructed as, an offer to sell or solicitation of any offer to buy any financial instrument, nor shall this report be construed as an opinion as to whether you should enter into any swap or trading strategy involving a swap or any other transaction. The information contained in this report is not intended to be, and does not constitute, a recommendation of a swap or trading strategy involving a swap within the meaning of U.S. Commodity Futures Trading Commission Regulation 23.434 and Appendix A thereto. This material is not intended to be individually tailored to your needs or characteristics and should not be viewed as a “call to action” or suggestion that you enter into a swap or trading strategy involving a swap or any other transaction. Scotiabank may engage in transactions in a manner inconsistent with the views discussed this report and may have positions, or be in the process of acquiring or disposing of positions, referred to in this report.
Scotiabank, its affiliates and any of their respective officers, directors and employees may from time to time take positions in currencies, act as managers, co-managers or underwriters of a public offering or act as principals or agents, deal in, own or act as market makers or advisors, brokers or commercial and/or investment bankers in relation to securities or related derivatives. As a result of these actions, Scotiabank may receive remuneration. All Scotiabank products and services are subject to the terms of applicable agreements and local regulations. Officers, directors and employees of Scotiabank and its affiliates may serve as directors of corporations.
Any securities discussed in this report may not be suitable for all investors. Scotiabank recommends that investors independently evaluate any issuer and security discussed in this report, and consult with any advisors they deem necessary prior to making any investment.
This report and all information, opinions and conclusions contained in it are protected by copyright. This information may not be reproduced without the prior express written consent of Scotiabank.
™ Trademark of The Bank of Nova Scotia. Used under license, where applicable.
Scotiabank, together with “Global Banking and Markets”, is a marketing name for the global corporate and investment banking and capital markets businesses of The Bank of Nova Scotia and certain of its affiliates in the countries where they operate, including; Scotiabank Europe plc; Scotiabank (Ireland) Designated Activity Company; Scotiabank Inverlat S.A., Institución de Banca Múltiple, Grupo Financiero Scotiabank Inverlat, Scotia Inverlat Casa de Bolsa, S.A. de C.V., Grupo Financiero Scotiabank Inverlat, Scotia Inverlat Derivados S.A. de C.V. – all members of the Scotiabank group and authorized users of the Scotiabank mark. The Bank of Nova Scotia is incorporated in Canada with limited liability and is authorised and regulated by the Office of the Superintendent of Financial Institutions Canada. The Bank of Nova Scotia is authorized by the UK Prudential Regulation Authority and is subject to regulation by the UK Financial Conduct Authority and limited regulation by the UK Prudential Regulation Authority. Details about the extent of The Bank of Nova Scotia's regulation by the UK Prudential Regulation Authority are available from us on request. Scotiabank Europe plc is authorized by the UK Prudential Regulation Authority and regulated by the UK Financial Conduct Authority and the UK Prudential Regulation Authority.
Scotiabank Inverlat, S.A., Scotia Inverlat Casa de Bolsa, S.A. de C.V, Grupo Financiero Scotiabank Inverlat, and Scotia Inverlat Derivados, S.A. de C.V., are each authorized and regulated by the Mexican financial authorities.
Not all products and services are offered in all jurisdictions. Services described are available in jurisdictions where permitted by law.