- Mexico: Inflation in the first half of June rose slightly less than expected, to 4.51% annually, supported by a slowdown in the non-core component
- Colombia: Citi survey shows slight growth and inflation forecast changes alongside a June rate hold
- Peru: Auto market outlook brightens for 2025
MEXICO: INFLATION IN THE FIRST HALF OF JUNE ROSE SLIGHTLY LESS THAN EXPECTED, TO 4.51% ANNUALLY, SUPPORTED BY A SLOWDOWN IN THE NON-CORE COMPONENT
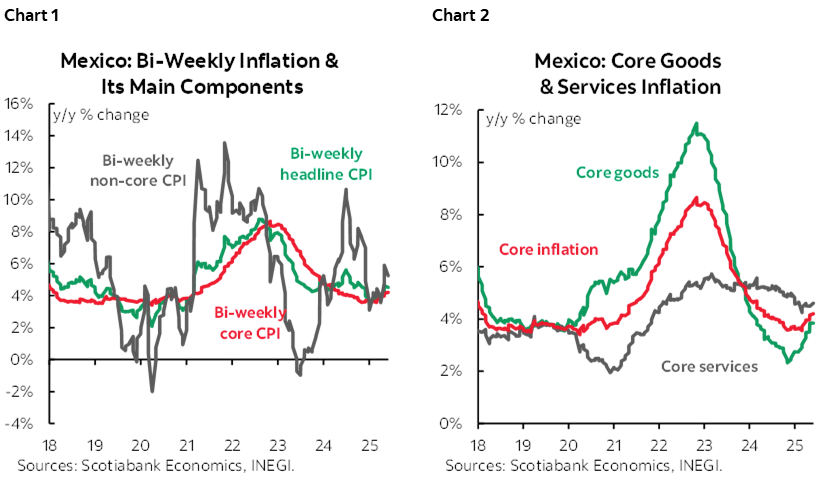
Inflation in the first half of June rose slightly less than expected, reaching 4.51% y/y, down from 4.62% in the second half of May (vs. 4.53% Citi Survey consensus). Core inflation increased to 4.20% from the previous 4.15% (in line with consensus). Within core components, goods remained at 3.84%, while services rose to 4.61% (from 4.50%). Non-core inflation stood at 5.25% (down from 5.91%), with agricultural products at 6.57% (from 7.74%), led by a sharp rise in livestock prices (11.86% y/y), while energy and government-regulated prices were at 3.92%.
On a biweekly sequential basis, headline inflation rose 0.10% (vs. 0.19% prior, 0.12% consensus), core inflation increased 0.22% (vs. 0.15% prior, 0.17% consensus), and non-core inflation fell -0.29% (vs. 0.35% prior). The items with the highest incidence and price increases included: owner-occupied housing, air transport, small eateries, beef and pork, and restaurants. This reading adds pressure on Banxico to slow the pace and magnitude of its rate-cutting cycle in the second half of the year.
—Rodolfo Mitchell, Brian Pérez & Miguel Saldaña
COLOMBIA: CITI SURVEY SHOWS SLIGHT GROWTH AND INFLATION FORECAST CHANGES ALONGSIDE A JUNE RATE HOLD
Highlights
- Economic growth projections fell slightly. For 2025, analysts estimate economic growth of 2.56%, a slight decline compared to the May survey (5 bps lower than the previous survey). Meanwhile, for 2026, economic growth is expected to reach 2.88% (5 bps lower than the previous survey). The economy began 2025 in positive territory with growth above expectations. GDP in the first quarter registered an increase of 2.7%, with more even growth across all sectors, suggesting continued economic recovery.
- Inflation expectations increased slightly. Inflation fell below expectations in May, reaching 5.05% y/y, due to less pressure from indexation effects, falling energy prices, and falling tourism service prices, which supported lower monthly inflation. For June, the average respondent expects inflation to be 0.19% m/m and 4.91% y/y. By the end of 2025, expectations increased by 3 basis points compared to the previous survey, reaching 4.80% y/y. For 2026, expectations stood at 3.75%, an increase of 3 bps compared to the previous survey. Scotiabank Colpatria estimates June inflation at 0.24% m/m and 4.97% y/y, while for the end of 2025 and 2026, it is projected to reach 5.32% y/y and 4.03% y/y, respectively.
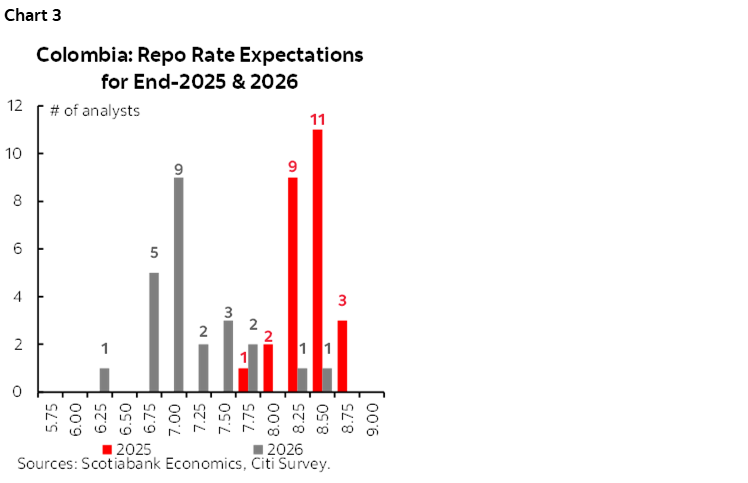
- Expectations for the next monetary policy meeting lean toward rate stability. According to the survey, 77% of respondents expect BanRep to keep the interest rate stable at the current 9.25%. Meanwhile, 13% of respondents expect a 25 bps cut to 9%, including the Scotiabank Colpatria team. Expectations for the end of 2025 are concentrated at 8.50% (chart 3), with a range between 7.75% and 8.75%. For 2026, the median is 7.0%, ranging between 6.25% and 8.50%. Scotiabank Colpatria expects a rate of 8.75% by the end of 2025, supported by a higher inflation path in the second half of 2025, while for 2026, the interest rate is expected to reach 7.75%.
- Finally, the consensus of economists expects the exchange rate to be 4.147 pesos in June. By the end of 2025, the average forecast is for the exchange rate to be 4,245 pesos and 4,179 pesos in 2026. Scotiabank Colpatria estimates an exchange rate of 4,367 pesos for 2025 and 4,364 for 2026.
—Daniela Silva
PERU: AUTO MARKET OUTLOOK BRIGHTENS FOR 2025
New vehicle sales have consistently outperformed our expectations over the past three months, maintaining strong double-digit growth (chart 4). May was no exception, continuing the uptrend. In May, 16,337 vehicles were sold in Peru, marking a 21% y/y. Cumulatively, from January to May, sales reached 83,348 units—15.6% higher than in the same period last year—according to data from the Peruvian Automotive Association (Asociación Automotriz del Perú, AAP).

This robust performance was underpinned by a sustained recovery in household income, driven by the gradual strengthening of formal private employment, which expanded by 7.1% between January and April, as reported by the Central Reserve Bank of Peru (BCRP). This labour market improvement reflects the positive momentum in private investment, which grew 8.8% in the first quarter of 2025. The increase in purchasing power was further supported by a continued decline in inflation, which stood at 1.7% at the end of May. Additionally, a more favourable sol-to-dollar exchange rate—compared to previous years—contributed to lower vehicle prices in local currency terms. Improved financing conditions, including lower interest rates on vehicle loans, also played a key role. Moreover, the recovery of sectors with high demand for heavy vehicles—such as mining, construction, and manufacturing—added further momentum to overall vehicle sales. From January to May, vehicle sales in Peru’s provinces expanded by 21%, significantly outpacing the 13% growth observed in Lima, according to our estimates. This divergence is primarily attributable to the stronger demand for heavy vehicles in non-metropolitan regions.
2025 OUTLOOK
Considering the strong performance observed through May, we have revised our forecast for new vehicle sales growth in 2025 upward to 8%, significantly above the 3.2% growth projected for the broader retail sector. This adjustment reflects a confluence of favourable macroeconomic and market-specific factors. Key among these is the gradual recovery of formal employment, which has bolstered household income and consumer confidence. Additionally, real purchasing power has improved amid easing inflationary pressures, with headline inflation falling to 1.7% by the end of May. Other supportive elements include, a more favourable sol-to-dollar exchange rate, which has reduced vehicle prices in local currency terms. Greater availability and diversification of vehicle offerings, particularly from Chinese manufacturers, whose competitive pricing has expanded access to new segments of the market. Also, improved credit conditions, with lower interest rates on vehicle loans enhancing affordability and stimulating demand. Together, these dynamics suggest a more robust outlook for the automotive sector relative to other components of retail trade.
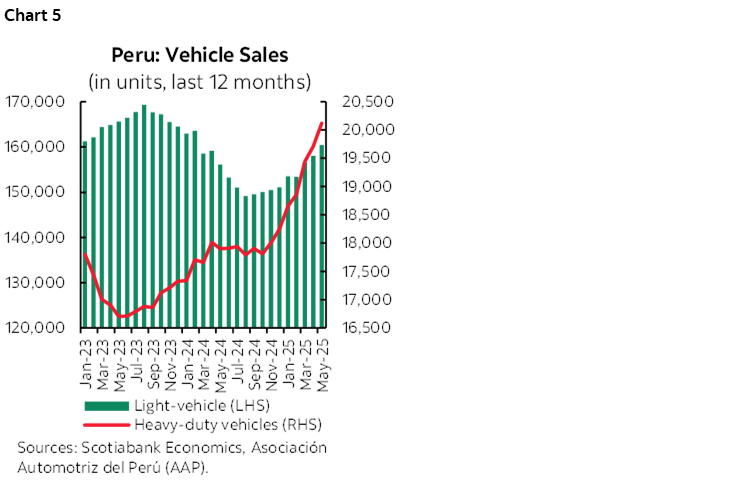
Additionally, a base effect is at play, as new vehicle sales posted negative year-over-year growth between May and August 2024. However, looking ahead to the final months of 2025, we anticipate a moderation in sales momentum due to the onset of the 2026 electoral campaign. Historically, periods of political uncertainty tend to prompt consumers to defer discretionary spending on durable goods—such as light vehicles—as well as capital investments in heavy vehicles (chart 5). This cautious behavior may be further reinforced by external risks, particularly the potential for rising fuel prices stemming from escalating geopolitical tensions in the Middle East, a key oil-producing region. Higher fuel costs would increase the total cost of vehicle ownership, potentially delaying purchase decisions and weighing on overall demand.
NEW VEHICLE SALES THROUGH MAY 2025
Cumulative new vehicle sales through May 2025 were significantly boosted by a strong Q125, during which 50,737 units were sold, the highest quarterly volume since Q123 and a 15.4% increase compared to Q1 2024. This performance was largely driven by exceptionally high sales in January (+18.4% y/y), partly reflecting the spillover of unrecorded transactions from December. Additionally, March sales surged by 29.6% y/y, particularly in the heavy vehicle segment, due to a favourable calendar effect—Easter holidays fell in April this year, extending the March sales window. These gains were partially offset by muted February growth (+0.3% y/y), constrained by the shorter sales period, as February 2024 had one additional day due to the leap year.
In addition, vehicle sales in both April and May 2025 delivered strong results, reinforcing the sector’s positive momentum. In April, sales grew by 11.8% y/y, despite having two fewer business days due to the Easter holidays. Notably, April recorded the highest sales volume for that month since 2018, outperforming all other April figures in recent years. May’s performance was even more robust, with sales exceeding expectations and registering a 20.6% y/y increase. This double-digit growth was driven by broad-based demand across both light and heavy vehicle segments, reflecting improved consumer sentiment and favourable market conditions.
By segments, between January and May, the heavy-duty vehicle segment demonstrated the strongest momentum, with sales increasing by 20% y/y, totaling 9,274 units, the highest cumulative figure for this period since 2013. This marks the ninth consecutive month of growth y/y for the segment. Within heavy-duty vehicles, bus sales surged by 46%, driven by fleet renewals in private transportation and tourism. This was followed by tractor-trailers (+24%) and trucks (+22%), reflecting robust demand from key sectors such as mining, construction, and manufacturing. From a regional perspective, vehicle sales in the provinces grew by 19%, according to our estimates, outpacing the 12% growth recorded in Lima during the same period.
Finally, between January and May 2025, light vehicle sales grew by 14.5%, reaching a total of 74,074 units sold. This expansion was primarily driven by increased demand for pickup trucks (+26%), largely associated with mining operations; SUVs (+21%), supported by a broader range of available models and consumer preference for larger, more versatile vehicles; and vans with up to 16 passengers (+9%), used predominantly for personnel transport. On the other hand, city car sales fell 8%, reflecting a shift in consumer preferences toward larger and more multifunctional vehicles—like SUVs. From a regional perspective, sales in the provinces surged by 42%, significantly outpacing the 19% growth recorded in Lima during the same period, according to our estimates based on data from the Peruvian Automotive Association (AAP). This divergence underscores the growing importance of regional markets in driving national automotive demand.
—Carlos Asmat
DISCLAIMER
This report has been prepared by Scotiabank Economics as a resource for the clients of Scotiabank. Opinions, estimates and projections contained herein are our own as of the date hereof and are subject to change without notice. The information and opinions contained herein have been compiled or arrived at from sources believed reliable but no representation or warranty, express or implied, is made as to their accuracy or completeness. Neither Scotiabank nor any of its officers, directors, partners, employees or affiliates accepts any liability whatsoever for any direct or consequential loss arising from any use of this report or its contents.
These reports are provided to you for informational purposes only. This report is not, and is not constructed as, an offer to sell or solicitation of any offer to buy any financial instrument, nor shall this report be construed as an opinion as to whether you should enter into any swap or trading strategy involving a swap or any other transaction. The information contained in this report is not intended to be, and does not constitute, a recommendation of a swap or trading strategy involving a swap within the meaning of U.S. Commodity Futures Trading Commission Regulation 23.434 and Appendix A thereto. This material is not intended to be individually tailored to your needs or characteristics and should not be viewed as a “call to action” or suggestion that you enter into a swap or trading strategy involving a swap or any other transaction. Scotiabank may engage in transactions in a manner inconsistent with the views discussed this report and may have positions, or be in the process of acquiring or disposing of positions, referred to in this report.
Scotiabank, its affiliates and any of their respective officers, directors and employees may from time to time take positions in currencies, act as managers, co-managers or underwriters of a public offering or act as principals or agents, deal in, own or act as market makers or advisors, brokers or commercial and/or investment bankers in relation to securities or related derivatives. As a result of these actions, Scotiabank may receive remuneration. All Scotiabank products and services are subject to the terms of applicable agreements and local regulations. Officers, directors and employees of Scotiabank and its affiliates may serve as directors of corporations.
Any securities discussed in this report may not be suitable for all investors. Scotiabank recommends that investors independently evaluate any issuer and security discussed in this report, and consult with any advisors they deem necessary prior to making any investment.
This report and all information, opinions and conclusions contained in it are protected by copyright. This information may not be reproduced without the prior express written consent of Scotiabank.
™ Trademark of The Bank of Nova Scotia. Used under license, where applicable.
Scotiabank, together with “Global Banking and Markets”, is a marketing name for the global corporate and investment banking and capital markets businesses of The Bank of Nova Scotia and certain of its affiliates in the countries where they operate, including; Scotiabank Europe plc; Scotiabank (Ireland) Designated Activity Company; Scotiabank Inverlat S.A., Institución de Banca Múltiple, Grupo Financiero Scotiabank Inverlat, Scotia Inverlat Casa de Bolsa, S.A. de C.V., Grupo Financiero Scotiabank Inverlat, Scotia Inverlat Derivados S.A. de C.V. – all members of the Scotiabank group and authorized users of the Scotiabank mark. The Bank of Nova Scotia is incorporated in Canada with limited liability and is authorised and regulated by the Office of the Superintendent of Financial Institutions Canada. The Bank of Nova Scotia is authorized by the UK Prudential Regulation Authority and is subject to regulation by the UK Financial Conduct Authority and limited regulation by the UK Prudential Regulation Authority. Details about the extent of The Bank of Nova Scotia's regulation by the UK Prudential Regulation Authority are available from us on request. Scotiabank Europe plc is authorized by the UK Prudential Regulation Authority and regulated by the UK Financial Conduct Authority and the UK Prudential Regulation Authority.
Scotiabank Inverlat, S.A., Scotia Inverlat Casa de Bolsa, S.A. de C.V, Grupo Financiero Scotiabank Inverlat, and Scotia Inverlat Derivados, S.A. de C.V., are each authorized and regulated by the Mexican financial authorities.
Not all products and services are offered in all jurisdictions. Services described are available in jurisdictions where permitted by law.