- Colombia: Rising imports reflect improving trade dynamism
On Thursday, January 30th, DANE published import data for November 2024. Imports reached US $5.87 billion CIF, the best level since April 2024. Imports increased by 13.7% compared to the same month in 2023, maintaining the positive trend for the fifth consecutive month. Additionally, imports increased by 2.5% compared to October 2023, which can be associated with the holiday shopping season in December. Imports of food and manufactured products contributed positively with a contribution of 3 percentage points (ppts) and 12 ppts, respectively, while fuel imports partially offset this with -1.5 ppts, explained by a reduction in oil imports (chart 1).
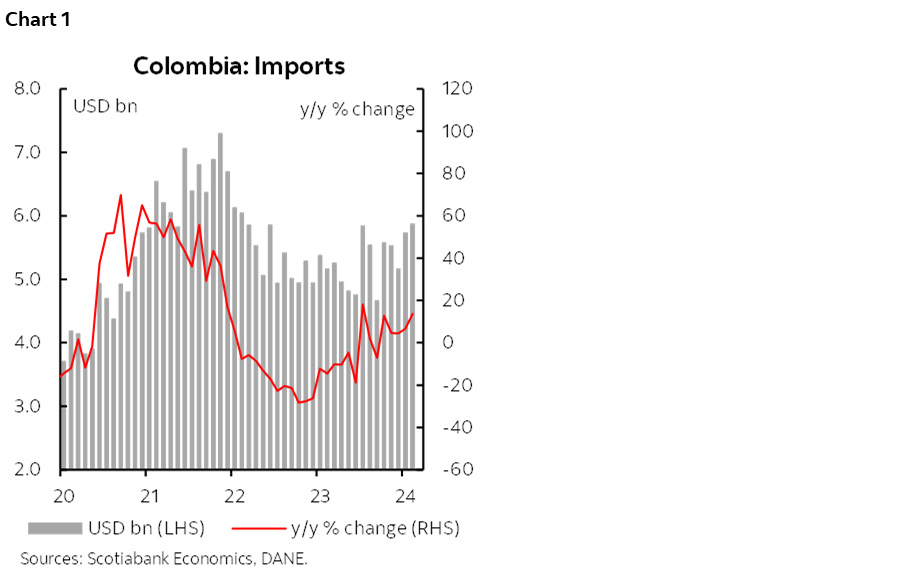
The recovery in imports is related to better performance in commerce activity. In November, economic activity data showed trade growth of 5.8% year-on-year (y/y), a recovery that may be driving greater purchases abroad. Importing of durable goods increased by 30.8% y/y, mainly due to the importing of vehicles (+46.9% y/y) and household products (+49.6% y/y), which indicates greater dynamism in the sector.
Importing of raw materials and capital goods for industry suggests a gradual recovery of the sector in the coming months. The manufacturing sector has been one of the most lagging in the economic recovery; however, imports for the sector have maintained a positive dynamic since July 2024, which may be due to better prospects for the sector, highlighting the importing of raw materials for pharmaceutical and food products, activities that stand out within the sector.
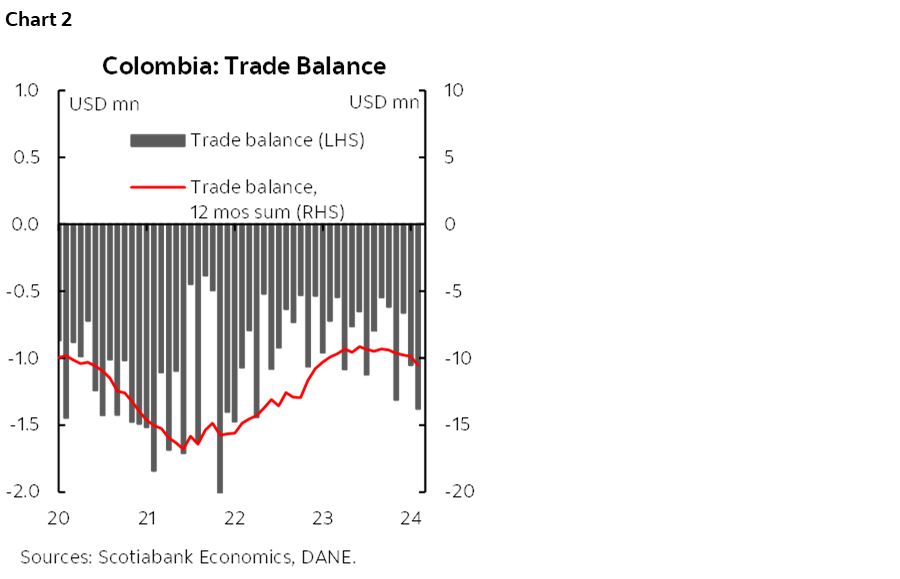
The trade balance stood at US $1.38 billion, widening the deficit by 91.9% compared to November 2023 (US $719.3 million) (chart 2). In November, exports contracted mainly due to the export of traditional products, especially mining products, impacted by the fall in international oil prices.
Key Highlights:
- Consumer imports remain positive. In November, imports of consumer goods grew by 19.6%y/y, contributing 4.8 ppts to total import growth. Imports of non-durable goods grew by 1.6% y/y, driven by food products, beverages, and tobacco, and the textile sector registered a positive variation of 11.8% y/y. Imports of durable goods increased by 30.8% y/y, driven by imports of automobiles and household items.
- Imports of raw materials grew by 10.2% y/y. Imports of intermediate goods and raw materials increased in the industrial sector with a growth of 24.2% y/y, while imports of fuels and the agricultural sector partially offset this with falls of -15% y/y and -7.4% y/y, respectively.
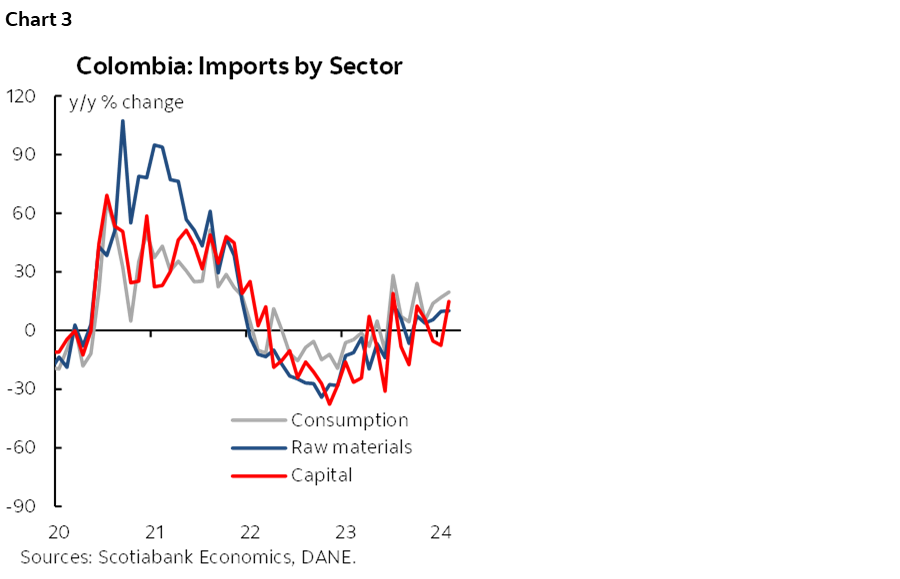
- Imports of capital goods reflect better dynamism in construction and industry. Imports of capital goods increased by 14.8% y/y, and continued with the growth of imports for construction with an increase of 30.6% y/y, while imports of capital goods for agriculture and industry increased by 7.2% y/y and 4.7% y/y, respectively (chart 3).
—Valentina Guio & Daniela Silva
DISCLAIMER
This report has been prepared by Scotiabank Economics as a resource for the clients of Scotiabank. Opinions, estimates and projections contained herein are our own as of the date hereof and are subject to change without notice. The information and opinions contained herein have been compiled or arrived at from sources believed reliable but no representation or warranty, express or implied, is made as to their accuracy or completeness. Neither Scotiabank nor any of its officers, directors, partners, employees or affiliates accepts any liability whatsoever for any direct or consequential loss arising from any use of this report or its contents.
These reports are provided to you for informational purposes only. This report is not, and is not constructed as, an offer to sell or solicitation of any offer to buy any financial instrument, nor shall this report be construed as an opinion as to whether you should enter into any swap or trading strategy involving a swap or any other transaction. The information contained in this report is not intended to be, and does not constitute, a recommendation of a swap or trading strategy involving a swap within the meaning of U.S. Commodity Futures Trading Commission Regulation 23.434 and Appendix A thereto. This material is not intended to be individually tailored to your needs or characteristics and should not be viewed as a “call to action” or suggestion that you enter into a swap or trading strategy involving a swap or any other transaction. Scotiabank may engage in transactions in a manner inconsistent with the views discussed this report and may have positions, or be in the process of acquiring or disposing of positions, referred to in this report.
Scotiabank, its affiliates and any of their respective officers, directors and employees may from time to time take positions in currencies, act as managers, co-managers or underwriters of a public offering or act as principals or agents, deal in, own or act as market makers or advisors, brokers or commercial and/or investment bankers in relation to securities or related derivatives. As a result of these actions, Scotiabank may receive remuneration. All Scotiabank products and services are subject to the terms of applicable agreements and local regulations. Officers, directors and employees of Scotiabank and its affiliates may serve as directors of corporations.
Any securities discussed in this report may not be suitable for all investors. Scotiabank recommends that investors independently evaluate any issuer and security discussed in this report, and consult with any advisors they deem necessary prior to making any investment.
This report and all information, opinions and conclusions contained in it are protected by copyright. This information may not be reproduced without the prior express written consent of Scotiabank.
™ Trademark of The Bank of Nova Scotia. Used under license, where applicable.
Scotiabank, together with “Global Banking and Markets”, is a marketing name for the global corporate and investment banking and capital markets businesses of The Bank of Nova Scotia and certain of its affiliates in the countries where they operate, including; Scotiabank Europe plc; Scotiabank (Ireland) Designated Activity Company; Scotiabank Inverlat S.A., Institución de Banca Múltiple, Grupo Financiero Scotiabank Inverlat, Scotia Inverlat Casa de Bolsa, S.A. de C.V., Grupo Financiero Scotiabank Inverlat, Scotia Inverlat Derivados S.A. de C.V. – all members of the Scotiabank group and authorized users of the Scotiabank mark. The Bank of Nova Scotia is incorporated in Canada with limited liability and is authorised and regulated by the Office of the Superintendent of Financial Institutions Canada. The Bank of Nova Scotia is authorized by the UK Prudential Regulation Authority and is subject to regulation by the UK Financial Conduct Authority and limited regulation by the UK Prudential Regulation Authority. Details about the extent of The Bank of Nova Scotia's regulation by the UK Prudential Regulation Authority are available from us on request. Scotiabank Europe plc is authorized by the UK Prudential Regulation Authority and regulated by the UK Financial Conduct Authority and the UK Prudential Regulation Authority.
Scotiabank Inverlat, S.A., Scotia Inverlat Casa de Bolsa, S.A. de C.V, Grupo Financiero Scotiabank Inverlat, and Scotia Inverlat Derivados, S.A. de C.V., are each authorized and regulated by the Mexican financial authorities.
Not all products and services are offered in all jurisdictions. Services described are available in jurisdictions where permitted by law.