- Colombia: Retail sales below market expectations as industry return to positive trend; Imports in 2024 increased, driving the widening trade deficit
COLOMBIA: RETAIL SALES BELOW MARKET EXPECTATIONS AS INDUSTRY RETURN TO POSITIVE TREND
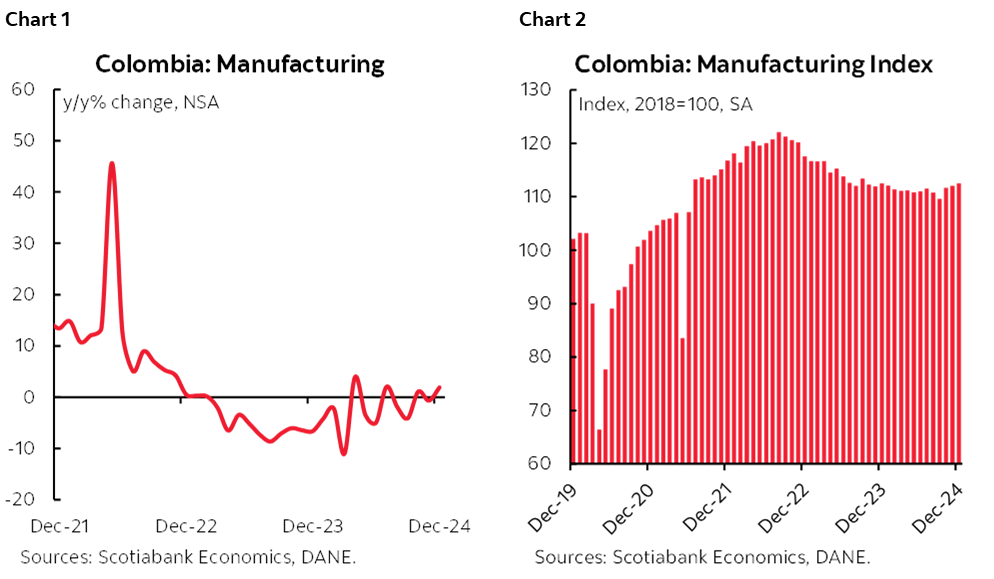
On Friday, February 14th, the National Institute of Statistics (DANE) published the manufacturing production and retail sales data for December 2024. Manufacturing production increased 1.9% y/y, above the market expectation of 0.6% y/y. Meanwhile, retail sales increased 7.8% y/y, below the market expectation of 8.8%. We attributed the strong performance of retail sales, in part, to statistical base effects coming from a 4.6% y/y contraction in December 2023, and to the surge of better demand for durable goods in the case of retail sales; it is worth noting that in December, the holiday season drove stronger demand at the end of 2024, but it was lower than expected. Having said that, it will be interesting to monitor how the demand recovery evolves given that FX appreciation could have some impact on imported prices but also considering that the minimum wage increase also impacts consumer inflation.
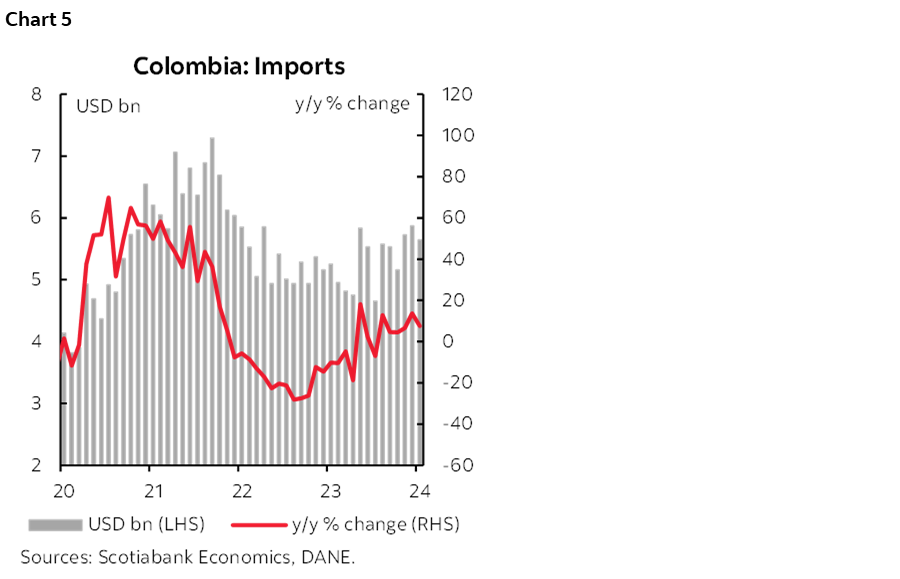
Manufacturing output reversed the negative trend observed in November and contracted during the period. December results showed a positive performance in the manufacturing sector compared to the previous year (+1.9% y/y), following a 6.6% drop during the same period last year (chart 1). However, on a seasonally adjusted basis, activity appears to be continuing its expansion (chart 2). In this context, positive contributions came from beverage manufacturing, the sugar and panela industry, and the transport equipment industry. However, the mineral industry, pharmaceutical sector, and the paper and cardboard industry offset growth during this period.
Retail sales continued their positive trend for the seventh consecutive month, but showed a slowdown compared to the previous month’s performance. In December, retail sales increased by 7.8% y/y (chart 3), explained by strong telecommunication equipment sales (+46.4% y/y) and vehicle sales (+29.4% for household vehicles and +15.3% for other vehicles) which together accounted for 4.2 ppts of the total growth. This positive performance could be attributed to the price stability of tradable goods for many months and the impact of the FX performance, which has shown an appreciation of 3.7% during 2025, is something that we must monitor. Additionally, the extended period of discounts apart of the Black Friday, Cyber-Monday and holiday season helped boost demand.

On the downside, sales in the textile sector, which fell by -7.3% y/y, are particularly concerning as they have declined for almost two years. In monthly seasonally adjustment terms, retail sales in December (excluding other vehicles) decreased by 0.7% m/m and could be explained by the huge growth recorded in November (+2.3% m/m), but it also shows that the boost on demand expected in the Christmas season was not as expected (chart 4).

On Monday, February 17th, the general picture of economic activity in 2024 will be released with the publication of GDP for Q4- 2024, in which we could see the recent figures for retail and manufacturing. However, it will be relevant to monitor whether the sectors that had a positive dynamic during the first half of the 2024 continue this month in the same way or whether it will be time to see that the transitory effects in agriculture and public administration will weigh against growth. All in all, the economic performance so far in 2024 is a reason for the central bank to continue the easing cycle, however, won’t motivate an acceleration of this process. At Scotiabank Colpatria, the expectation is that the central bank will cut the interest rate by 25bps to 9.25% during the monetary meeting on March 31st.
Key Highlights:
- Manufacturing production increased 1.9% y/y. 22 of the 39 activities showed annual expansion. On the positive side, notable contributors included beverage manufacturing (+2.2% y/y), the sugar and panela production sector (+16.8% y/y), the transport equipment industry (+38.0% y/y), together contributing +0.9 ppts to the result. In contrast the mineral industry (-7.6% y/y), the pharmaceutical industry (-7.8% y/y) and paper and cardboard production (-5.2% y/y) were the main sectors driving the negative outcome for the month, collectively contributing -1.0 ppts.
- Retail sales grew 7.8% y/y. 16 of the 19 activities registered positive variations. Telecommunication equipment sales (+46.4% y/y) and vehicle sales (+29.4% for household vehicles and +15.3% for other vehicles), were the ones that contributed the most to retail sales growth. Meanwhile, on the negative side, textile sector sales (-7.3% y/y) was the one which offset in -0.8 ppts the registered in the period.
- From January to December 2024, the sale of textile products has experienced the greatest deterioration with a drop of -10.6% compared to the same period in 2023, while the sales of vehicles and telecommunication equipment are the ones that have had the best contribution to the result with an expansion of +8.9%.
—Valentina Guio
IMPORTS IN 2024 INCREASED, DRIVING THE WIDENING TRADE DEFICIT
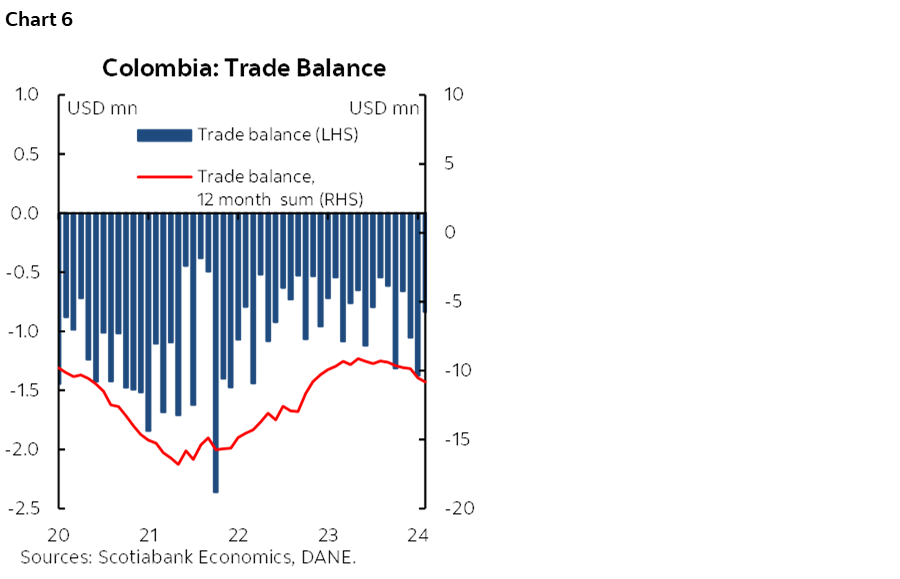
On Friday, February 14th, DANE published the import data for December 2024. Imports reached US $5.61 billion CIF. Imports increased by 7.5% compared to the same month in 2023 (chart 5), maintaining the positive trend for the sixth consecutive month. However, imports fell compared to November by -3.8%. In December, the import boost was mainly explained by the importing of manufacturing (+8.7% y/y) and the importing of fuels (+14.7% y/y), contributing 6.1 ppts and 2.0 ppts, respectively. Meanwhile, the importing of agricultural products and food fell -3.6% y/y, partially offset by 0.6 ppts.
In the year-to-date, exports totaled US $64.1 billion CIF, a figure 2.1% higher than that recorded in 2023 (US $62.79 billion CIF). Manufacturing imports were the ones that contributed the most to total growth in 2024, registering a total of US $47.39 billion CIF (+3.9% y/y), contributing 3.9 ppts. Meanwhile, the importing of agricultural and food products, and the importing of fuels decreased by -2.5% y/y and -3.2% y/y, respectively. Additionally, importing of consumer goods increased by 9.6% y/y, reflecting a recovery in domestic demand. Food imports stand out with an increase of 12.4% y/y, vehicles (+ 9.1% y/y), and household appliances (21.9% y/y), being those that contributed the most to the growth of the importing of durable goods. For its part, importing of raw materials increased by 1.3% y/y with a total of US $30.85 billion CIF, reaching a share of 48.1% of total imports, while the importing of capital goods and construction materials fell -2.8% y/y, totaling US $17.27 billion CIF (27% of total imports), mainly due to a drop in transport equipment imports.
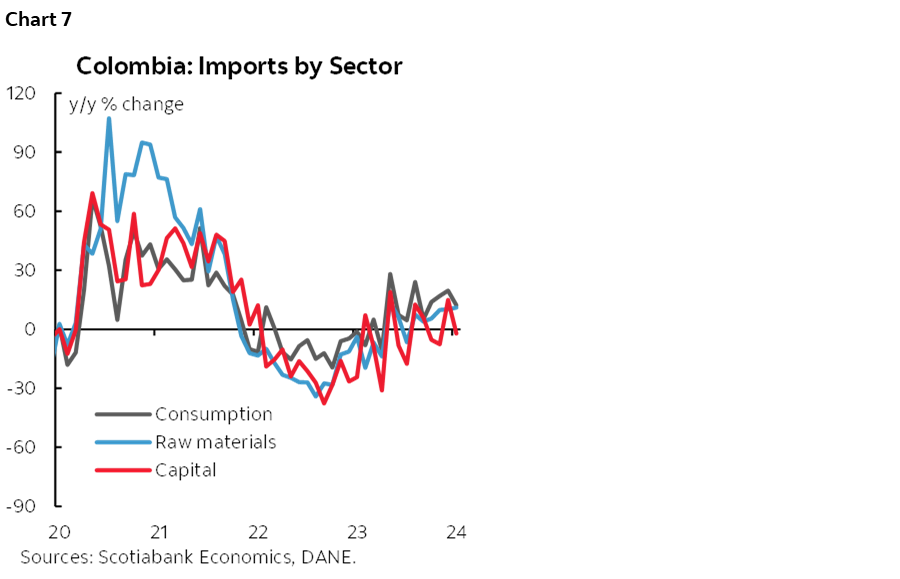
The trade balance stood at US $835 million, widening the deficit by 53.8% compared to December 2023 (US $543.7 million) (chart 6). In December, exports contracted mainly due to the exporting of traditional products, especially mining products, impacted by the fall in international oil prices. In 2024, the total deficit was US $10.8 billion, representing an increase of 12% compared to the accumulated deficit of 2023.
Key highlights of December:
- Consumer imports maintained a positive dynamic in the last month of the year. In December, consumer imports grew 12.1% y/y, contributing 2.8 ppts to total import growth. Imports of non-durable goods grew 5.0% y/y, driven by imports of food, beverages, and textile products. Meanwhile, imports of durable consumer goods increased 22.9% y/y, showing a growth of 35.2% y/y in the importing of vehicles.
- Imports of raw materials grew 10.9% y/y. Imports of intermediate goods and raw materials increased in all three subcomponents. Fuel imports grew 15.6% y/y, mainly due to an increase in oil imports. Imports of raw materials for industry grew 10.3% y/y, with mining and pharmaceutical products standing out. Imports of materials for the agricultural sector increased 3% y/y.
- Imports of capital goods fell -2.2% y/y. Imports of construction materials fell -8.1% y/y, breaking the positive trend of 6 months. Imports of transport equipment also fell -12.6% y/y. On the positive side, imports of capital goods for agriculture increased by 15.2% y/y, while imports of capital goods for industry completed 6 months in positive territory, with an expansion of 3.15% y/y (chart 7).
—Daniela Silva
DISCLAIMER
This report has been prepared by Scotiabank Economics as a resource for the clients of Scotiabank. Opinions, estimates and projections contained herein are our own as of the date hereof and are subject to change without notice. The information and opinions contained herein have been compiled or arrived at from sources believed reliable but no representation or warranty, express or implied, is made as to their accuracy or completeness. Neither Scotiabank nor any of its officers, directors, partners, employees or affiliates accepts any liability whatsoever for any direct or consequential loss arising from any use of this report or its contents.
These reports are provided to you for informational purposes only. This report is not, and is not constructed as, an offer to sell or solicitation of any offer to buy any financial instrument, nor shall this report be construed as an opinion as to whether you should enter into any swap or trading strategy involving a swap or any other transaction. The information contained in this report is not intended to be, and does not constitute, a recommendation of a swap or trading strategy involving a swap within the meaning of U.S. Commodity Futures Trading Commission Regulation 23.434 and Appendix A thereto. This material is not intended to be individually tailored to your needs or characteristics and should not be viewed as a “call to action” or suggestion that you enter into a swap or trading strategy involving a swap or any other transaction. Scotiabank may engage in transactions in a manner inconsistent with the views discussed this report and may have positions, or be in the process of acquiring or disposing of positions, referred to in this report.
Scotiabank, its affiliates and any of their respective officers, directors and employees may from time to time take positions in currencies, act as managers, co-managers or underwriters of a public offering or act as principals or agents, deal in, own or act as market makers or advisors, brokers or commercial and/or investment bankers in relation to securities or related derivatives. As a result of these actions, Scotiabank may receive remuneration. All Scotiabank products and services are subject to the terms of applicable agreements and local regulations. Officers, directors and employees of Scotiabank and its affiliates may serve as directors of corporations.
Any securities discussed in this report may not be suitable for all investors. Scotiabank recommends that investors independently evaluate any issuer and security discussed in this report, and consult with any advisors they deem necessary prior to making any investment.
This report and all information, opinions and conclusions contained in it are protected by copyright. This information may not be reproduced without the prior express written consent of Scotiabank.
™ Trademark of The Bank of Nova Scotia. Used under license, where applicable.
Scotiabank, together with “Global Banking and Markets”, is a marketing name for the global corporate and investment banking and capital markets businesses of The Bank of Nova Scotia and certain of its affiliates in the countries where they operate, including; Scotiabank Europe plc; Scotiabank (Ireland) Designated Activity Company; Scotiabank Inverlat S.A., Institución de Banca Múltiple, Grupo Financiero Scotiabank Inverlat, Scotia Inverlat Casa de Bolsa, S.A. de C.V., Grupo Financiero Scotiabank Inverlat, Scotia Inverlat Derivados S.A. de C.V. – all members of the Scotiabank group and authorized users of the Scotiabank mark. The Bank of Nova Scotia is incorporated in Canada with limited liability and is authorised and regulated by the Office of the Superintendent of Financial Institutions Canada. The Bank of Nova Scotia is authorized by the UK Prudential Regulation Authority and is subject to regulation by the UK Financial Conduct Authority and limited regulation by the UK Prudential Regulation Authority. Details about the extent of The Bank of Nova Scotia's regulation by the UK Prudential Regulation Authority are available from us on request. Scotiabank Europe plc is authorized by the UK Prudential Regulation Authority and regulated by the UK Financial Conduct Authority and the UK Prudential Regulation Authority.
Scotiabank Inverlat, S.A., Scotia Inverlat Casa de Bolsa, S.A. de C.V, Grupo Financiero Scotiabank Inverlat, and Scotia Inverlat Derivados, S.A. de C.V., are each authorized and regulated by the Mexican financial authorities.
Not all products and services are offered in all jurisdictions. Services described are available in jurisdictions where permitted by law.