- Chile: Unemployment rate falls to 8.7% driven by significant recovery in self-employment
- Colombia: In July, employment remains strong, especially in urban areas
- Peru: Mortgage lending surges in 1H25, highest half-yearly placement since 2H21; 2025 Forecast
CHILE: UNEMPLOYMENT RATE FALLS TO 8.7% DRIVEN BY SIGNIFICANT RECOVERY IN SELF-EMPLOYMENT
- Notable decline in seasonally adjusted unemployment rate. Sharp adjustment in labour informality. Policy rate within neutral range.
Today, the INE released the unemployment rate for the quarter ending in July, which fell to 8.7% (chart 1), a figure that positively surprised market expectations and was supported by a significant recovery in self-employment. After three consecutive quarters of job destruction in self-employment, a notable rebound is observed, explaining much of the surprise. Moreover, the seasonally adjusted unemployment rate dropped to 8.6%, driven by the creation of 39k jobs in a context of a modest increase in the labour force (+8k SA).

There was a creation of 27k own-account employment jobs (chart 2), mainly in the commerce sector (+11k) and professional activities (+7k). Similarly, 6k informal jobs were created compared to the previous quarter. On the other hand, the manufacturing sector stood out with the creation of 34k jobs, mostly private salaried positions, marking the largest quarterly increase in over four years (since April 2021). On the downside, the commerce sector also saw a destruction of private salaried jobs, which, although representing a net decline of only 7k jobs for the sector, reflects a deterioration in job quality within commerce.

Twelve-month job creation recovered after stagnation observed in the previous quarter. On a year-over-year basis, 72k new jobs were created, mainly due to a lower destruction of informal employment, which even shows marginal recovery. Meanwhile, after three consecutive quarters of formal job destruction, a nascent recovery is observed at the margin, supported by the positive performance of sectors such as manufacturing.
The improved labour market, alongside a fully closed output gap, facilitates a “cautious mode” for monetary policy, allowing the central bank to maintain the policy rate. Indeed, the output gap is considered closed following recent growth, with seasonally adjusted recovery in consumption and investment, and non-mining GDP reaching its highest historical level. The complexity for monetary policy was previously centered on the labour market, where the seasonally adjusted unemployment rate stood at 8.9% in the April–June quarter, clearly within the estimated NAIRU range by the central bank, supporting continued rate cuts.
This new employment data for the May–July quarter shows a significant drop in the seasonally adjusted unemployment rate to 8.6%, placing it very close to the NAIRU reference range, making it easier for the central bank to deliver a conservative message in the September Monetary Policy Report regarding future rate cuts. In Scotiabank’s baseline scenario, we do not expect a new rate cut before the December meeting, and we reiterate that the neutral policy rate has room to be revised by the central bank toward the 3.75%–4.75% range, implying that the current rate (4.75%) is already within the neutral range.
—Aníbal Alarcón
COLOMBIA: IN JULY, EMPLOYMENT REMAINS STRONG, ESPECIALLY IN URBAN AREAS
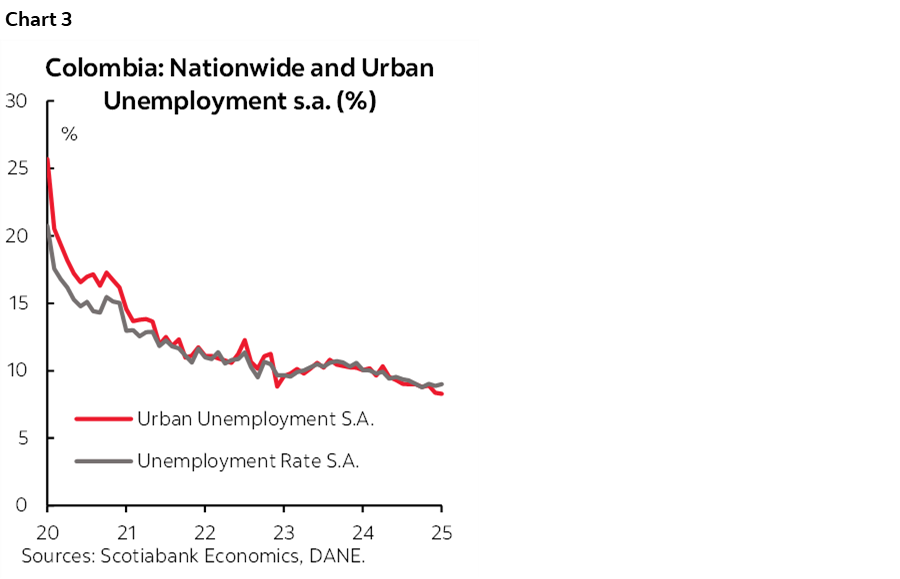
Today, DANE published labour market data for July 2025. The national unemployment rate stood at 8.8%, down 1.1 percentage points from the 9.9% recorded in July 2024. Urban unemployment showed the most significant improvement, falling from 10.2% in July 2024 to 8.4% in the latest data.
Seasonally adjusted figures show mild changes: the national unemployment rate increased slightly from 8.9% in June to 9.0% in July, while the urban rate decreased from 8.4% to 8.3% (chart 3). It is worth noting that this improvement is occurring in a context where the labour force participation rate has not yet returned to pre-pandemic levels. Currently, it stands at 64.2%, below the ~65% observed before the pandemic.
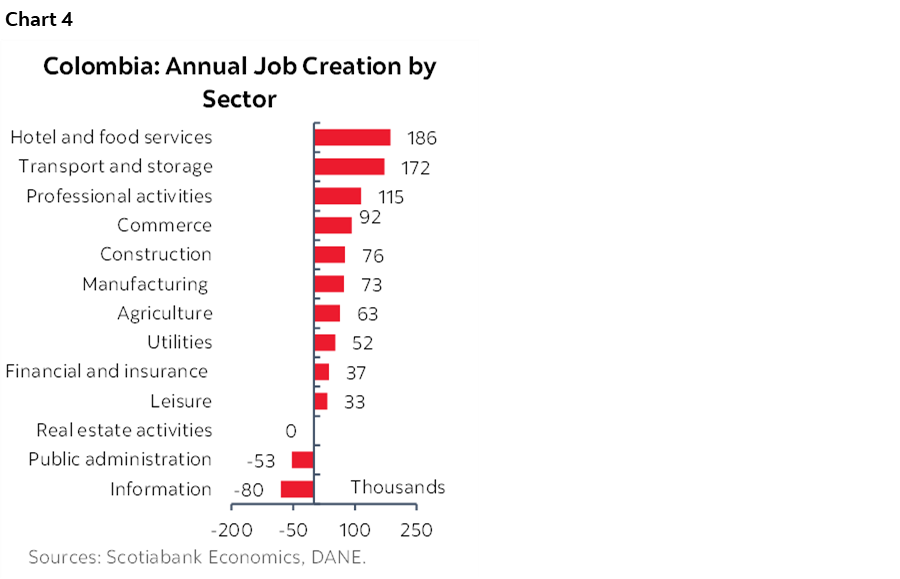
Compared to one year ago, the economy created 766,000 jobs, a 3.3% y/y increase, with urban areas accounting for 49% of the total job growth. By sector, job creation reflects the performance of economic activity, with service-related sectors being the most dynamic. The three leading sectors were: hotels and restaurants (+186,000); transport and logistics (+172,000) and professional services (+115,000). Together, these sectors accounted for 62% of total job gains. In the case of transport, the increase reflects a recovery from job losses a year ago, while gains in hotels, restaurants, and professional services are built on robust growth.
The sectors that lost jobs compared to a year ago were: IT services (-80,000); public administration, defense, education, and health (-53,000) (chart 4). It is worth highlighting that today’s figures show a stronger contribution from the private sector in job creation, which may be linked to economic growth. However, some indirect hiring by the public sector may also be involved—this is something we will continue to monitor.
Regarding the quality of employment, job gains are also reflected in a lower informality rate, which declined from 55.9% in the May–July 2024 quarter to 55.0% in the same period of 2025. According to DANE, formal job creation is concentrated in urban areas. As noted in previous reports, part of this formal employment may be driven indirectly by public sector hiring, which we will continue to track.
The average unemployment rate is expected to decline from 10.2% in 2024 to 9.7% in 2025, driven by stronger labour force participation and a faster pace of job creation. However, the possibility of a lower unemployment rate cannot be ruled out, depending on how effectively the economy absorbs new labour market entrants. The implementation of certain aspects of the labour reform will also be a key point of assessment in the coming months.
For now, employment data is not a major concern for the central bank. On the contrary, such robust figures support our call for rate stability at 9.25% for the remainder of 2025.
—Jackeline Piraján & Valentina Guio
PERU: MORTGAGE LENDING SURGES IN 1H25, HIGHEST HALF-YEAR PLACEMENT SINCE 2H21
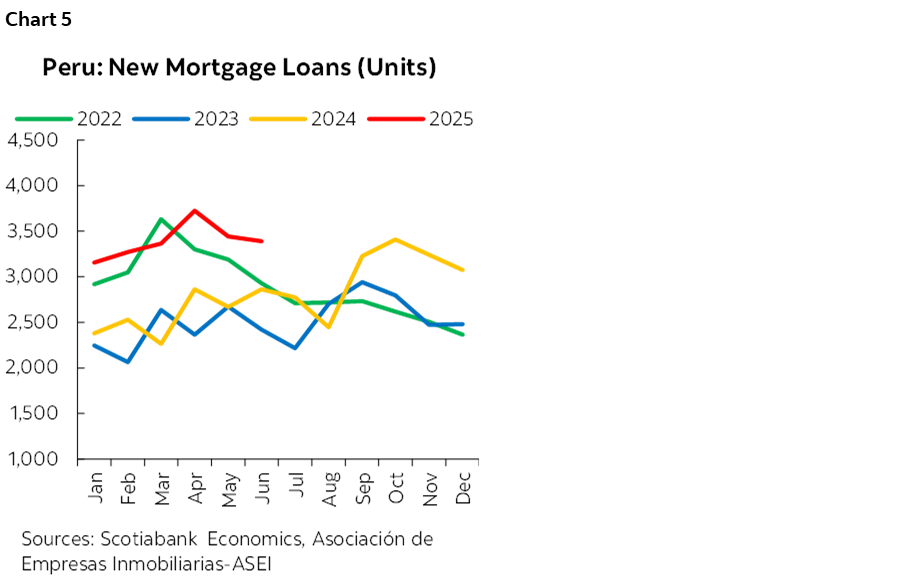
During the first half of 2025 (1H25), new mortgage loan placements (NCH) lending totaled 20,345 loans, up nearly 31% compared to 1H24, according to figures from the Superintendencia de Banca, Seguros y AFP (SBS). The result for 1H25 is the highest half-year placement since 2H21 (21,897 loans). Also, the figure for April of this year was the highest monthly placement since December 2021, according to figures from the SBS (chart 5).
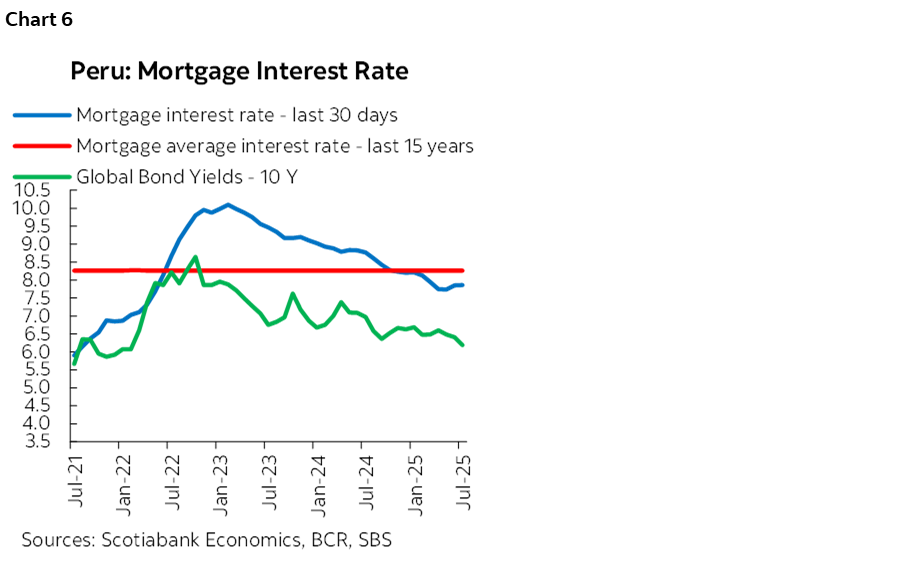
Meanwhile, home sales in Lima exceeded 12,000 units during the first half of 2025, 25% more than in the 1H24, according to information from Confederación de Desarrolladores Inmobiliarios del Perú (CODIP). Lower average interest rates on bank mortgages (7.8% at the end of July), reduced inflationary pressures (1.7% in August, down from 1.9% in 2024), a lower sol-dollar exchange rate in recent months (reducing sales prices in soles), and improved private employment and income would explain these results (chart 6).
However, the sector’s performance during 1H25 was limited by lower disbursements of NCMV loans, with 3,677 loans placed, 10% less than in the first half of 2024. Difficulties in developing social housing projects in some districts of Lima (representing 60% of total loans) are affecting supply in this segment, with NCMV lending in this city falling 9% in 1H25. We expect that by the end of the year, the level of placements will exceed that of 2024 (8,573 loans), given that there will no longer be budgetary difficulties this year.
2025 FORECAST
Our projections for 2025 indicate that the real estate sector will expand at a rate three times higher than that of the construction sector, which we expect to grow by 4.5% over the course of the year. This positive outlook is based on our forecast of increased new mortgage loan placements (NCH), mainly driven by higher home sales in Lima and a rebound in loans for social housing.
Several forces support this outlook for the real estate sector. A gradual decrease in the mortgage rate—following trends in the BCRP reference rate and the 10-year bond yield in soles—has made monthly payments more affordable. Stable construction prices have helped new project developments, while a lower sol-dollar exchange rate has lowered home prices in soles. Improved formal employment in the private sector and higher real incomes, along with reduced inflationary pressure, further encourage home purchases.
Looking ahead, by the end of 2025, we expect NCH placement to increase by around 13%, slightly above the 2024 figure (+12%), adding around 38,000 mortgage loans, though this will still be below the record set in 2021 (43,882). As noted, this growth will be driven by new home sales in Lima, which we anticipate rising by about 16% by the end of 2025, with just over 24,000 units sold, based on data from the CODIP. Additionally, there will be a recovery in social housing sales, as disbursements under the Nuevo Crédito Mivivienda (NCMV) program are expected to slightly surpass 2024 levels, a year in which placements declined 20%, marking the lowest annual total since the pandemic (2020).
—Carlos Asmat
DISCLAIMER
This report has been prepared by Scotiabank Economics as a resource for the clients of Scotiabank. Opinions, estimates and projections contained herein are our own as of the date hereof and are subject to change without notice. The information and opinions contained herein have been compiled or arrived at from sources believed reliable but no representation or warranty, express or implied, is made as to their accuracy or completeness. Neither Scotiabank nor any of its officers, directors, partners, employees or affiliates accepts any liability whatsoever for any direct or consequential loss arising from any use of this report or its contents.
These reports are provided to you for informational purposes only. This report is not, and is not constructed as, an offer to sell or solicitation of any offer to buy any financial instrument, nor shall this report be construed as an opinion as to whether you should enter into any swap or trading strategy involving a swap or any other transaction. The information contained in this report is not intended to be, and does not constitute, a recommendation of a swap or trading strategy involving a swap within the meaning of U.S. Commodity Futures Trading Commission Regulation 23.434 and Appendix A thereto. This material is not intended to be individually tailored to your needs or characteristics and should not be viewed as a “call to action” or suggestion that you enter into a swap or trading strategy involving a swap or any other transaction. Scotiabank may engage in transactions in a manner inconsistent with the views discussed this report and may have positions, or be in the process of acquiring or disposing of positions, referred to in this report.
Scotiabank, its affiliates and any of their respective officers, directors and employees may from time to time take positions in currencies, act as managers, co-managers or underwriters of a public offering or act as principals or agents, deal in, own or act as market makers or advisors, brokers or commercial and/or investment bankers in relation to securities or related derivatives. As a result of these actions, Scotiabank may receive remuneration. All Scotiabank products and services are subject to the terms of applicable agreements and local regulations. Officers, directors and employees of Scotiabank and its affiliates may serve as directors of corporations.
Any securities discussed in this report may not be suitable for all investors. Scotiabank recommends that investors independently evaluate any issuer and security discussed in this report, and consult with any advisors they deem necessary prior to making any investment.
This report and all information, opinions and conclusions contained in it are protected by copyright. This information may not be reproduced without the prior express written consent of Scotiabank.
™ Trademark of The Bank of Nova Scotia. Used under license, where applicable.
Scotiabank, together with “Global Banking and Markets”, is a marketing name for the global corporate and investment banking and capital markets businesses of The Bank of Nova Scotia and certain of its affiliates in the countries where they operate, including; Scotiabank Europe plc; Scotiabank (Ireland) Designated Activity Company; Scotiabank Inverlat S.A., Institución de Banca Múltiple, Grupo Financiero Scotiabank Inverlat, Scotia Inverlat Casa de Bolsa, S.A. de C.V., Grupo Financiero Scotiabank Inverlat, Scotia Inverlat Derivados S.A. de C.V. – all members of the Scotiabank group and authorized users of the Scotiabank mark. The Bank of Nova Scotia is incorporated in Canada with limited liability and is authorised and regulated by the Office of the Superintendent of Financial Institutions Canada. The Bank of Nova Scotia is authorized by the UK Prudential Regulation Authority and is subject to regulation by the UK Financial Conduct Authority and limited regulation by the UK Prudential Regulation Authority. Details about the extent of The Bank of Nova Scotia's regulation by the UK Prudential Regulation Authority are available from us on request. Scotiabank Europe plc is authorized by the UK Prudential Regulation Authority and regulated by the UK Financial Conduct Authority and the UK Prudential Regulation Authority.
Scotiabank Inverlat, S.A., Scotia Inverlat Casa de Bolsa, S.A. de C.V, Grupo Financiero Scotiabank Inverlat, and Scotia Inverlat Derivados, S.A. de C.V., are each authorized and regulated by the Mexican financial authorities.
Not all products and services are offered in all jurisdictions. Services described are available in jurisdictions where permitted by law.