- Colombia: Imports continued growing and the deficit widened in June
- Peru: July cement sales were the highest of the year
COLOMBIA: IMPORTS CONTINUED GROWING AND THE DEFICIT WIDENED IN JUNE
On Tuesday, August 19th, DANE published import data for June. Imports reached US$5.33 bn CIF (chart 1) on a 14.52% y/y increase, maintaining the positive trend for one year excluding April 2025. In sequential terms, imports decreased 13% compared to the previous month. The annual increase is explained by manufacturing with a contribution of 96% of total variation.
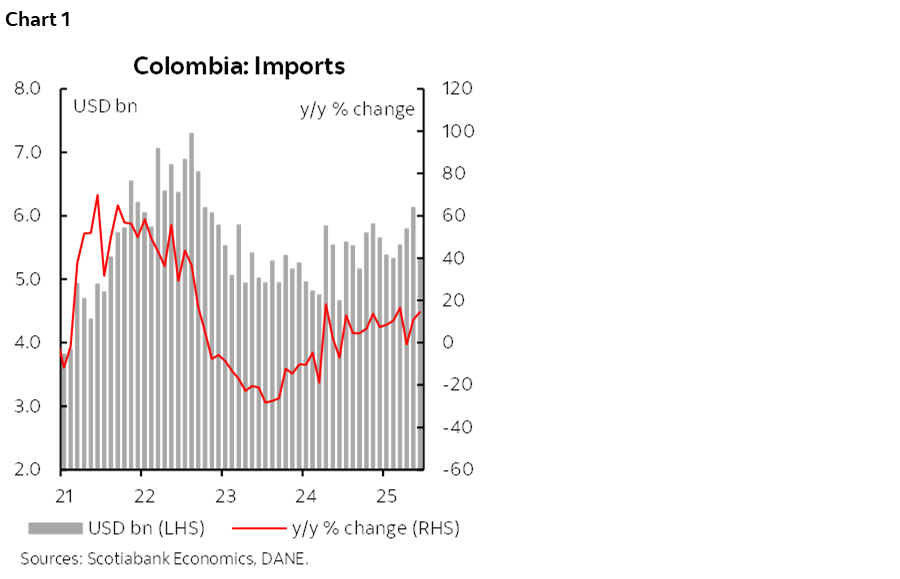
The imports result reflects increased domestic demand. In the second quarter, imports totaled US$17.2 billion CIF, representing a 7.7% increase compared to the second quarter of 2024. Furthermore, according to Q2 GDP data, imports of goods and services increased 9.7%, mainly due to the goods component, associated with higher household spending, which increased 3.7% annually in Q2-2025. Commerce will continue to be one of the activities with the best performance, which explains why the positive momentum in imports will continue.
Imports of consumer goods remain positive, while imports of capital goods show signs of recovery. In June, consumer goods imports grew the most, at 18.7% y/y, followed by imports of capital goods, at 14.6% y/y, completing two consecutive months of expansion. Imports of capital goods are associated with a slight recovery in investment, especially in machinery and equipment.
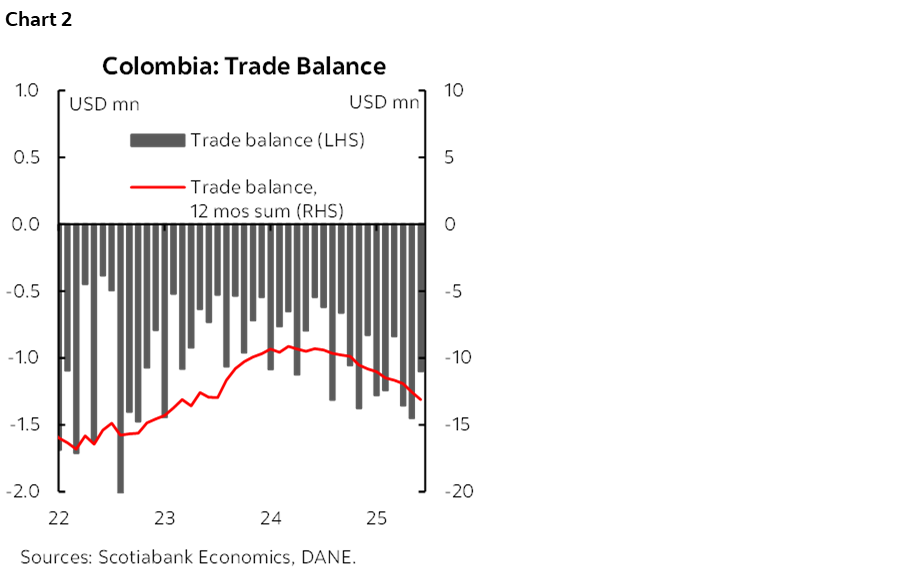
The trade deficit stood at US$1.09 bn, or roughly double compared to June 2024 ($545.2 million) (chart 2). In June, exports grew by 3% y/y, too low of a growth rate to offset the deficit caused by a broader increase in imports. The accumulated deficit in the second quarter was US$3.9 bn, representing a 58% increase compared to the trade deficit recorded during the same period in 2024.
Highlights:
- Consumer imports maintained positive momentum (chart 3). In June, consumer imports grew by 18.7% y/y, contributing 4.9 ppts to the total result. Imports of non-durable goods increased 13.1% y/y, mainly due to higher imports of pharmaceutical products (+21.6% y/y) and other non-durable products registered a 24.8% y/y increase, contributing 5bps. Imports of durable consumer goods increased 25.8% y/y, with a 41.3% y/y increase in vehicle imports and a 38.6% increase in household goods.
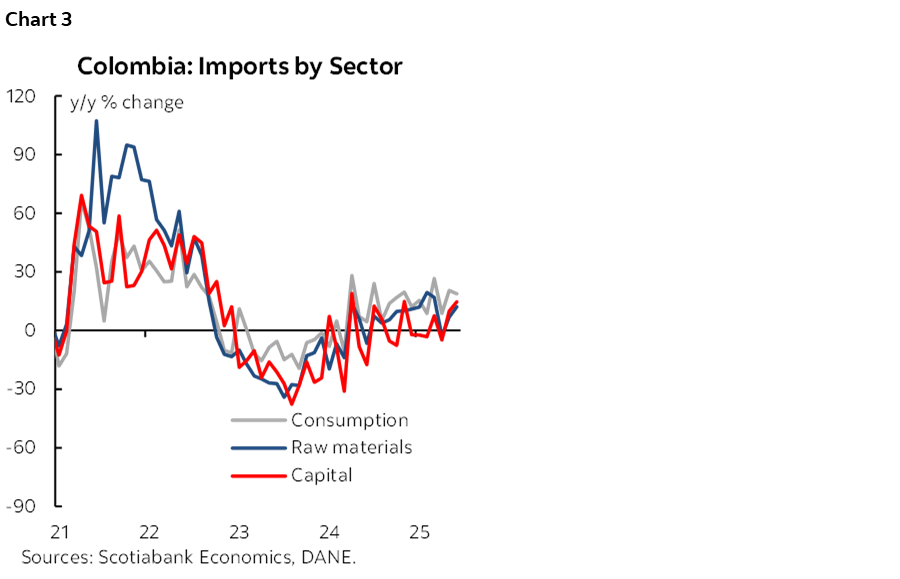
- Imports of raw materials increased 12.1% y/y. This was mainly due to the agricultural sector with a growth of 32.9%, and 12.9% in imports of materials for industry. Meanwhile, on the negative side, imports of fuel decreased 1.7% y/y, due to decrease in oil and electricity.
- Imports of capital goods increased 14.6% y/y. Imports of construction material increased 5.5% y/y. In the industrial sector the dynamic was positive with an increase of 11.1% y/y, mainly due to higher imports of tools (+38.5% y/y). Equipment imports also increased by 36.3% y/y, while capital imports for agriculture fell by 8.6%, respectively (chart 3 again).
—Jackeline Piraján & Daniela Silva
PERU: JULY CEMENT SALES WERE THE HIGHEST OF THE YEAR
Local cement sales in July reached their highest level of the year and the highest level since October 2024, exceeding our expectations. This growth was mainly fueled by rising demand from self-build projects, with further momentum provided by the real estate sector. However, reduced public investment curtailed additional expansion in July (chart 4).
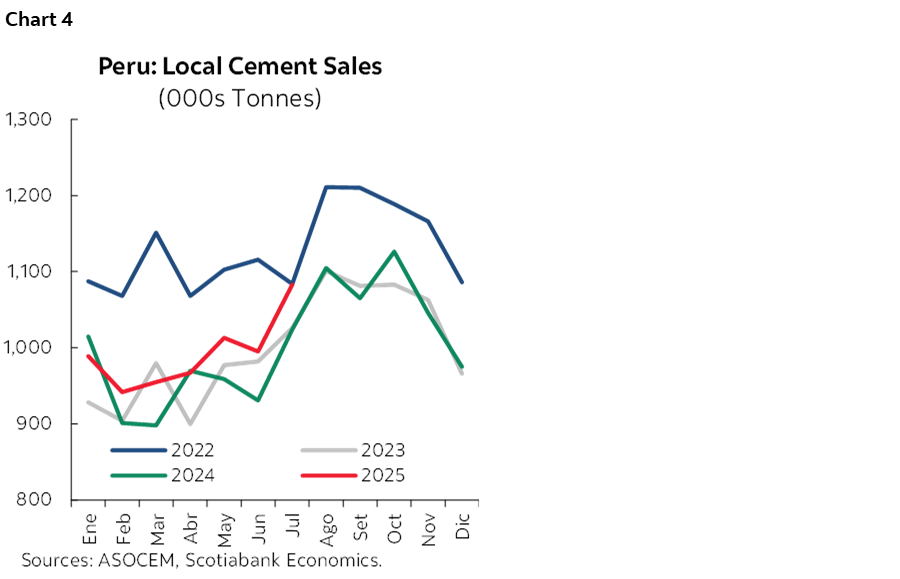
Cement sales grew 5.8% y/y in July, slightly below June’s rate, marking the third consecutive month of annual growth and reaching 1,083 thousand tons—surpassing our expectations. This increase was largely driven by robust demand from the self-build segment, which represents around 70% of cement consumption and is linked to the gradual recovery of formal private employment. The real estate sector also played a key role, with an 18% y/y rise in new mortgage loans according to Superintendencia de Banca y Seguros (SBS) and a 31% increase in home sales in Lima (CODIP). Furthermore, construction material prices remained relatively stable—especially for imported materials—thanks to the appreciation of the sol against the dollar in the last months, which benefited high-value projects (chart 5).
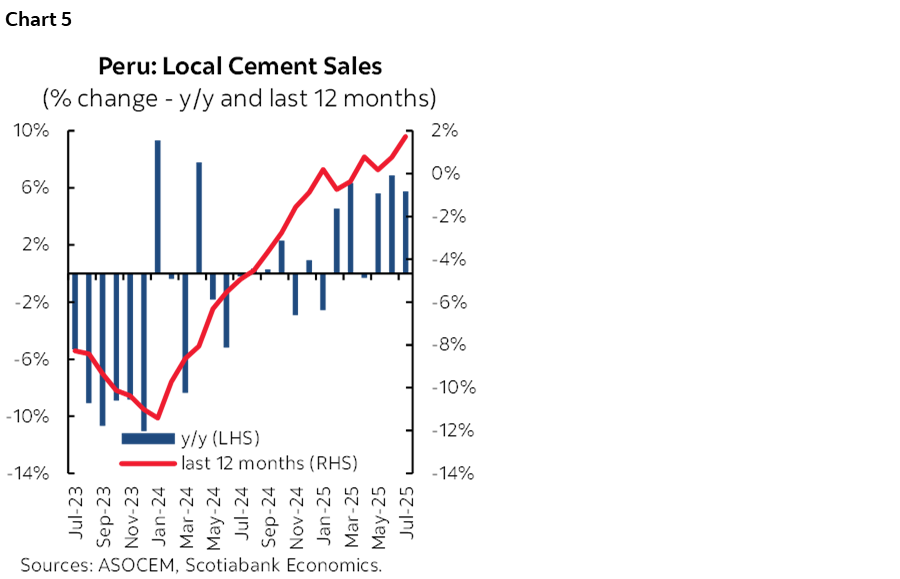
Thus, the average price of cement in metropolitan Lima in July remained unchanged from June (30.51 soles per bag), a level that remained below the price at the end of 2024 (30.60 soles per bag), according to figures from the Instituto Nacional de Estadística e Informática (INEI). However, July’s result was limited by lower demand for this input for public sector construction projects, as public investment fell by nearly 6% y/y in July, according to figures from the Banco Central de Reserva del Perú (BCRP).
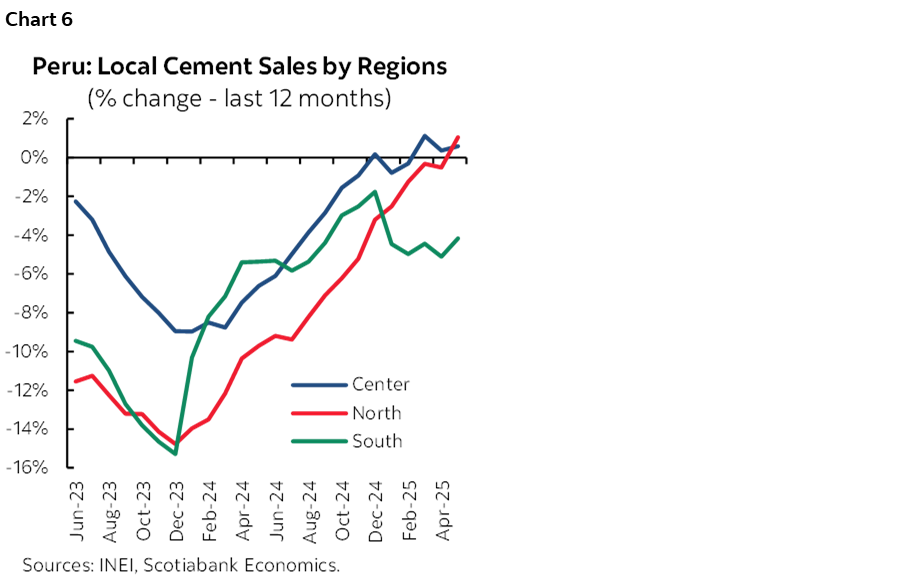
With this result, cement consumption grew 3.7% to July, according to Asociación de Productores de Cemento (ASOCEM), mainly supported by self-build projects, which saw notable growth in the north (6.4% in H1 2025) and additional gains in the central (+1.4%) and southern regions (+0.6%), based on INEI data. Also, sales of construction bars—a related indicator—rose 13% in 1H25 compared to 1H24, reinforcing strong performance in the self-construction segment. Higher demand in the real estate sector, especially in Lima, was reflected in new mortgage lending, which grew 31% in the 1H25 compared to the same period in 2024 (chart 6).
Looking ahead, we expect cement consumption to increase in August, likely surpassing July’s volume, though year-on-year growth may be slightly lower due to a high base in August 2024—the second highest level in 2024. We forecast sales of just over 1 million metric tons. Based on July’s results, we maintain a positive outlook for year-end 2025, consistent with our 4% growth projection for the construction sector.
—Carlos Asmat
DISCLAIMER
This report has been prepared by Scotiabank Economics as a resource for the clients of Scotiabank. Opinions, estimates and projections contained herein are our own as of the date hereof and are subject to change without notice. The information and opinions contained herein have been compiled or arrived at from sources believed reliable but no representation or warranty, express or implied, is made as to their accuracy or completeness. Neither Scotiabank nor any of its officers, directors, partners, employees or affiliates accepts any liability whatsoever for any direct or consequential loss arising from any use of this report or its contents.
These reports are provided to you for informational purposes only. This report is not, and is not constructed as, an offer to sell or solicitation of any offer to buy any financial instrument, nor shall this report be construed as an opinion as to whether you should enter into any swap or trading strategy involving a swap or any other transaction. The information contained in this report is not intended to be, and does not constitute, a recommendation of a swap or trading strategy involving a swap within the meaning of U.S. Commodity Futures Trading Commission Regulation 23.434 and Appendix A thereto. This material is not intended to be individually tailored to your needs or characteristics and should not be viewed as a “call to action” or suggestion that you enter into a swap or trading strategy involving a swap or any other transaction. Scotiabank may engage in transactions in a manner inconsistent with the views discussed this report and may have positions, or be in the process of acquiring or disposing of positions, referred to in this report.
Scotiabank, its affiliates and any of their respective officers, directors and employees may from time to time take positions in currencies, act as managers, co-managers or underwriters of a public offering or act as principals or agents, deal in, own or act as market makers or advisors, brokers or commercial and/or investment bankers in relation to securities or related derivatives. As a result of these actions, Scotiabank may receive remuneration. All Scotiabank products and services are subject to the terms of applicable agreements and local regulations. Officers, directors and employees of Scotiabank and its affiliates may serve as directors of corporations.
Any securities discussed in this report may not be suitable for all investors. Scotiabank recommends that investors independently evaluate any issuer and security discussed in this report, and consult with any advisors they deem necessary prior to making any investment.
This report and all information, opinions and conclusions contained in it are protected by copyright. This information may not be reproduced without the prior express written consent of Scotiabank.
™ Trademark of The Bank of Nova Scotia. Used under license, where applicable.
Scotiabank, together with “Global Banking and Markets”, is a marketing name for the global corporate and investment banking and capital markets businesses of The Bank of Nova Scotia and certain of its affiliates in the countries where they operate, including; Scotiabank Europe plc; Scotiabank (Ireland) Designated Activity Company; Scotiabank Inverlat S.A., Institución de Banca Múltiple, Grupo Financiero Scotiabank Inverlat, Scotia Inverlat Casa de Bolsa, S.A. de C.V., Grupo Financiero Scotiabank Inverlat, Scotia Inverlat Derivados S.A. de C.V. – all members of the Scotiabank group and authorized users of the Scotiabank mark. The Bank of Nova Scotia is incorporated in Canada with limited liability and is authorised and regulated by the Office of the Superintendent of Financial Institutions Canada. The Bank of Nova Scotia is authorized by the UK Prudential Regulation Authority and is subject to regulation by the UK Financial Conduct Authority and limited regulation by the UK Prudential Regulation Authority. Details about the extent of The Bank of Nova Scotia's regulation by the UK Prudential Regulation Authority are available from us on request. Scotiabank Europe plc is authorized by the UK Prudential Regulation Authority and regulated by the UK Financial Conduct Authority and the UK Prudential Regulation Authority.
Scotiabank Inverlat, S.A., Scotia Inverlat Casa de Bolsa, S.A. de C.V, Grupo Financiero Scotiabank Inverlat, and Scotia Inverlat Derivados, S.A. de C.V., are each authorized and regulated by the Mexican financial authorities.
Not all products and services are offered in all jurisdictions. Services described are available in jurisdictions where permitted by law.